On April 1, NOAA’s Weather Prediction Center (WPC) officially upgraded its national forecast charts that depict daily weather across the U.S. for the upcoming three days. These are the most substantial changes to the iconic NOAA charts in more than 18 years and were implemented after an extensive experimental phase and feedback process.
The national forecast chart is used extensively across the weather enterprise and is shared daily with more than 40,000 emergency management contacts through the Federal Emergency Management Agency (FEMA).
The new charts are cleaner, easier-to-read, and display daily weather features and hazardous weather forecasts over the contiguous United States. In addition to severe weather and flash flooding, areas of rain, snow, freezing rain, thunderstorms, mixed precipitation, and tropical cyclones are plotted on a vibrant and visually appealing map background. The upgrade incorporates the latest mapping services from Esri and other open source data visualization tools.
“The National Forecast Chart is America's 'go-to' summary of the day's weather. This upgrade dramatically modernizes the look, feel, and function of the chart to enable the most effective decision support for our partners,” said David Novak, Ph.D., director for NOAA’s Weather Prediction Center in College Park, Maryland.
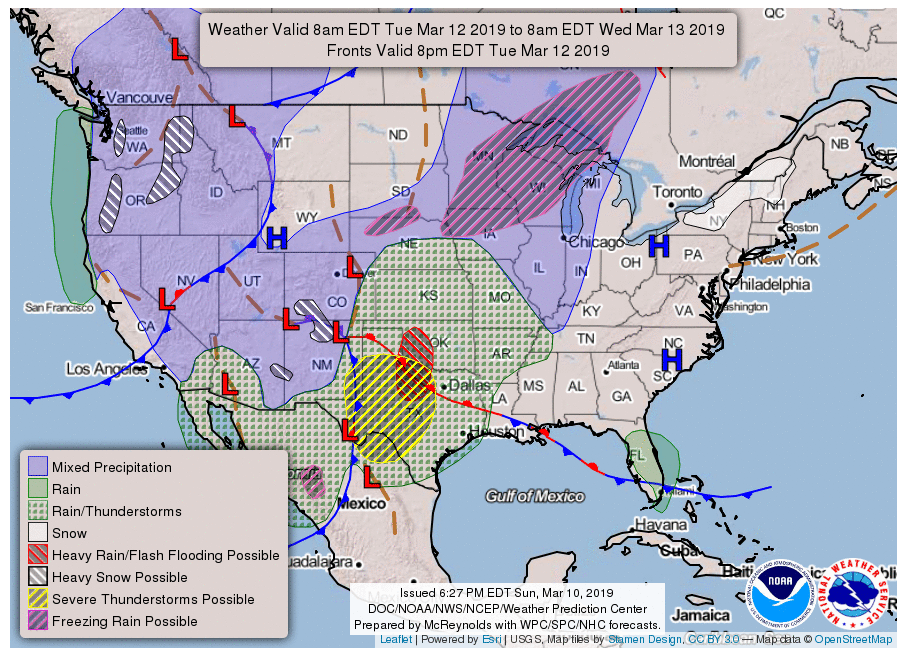 |
| The National Forecast Chart from March 10, 2019, captures a variety of hazardous weather areas and precipitation types highlighted on the new map. (Credit: Weather Prediction Center) |
In addition to the static files, perhaps the most substantial change will introduce an interactive Geographic Information System (GIS) map to display the forecast charts. This allows users the ability to turn weather and hazard layers on and off and provides panning and zoom capabilities.
The charts will continue to be available in a variety of image formats, including pdf files and thumbnail images for NWS and NOAA webpages. A Spanish language version of the national forecast chart will also continue to be produced with the new map format.

