PROBABLE MAX PRECIPITATION
Exceedance Probability Analysis for Selected Storm Events
HDSC analyzes annual exceedance probabilities (AEPs) for selected significant storm events for which observed precipitation amounts for at least one duration have AEP of 1/500 or less over a large area.
AEP maps have been created for the events listed below for selected durations that show the lowest exceedance probabilities for the largest area. For most recent events, associated shapefiles can be downloaded using the links provided in the table. Because the beginning of the observation period for a selected duration is not identical across the area, the AEP map does not characterize isohyets at any particular point in time, but rather within the whole event. For some events, the maximum observed precipitation amounts were also compared with corresponding frequency estimates across a range of durations at central gauged location(s).
| Event |
AEP map duration(s) |
Shapefile |
| Milwaukee, Wisconsin, 9-11 August 2025 |
12-hour, 24-hour |
link |
| Hill Country, Texas, 3-6 July 2025 |
3-hour, 24-hour |
link |
| Middle Mississippi Valley, 2-6 April 2025 |
4-day |
link |
| Helene, 23-28 September 2024 |
3-day |
link |
| Midwest, 14-23 June 2024 |
48-hour, 7-day |
link |
| Northern Minnesota, 18-19 June 2024 |
6-hour, 12-hour, 24-hour |
link |
| West Point, New York, 9 July 2023 |
3-hour |
link |
| Fort Lauderdale, Florida, 12 April 2023 |
12-hour |
link |
| Hurricane Ian, Florida, 28-30 September 2022 |
6-hour, 24-hour |
|
| Post-Tropical Depression Ida, Northeast, 31 August - 2 September 2021 |
3-hour, 6-hour, 12-hour, 24-hour |
link |
| West Central Tennessee, 20-22 August 2021 |
12-hour, 24-hour |
link |
| Imelda, 16-20 September 2019 |
12-hour, 24-hour, 48-hour |
link |
| Remnants of Barry, Arkansas, 15-16 July 2019 |
24-hour |
link |
| South-Central Nebraska, 8 July 2019 |
6-hour |
link |
| Arkansas River Basin, April - May 2019 |
30-day |
link |
| Hurricane Florence, 13-18 September 2018 |
72-hour |
link |
| Michigan and Wisconsin, 14-18 June 2018 |
6-hour, 24-hour, 72-hour |
link |
| Ellicott City, Maryland, 27 May 2018 |
3-hour |
| Hurricane Maria, 20 September 2017 |
12-hour |
link |
| Hurricane Harvey, 25-31 August 2017 |
4-day |
|
| Missouri, 28 April - 2 May 2017 |
48-hour |
link |
| Hurricane Matthew, 6-10 October 2016 |
12-hour |
link |
| Louisiana, 11-13 August 2016 |
48-hour |
|
| Ellicott City, Maryland, 30 July 2016 |
3-hour |
|
| Northern Wisconsin, 11-12 July 2016 |
6-hour |
|
| West Virginia, 23-24 June 2016 |
24-hour |
|
| Lower Mississippi River Valley, 8-12 March 2016 |
48-hour |
|
| Corsicana, Texas, 24-25 October 2015 |
24-hour |
|
| Austin, Texas, 30 October 2015 |
3-hour, 6-hour |
|
| South Carolina, 2 - 4 October 2015 |
24-hour, 72-hour |
|
| Central Texas, 23-24 May 2015 |
3-hour, 6-hour |
|
| Oklahoma, April - June 2015 |
20-day, 30-day, 60-day |
|
| Phoenix, Arizona, 19 August 2014 |
12-hour |
|
| Islip, New York, 13 August 2014 |
3-hour |
|
| Pensacola, Florida, 29-30 April 2014 |
6-hour |
|
| New Mexico, 9-16 September 2013 |
7-day |
|
| Colorado, 9-16 September 2013 |
24-hour, 48-hour, 7-day |
|
| Southern Missouri, 29 July - 8 August 2013 |
10-day |
|
| San Antonio, Texas, 25 May 2013 |
6-hour |
|
| Oklahoma City region, 31 May-1 June 2013 |
4-hour, 6-hour |
|
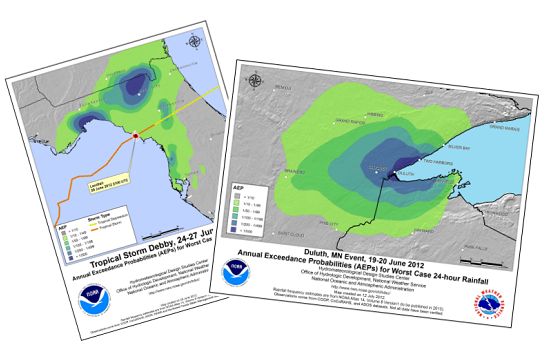
| Tropical storm Debby, 24-27 June 2012 |
48-hour |
|
| Duluth, Minnesota, 19-20 June 2012 |
24-hour |
|
| Tennessee, 1-2 May 2010 |
48-hour |
|
| Southeastern New England, March 2010 |
20-day |
|
| Southeastern United States, September 2009 |
24-hour, 4-day, 7-day |
|
| Ohio Valley, 23 - 27 March 1913 |
96-hour |
|
UNDERLYING DATA
The underlying data for the AEP analyses are grids of observed precipitation data and precipitation frequency estimates at 30-arc second resolution for a range of durations and AEPs.
Observed Precipitation Data
Whenever possible, gridded precipitation data are developed for a range of durations from measurements collected from rain gauges reporting at the time when the map is created. Rain gauges are usually from the National Centers for Environmental Information's- NCEI's Climate Data Online. When rain gauges do not provide sufficient information to depict spatial patterns, the NCEI's multi-sensor Stage IV QPE Product and radar-based NEXRAD Precipitation product are also used to represent observed precipitation data.

