On this page you learn what types of flooding are typical in Massachusetts and how do you protect yourself, your family and your home. You will also find out more about significant Massachusetts floods. Finally, you'll find links to NWS offices that provide forecast and safety information for Massachusetts, as well as links to our partners who play a significant role in keeping you safe.
The Great New England Hurricane of 1938 was one of the most destructive and powerful storms ever to strike Southern New England. This system developed in the far eastern Atlantic, near the Cape Verde Islands on September 4. It made a 12-day journey across the Atlantic and up the Eastern Seaboard before crashing ashore on September 21 as a Category 3 Hurricane at Suffolk County Long Island, then into Milford, CT. The center made landfall at the time of astronomical high tide, moving north at 60 mph. Unlike most storms, this hurricane did not weaken on its way toward Southern New England, due to its rapid forward speed and its track. This kept the center of the storm over the warm waters of the Gulf Stream.
Sustained hurricane force winds occurred throughout most of southern New England. The strongest winds ever recorded in the region occurred at the Blue Hill Observatory with sustained winds of 121 mph and a peak gust of 186 mph. Extensive damage occurred to roofs, trees and crops. Widespread power outages occurred, which in some areas lasted several weeks.
The hurricane produced destructive storm surge over south coastal Massachusetts and Cape Cod. Sections of Falmouth and New Bedford were submerged under as much as 8 feet of water.
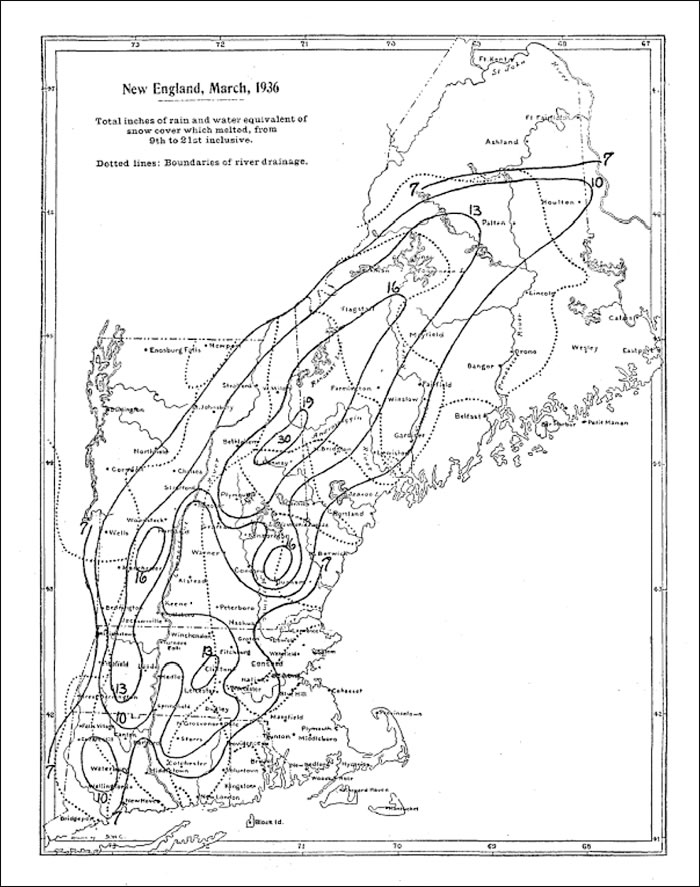
Rainfall from this hurricane resulted in severe river flooding, especially across portions of western Massachusetts, where 3 to 6 inches of rain fell. The rainfall from the hurricane added to the amounts that had occurred with a frontal system several days before the hurricane struck. The combined effects from the frontal system and the hurricane produced rainfall of 10 to 17 inches across most of the Connecticut River Valley. This resulted in some of the worst flooding ever recorded in this area. Along the Connecticut River in the vicinity of Springfield, the river rose to 6 to 10 feet above flood stage, causing extensive damage. While less rains fell across eastern Massachusetts, substantial freshwater flooding still occurred at some locations. This included the lower Merrimack River, which from Lowell to Haverhill achieved one of its top 3 flood crests on record.
Throughout southern New England, a total of 8,900 homes, cottages and buildings were destroyed, and over 15,000 were damaged by the hurricane. The marine community was devastated. Across all of southern New England, over 2,600 boats were destroyed, and over 3,300 damaged. The hurricane was responsible for 564 deaths and at least 1,700 injuries in Southern New England. Damage to the fishing fleets in Southern New England was catastrophic. A total of 2,605 vessels were destroyed, with 3,369 damaged.
This information was taken from "Southern New England Tropical Storms and Hurricanes, A Ninety-eight Year Summary 1909-1997", by David R. Vallee and Michael R. Dion, National Weather Service, Taunton, MA.
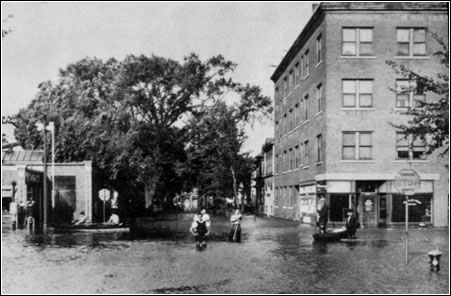
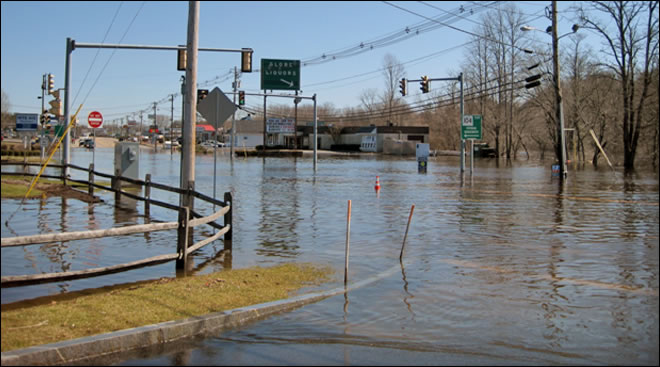
The Connecticut River produced major flooding in Springfield, MA. (NOAA)
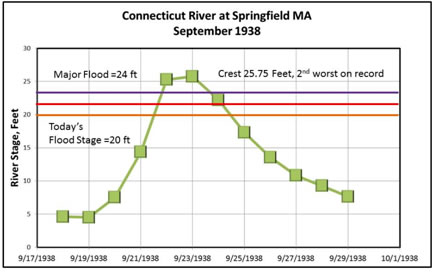
Response of the Connecticut River at Springfield, MA, to rains prior to and during the passage of the 1938 Hurricane
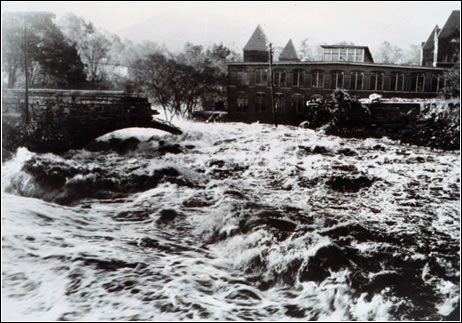
Rapid floodwaters from the Swift River in Ware, MA, destroy a stone bridge and flood buildings (NOAA)
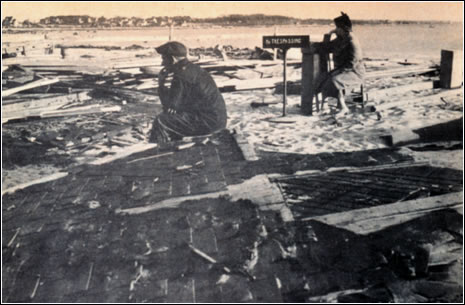
Contemplation of storm surge damage at Harbor View in Fairhaven, MA (NOAA)
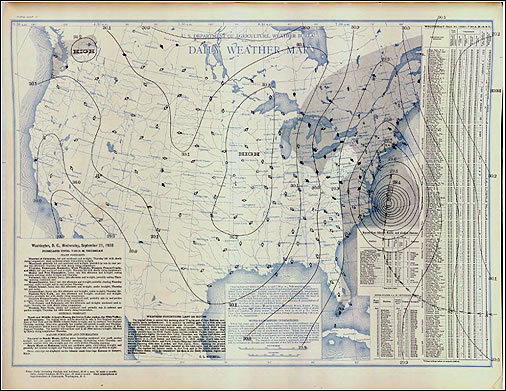
U.S. Department of Agriculture Daily Weather Map, September 21, 1938.
Learn More:
In little over a week, two named tropical systems passed by southern New England in August 1955, producing significant flooding over much of Massachusetts. Some locations had record floods that still stand in the history books today. Connie produced generally 4 to 6 inches of rainfall over
Massachusetts on August 11 and 12. The result of this was to saturate the ground and bring river and reservoir levels to above normal levels.
Diane came a week later and dealt a massive punch to Massachusetts. Rainfall totals from Diane ranged up to nearly 20 inches over a 2 day period. This exceeded records for New England.
With the strong intensity rainfall on saturated soil, the rise of the rivers was rapid. Even rivers along the coastal region of eastern Massachusetts, including the Charles, Taunton, and Neponset, experienced dramatic and rapid rises. On the Blackstone and Thames River headwaters south of Worcester, many dam breaks occurred, producing significant flooding and destruction downstream. In the Connecticut River Valley, the most significant floods were experienced on the Chicopee and Westfield Rivers; however, since the heaviest rains did not reach into northern New England, the mainstem Connecticut River did not flood to the degree seen on the Chicopee and Westfield Rivers.
Excerpts of this summary were taken from “The Floods of Connie and Diane” from the NWS Northeast River Forecast Center, available at
Learn More:
The widespread flooding that occurred in central and eastern Massachusetts during mid to late March 2010 was caused by a series of moderate to heavy rainfall events over a 5-week period which started in late February. The successive and unrelenting nature of these moderate to heavy rainfall events saturated soils and limited opportunities for rivers and streams to recede, making the state vulnerable to flooding.
The first major flood event in March occurred during the 13th to the 15th. Low pressure systems over the Gulf Coast and Midwest combined to form a potent, slow moving low pressure system that slowly tracked from Virginia to south of Long Island. A deep plume of tropical moisture fed into the system. Heavy rains affected a large portion of the Northeast but the heaviest precipitation fell over eastern portions of southern New England.
With the mid-March event, a swath of 7 to 10 inch rains fell across east coastal Massachusetts from Methuen and Gloucester southward through Plymouth and Brockton. Totals of 4 to 6 inches fell just to the west, generally in the vicinity of the I-495 corridor and west into the Worcester Hills. Notably lower totals occurred over the Connecticut River Valley area of Massachusetts, where totals ranged from 2 to 3 inches. Flood impacts were minimal in this area.
Widespread flooding occurred along the eastern half of Massachusetts in mid-March. An exceptional number of homes, businesses and streets were impacted. Several gages indicated floods of record. These sites included the Concord River at Lowell, the Taunton River at Bridgewater, the Shawsheen River at Wilmington, and the Charles River at Waltham.
In Middleton, a man drowned in a flooded basement office. This is the only known fatality in Massachusetts from these floods.
The Nashua River experienced its worst flood in 23 years, resulting in substantial flooding in locations such as Lancaster and Clinton. On the MBTA Green Line D branch, undermining occurred along a 50 foot long stretch of train track, resulting in a closure of that route. In Topsfield, the Ipswich River flooded Route 1. At Waltham’s Moody Street Dam, water overtopped an upstream training wall that keeps water going over the spillway. Significant erosion occurred at the site but the main portion of the dam remained stable until repairs could be made. Flooding was common in Boston, particularly in the southern half of the city.
Another significant rain event occurred March 22 to 23. This 1 to 3 inch rainfall event served to cause pockets of minor flooding, keeping soils saturated, and keeping river and stream levels quite elevated.
The final big rain event in March 2010 occurred on the 29th to 31st of the month. On the 28th, a low pressure system emerged out of the Gulf Coast. This system tracked into the Northeast on the 29th, and lingered south of Long Island on the 30th and 31st. A deep plume of tropical moisture fed into this system throughout the period. A coastal front provided a focus for significant rainfall.
Heavy rains fell from the mid-Atlantic region to Maine, but once again the axis of heaviest rain fell over southern New England. Rainfall totals ranged from 3 to 6 inches across central through northeastern Massachusetts. Higher totals of 5 to 8 inches were noted in southeast Massachusetts.
Impacts were severe. This final rain event produced widespread flooding along numerous rivers and streams in eastern Massachusetts. Basement flooding was rampant. The Taunton River at Bridgewater, which had broken its record flood crest only 2 weeks prior, set a new record flood crest with the late March event. A sampling of other river gages where record flood crests occurred include the Sudbury River at Saxonville (Framingham), Charles River at Medway, and Wading River at Norton. The Sudbury River at Saxonville was in flood nearly continuously for over 3 weeks.
An unusual aspect of the late March floods was the lake flooding that occurred in southeast Massachusetts. Some of this lake flooding extended well into April 2010. Locations affected by lake flooding included Norton Reservoir and Lake Winnecunnet in Norton; West Pond, Big Sandy Pond and Kings Pond in Plymouth; Assawompset Pond in Lakeville; Long Pond in Freetown and Lakeville; Forge Pond in Freetown; and South Wattupa Pond in Westport.
In total, 8 of the 30 long term United States Geological Survey network gages in Massachusetts broke previous record crests during the period of March to early April 2010.
Monthly rainfall records also were exceeded for March. In Boston, 14.87 inches of liquid equivalent precipitation fell, setting a new March record for the city. The previous Boston record was 11 inches in March 1953. It was also the second all-time wettest month on record, not quite reaching the 17.09 inches of rain produced largely by Connie and Diane in August 1955. At the Blue Hill Observatory, 18.81 inches of rain fell, setting the all-time wettest March and monthly rainfall record for that location. The previous record was 18.78 inches from August of 1955.
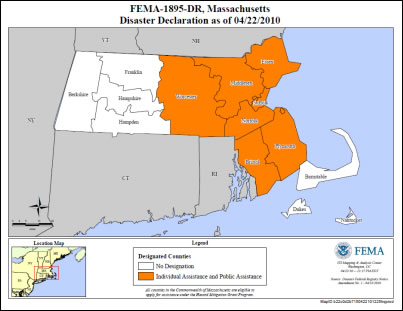
FEMA map indicating Massachusetts counties included in a Disaster Declaration as a result of the March 2010 floods
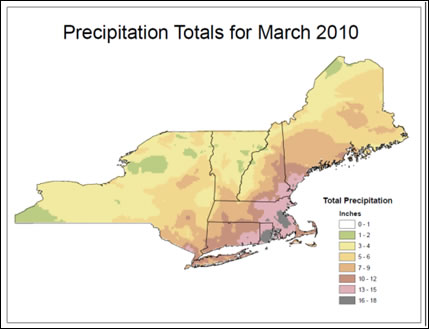
March 2010 rainfall totals for the northeast United States, NWS
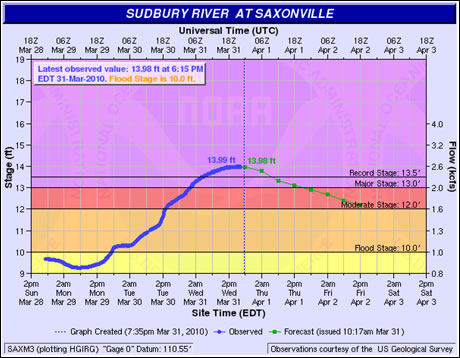
Flooding on the Sudbury River at Saxonville (Framingham) MA, NWS
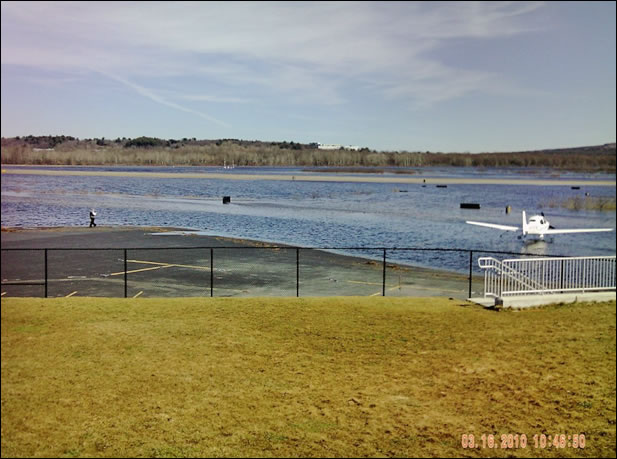
Photo of Norwood Airport Tarmac on March 16th, floodwaters were from the Neponset River: source, NWS
Floodwaters from the Taunton River flood the junction of Route 44 and Route 104 in Taunton near the Raynham town line. The record flooding on the Taunton River at Bridgewater resulted in the first flood related shutdown of Route 44 in Taunton in over 40 years: source, NWS.
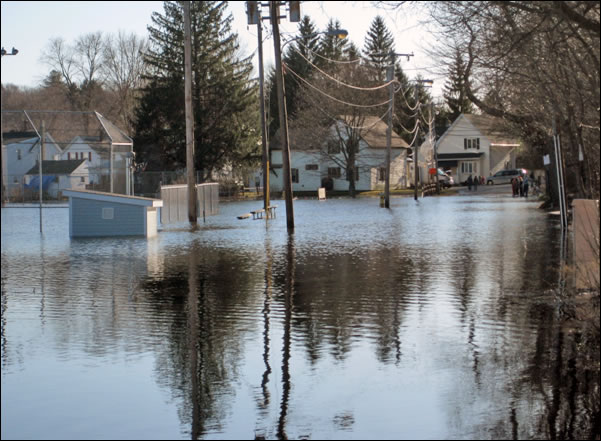
Onlookers in Clinton watch during the mid-March 2010 floods as the Nashua River continued to push floodwaters onto Vale Street, the adjacent baseball field, and extended up to a condominium complex and apartment building to the left of this photo: source, NWS.
While the Blizzard of ’78 (February 6-8) is known for the incapacitating snowfall, snow drifts and wind gusts it brought to Massachusetts, it is also known for the devastating coastal flooding that it brought to the Bay State.
An unusually strong high pressure was in place over central Canada, with frigidly cold air in place. The storm system at the surface and aloft moved out of the Great Lakes to the mid-Atlantic coast. The combination of cold Canadian air to the north, low pressure to the south, and relatively warm ocean air mixed together to form The Blizzard.
There were multiple ingredients that set the stage for historic coastal flooding with this storm. Astronomical high tides occurred during the timeframe of the blizzard and a new moon, with the moon in perigee, its closest position to the earth.
The storm center stalled just off the southern New England coast for 36 hours, and pumped continual onshore flow in the form of hurricane force wind gusts. This wind resulted in significant storm surge to coastal Massachusetts for four tide cycles over 2 days. The storm set a record high water mark of 15.25 feet above mean lower low water (recorded at the Boston Harbor National Ocean Service tide gauge) and brought waves greater than 30 feet just offshore. Major coastal flooding for Boston and the east facing coast of Massachusetts occurs when water levels reach 13.6 feet. This event equaled historic coastal flooding. Revere, Scituate and Hull experienced the most devastating effects of the storm. This storm resulted in a federal disaster declaration (FEMA DR-546).
Major coastal flooding severely damaged over 2,000 homes, displacing some of the 10,000 people who required shelter. Damage from the storm is estimated at more than $2.3 billion (in 1998 dollars). The storm resulted in 73 deaths in Massachusetts.
Information compiled from the following resources: “The Great Northeast Blizzard of 1978 Remembered 35 Years Later in Southern New England”, Neal Strauss and Eleanor Vallier-Talbot, NWS Taunton MA; Boston Sunday Globe “Blizzard of ‘78” 24-page special addition, originally for the blizzard of 1978; Boston Globe: Thursday, 9 February 1978 p.1; NOAA/NWS Boston/Taunton Blizzard of 1978 Fact Sheet; Massachusetts 2013 State Hazard Mitigation Plan;

The boat, Motif #1, in Rockport Harbor was brought down by storm surge. Photo is courtesy of the Massachusetts Office of Coastal Zone Management.
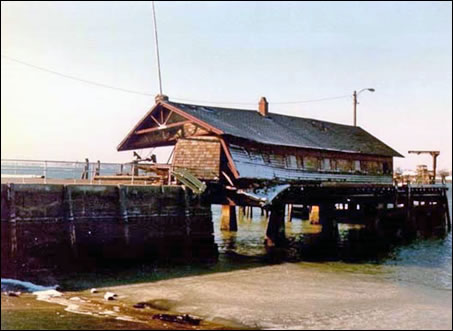
This building situated on a pier in Nahant collapsed due to exposure to the storm. (Photo courtesy of the Massachusetts Office of Coastal Zone Management)
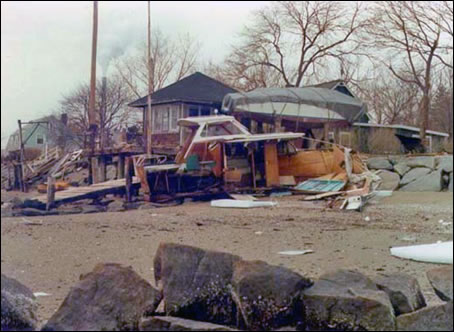
The flooding caused extensive damage to this Ipswich boatyard. Photo is courtesy of the Massachusetts Office of Coastal Zone Management.
Learn More:
|
||||||