
Nashua, New Hampshire
The winter of 1935-1936 was a severe one with lower than normal temperatures. As of early March it was estimated that the snowpacks in Northern New England averaged about 7.5 inches of water. In Southern New England, snow water equivalents of 3.5 inches were normal.
On March 9, a warm, moisture-laden front moved into, and stalled over New England resulting in increased temperatures as well as heavy rainfall during the period March 11-13. Rainfall amounts were significant enhanced by the orographics of the White Mountains. Large areas of 5 inch rainfall in New Hampshire and Maine were reported.
The combination of heavy rain and melting snow resulted in flooding throughout New England. A most significant damage during this period resulted from the movement of ice on the rivers, and the resultant ice jams and breaks. An example of the severe ice damage occurred at Holyoke Dam. An ice jam above the dam initally resulted in the Connecticut River cutting a new channel on the east side of the river to get around the jam. When the jam broke, it moved downstream, over the dam in over 9 feet of water. In doing so, the ice sheared off 1000 foot wide by 5 foot high section of the granite dam. The state of Maine also received a vast amount of damage from ice flows (see photo below). While the ice flood resulting from this first portion of the event was substantial, for the most part it was merely "priming the pump" for what was to come next.
The major impact occurred a few days later when a second system moved into New England dumping even more rainfall. The Pinkham Notch station on Mount Washington, which had received over 7 inches of rain during the March 11-13 rain, received over 10 inches on March 18 and 19. Other areas of heavy rainfall were focused on the Blackstone and Ware River basins, and on the east side of the Berkshires, draining into the Deerfield and Westfield Rivers.
Again, the combination of heavy rain and melting snow resulted in severe flooding. Almost the entire snow cover in New England, except that in Northern Maine and New Hampshire contributed major runoff to the rivers. This time the most significant damage was caused by the flooding itself. In fact, at many locations, this was the most severe flooding that has ever been experienced. In the table below, for locations marked with * the 1936 flood continues to be flood of record 60 years later. The entire reach of the Connecticut River was severely impacted. New flow records were established from Hartford all the way up to northern New Hampshire. The Merrimack River basin also saw substantial damage. In Hookset NH, over 18 feet of water flowed through the downtown. Inundation in Nashua, NH is depicted in the photograph above.
A third less severe system came up a few days later. However, this final event served only to lengthen the duration of the flooding rather than cause any new significant flood peaks. During the two week period, the majority of New England was impacted by a combination of rainfall and snowmelt totalling over 10 inches. In fact, a peak estimate of nearly 30 inches was observed. (See diagram).
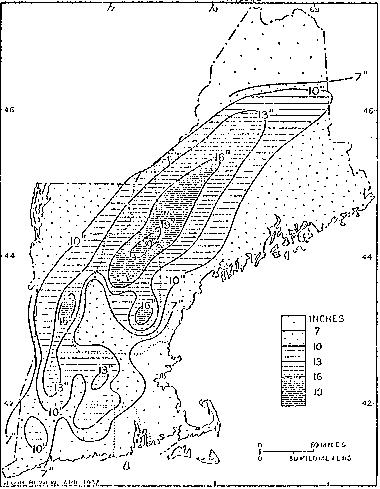
Rainfall and Water Equivalent of Snow Melted, March 9-21, 1936 (from Climatic Data, US Weather Bureau, New England Section, March 1936)
Between 150 and 200 lives were lost from the devastation of this event. In addition, property damage in New England was estimated to exceed $100,000,000. The storms in 1936 were not isolated to New England as flooding was reported as far south as the Potomac and James River basins in Virginia.
River Basin |
Location |
Peak Flow |
Peak Stage |
|---|---|---|---|
| Penobscot | Bangor | 130,000 cfs | |
| Penobscot | W Enfield | 125,000 cfs | |
| Kennebec | Waterville | 154,000 cfs/36 csm | |
| Androscoggin | Auburn | 135,000 cfs/41 csm | 27.6 ft * |
| Saco | Conway | 40,000 cfs/106 csm | |
| Merrimack | Lowell | 173,000 cfs/37 csm | 68.40 ft * |
| Pemigewasset | Franklin | 54,000 cfs/54 csm | |
| Pemigewasset | Plymouth | 65,400 cfs/105 csm | 29.0 ft * |
| Natchaug | Willimantic | 14,200 cfs/84 csm | |
| Quinnebaug | Quinnebaug | 90 csm | |
| Westfield | Westfield | 48,200 cfs/97 csm | |
| Connecticut | Dalton | 48,300 cfs/32 csm | 25.6 ft * |
| Connecticut | Montague | 236,000 cfs | 49.2 ft * |
| Connecticut | Thompsonville | 282,000 cfs | 16.6 ft * |
| Connecticut | Hartford | 313,000 cfs/29.8 csm | 37.6 ft * |
| Housatonic | Stevenson | 69,500 cfs |
Note: * represents flood of record
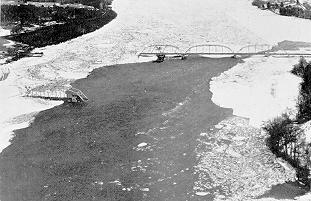
Ice Flows on the Kennebec River in Maine destroy highway bridge.
References:
Boston Society of Civil Engineers, 1941. Report of the Committee on Floods.
Brooks, Charles F. and Alfred H. Thiessen, 1939. The Meteorology of the Great Floods in the Eastern United States. Smithsonian Institution.
Grover, Nathan C., 1937. The Floods of 1936; Part 1: New England Rivers. Water Supply Paper 798. Geological Survey.
New Hampshire Flood Reconstruction Council, 1936. Report on the 1936 Flood.
Smith, David T. and David B. Reed, 1990. A Centennial Survey of American Floods. NOAA Technical Memorandum NWS SR-133.

