|
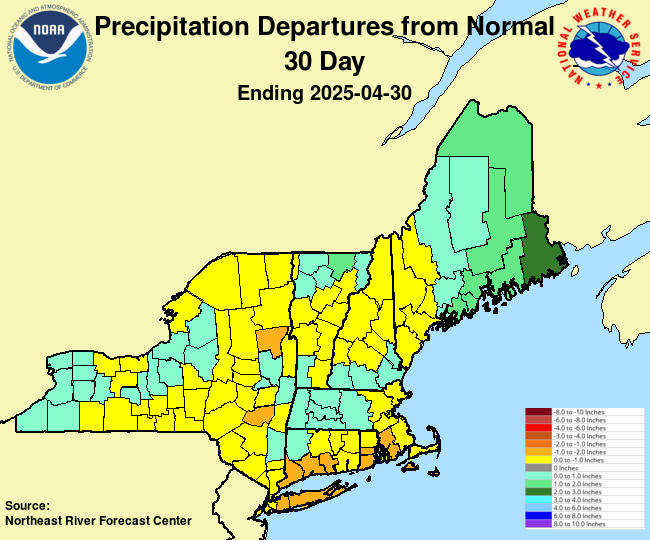
Latest 30 Day Precipitation Departures from Normal |
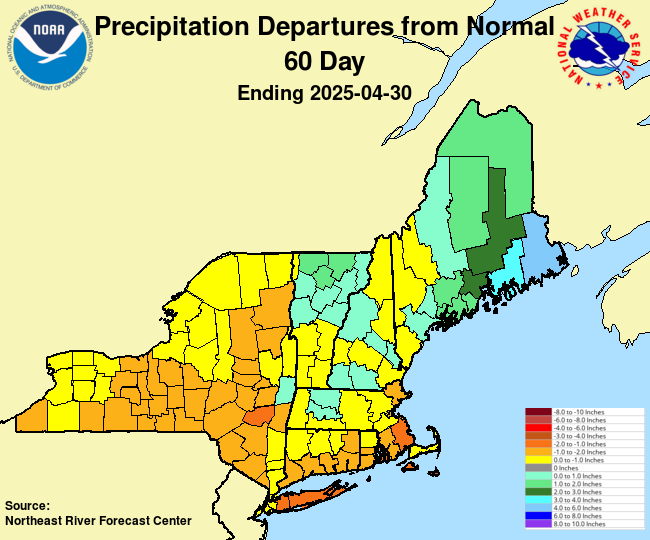
Latest 60 Day Precipitation Departures from Normal |
 |
 |
|
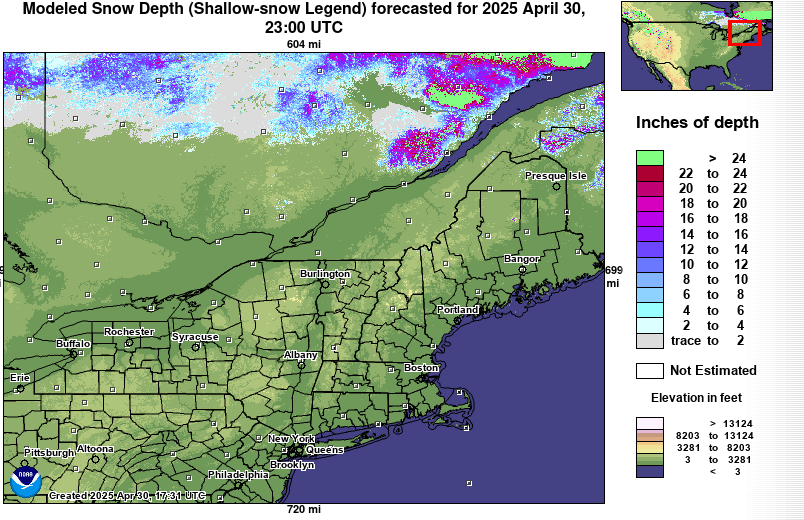
Current Modeled Snow Depth across New York and New England |
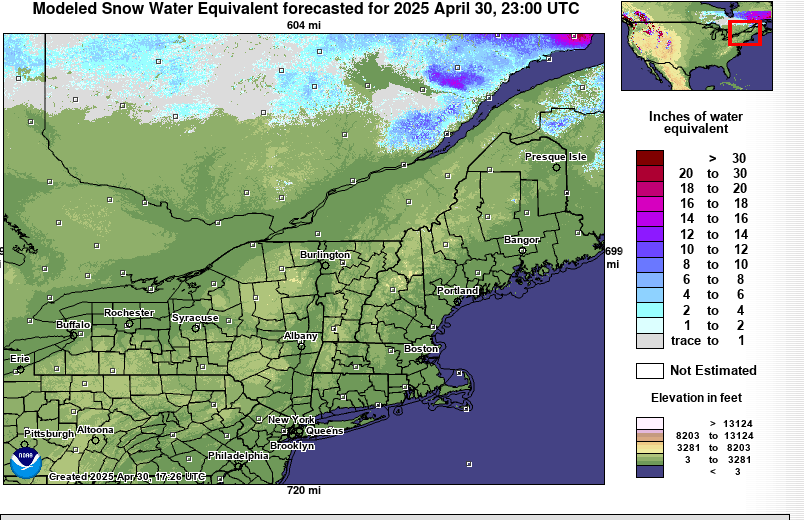
Current Modeled Snow Water Equivalent (SWE) across New York and New England |
 |
 |
|
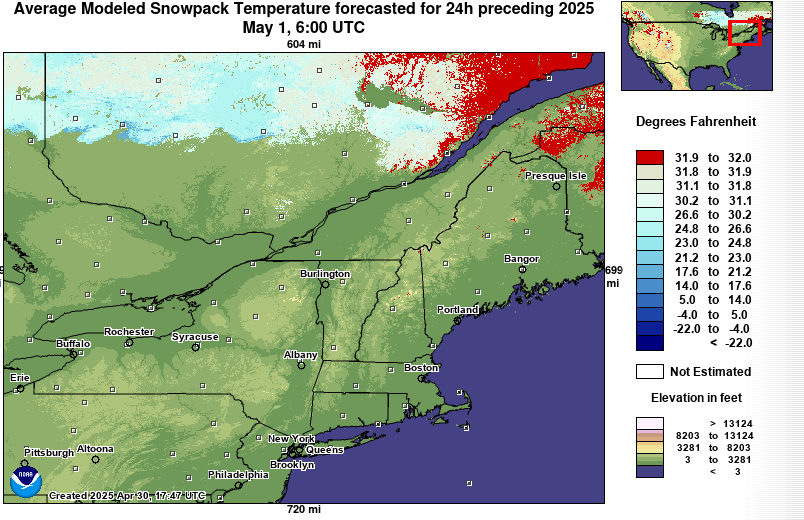
Current Modeled Snowpack Temperature across New York and New England |
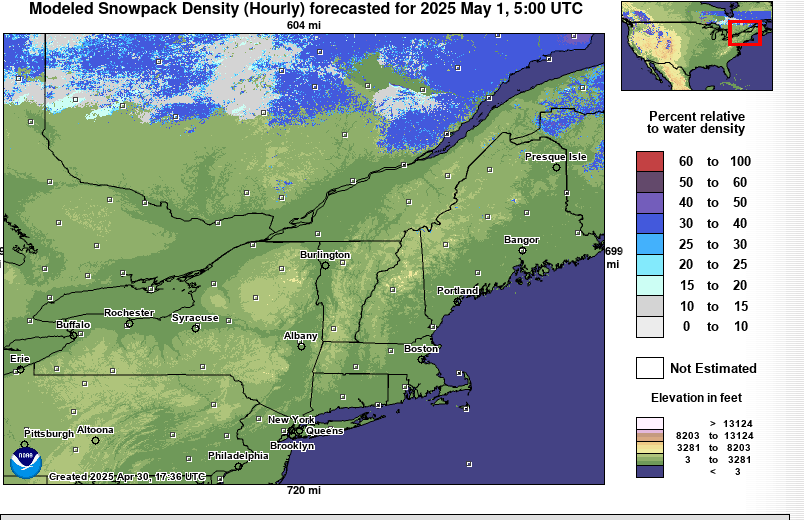
Current Modeled Snowpack Density across New York and New England |
 |
 |
|
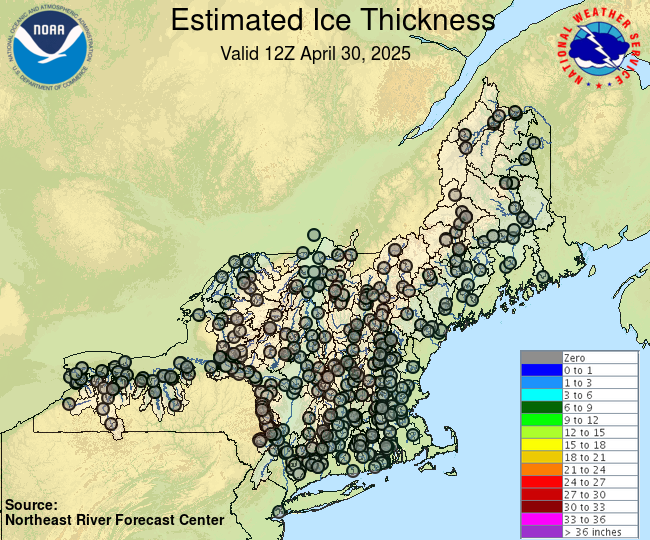
Current Estimated Ice Thickness across New York and New England |
 |
For more snow information please visit our webpage at: https://www.weather.gov/nerfc/snow
|
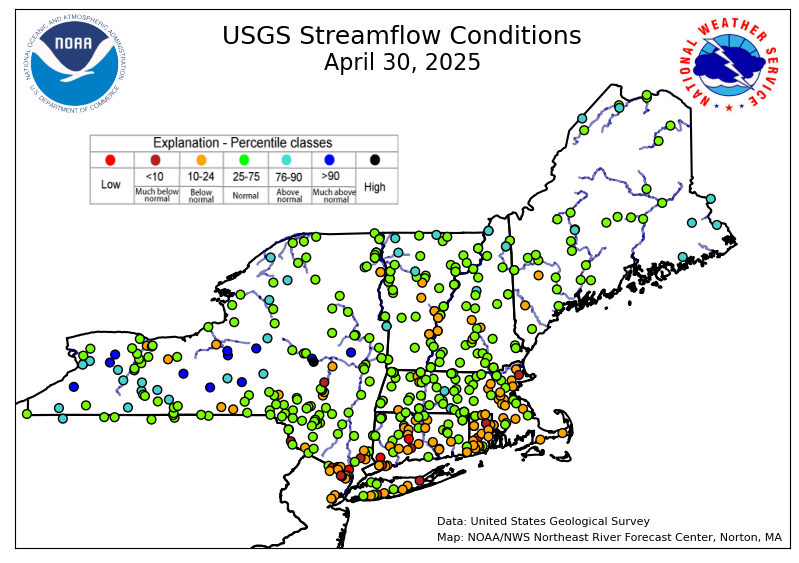
Current U.S. Geological Survey (USGS) Streamflows |
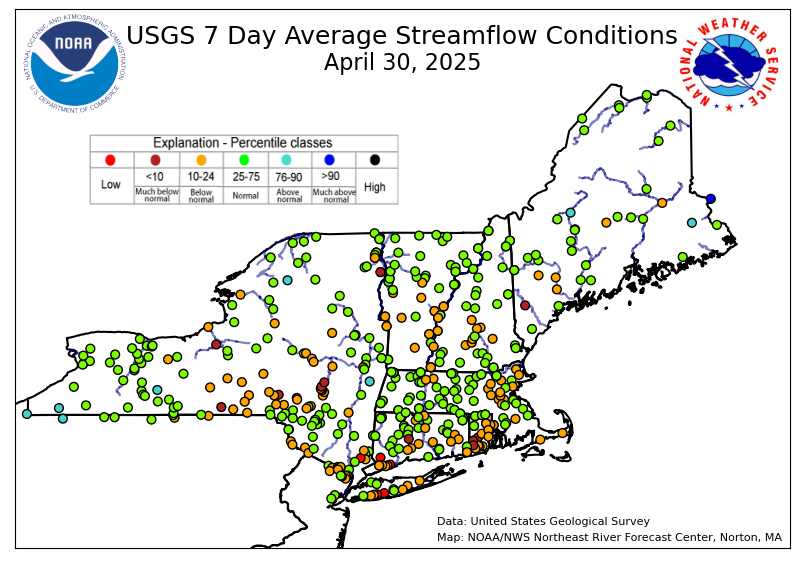
Current U.S. Geological Survey (USGS) 7 Day Average Streamflows |
 |
 |
| Long Term Palmer Drought Severity Index |
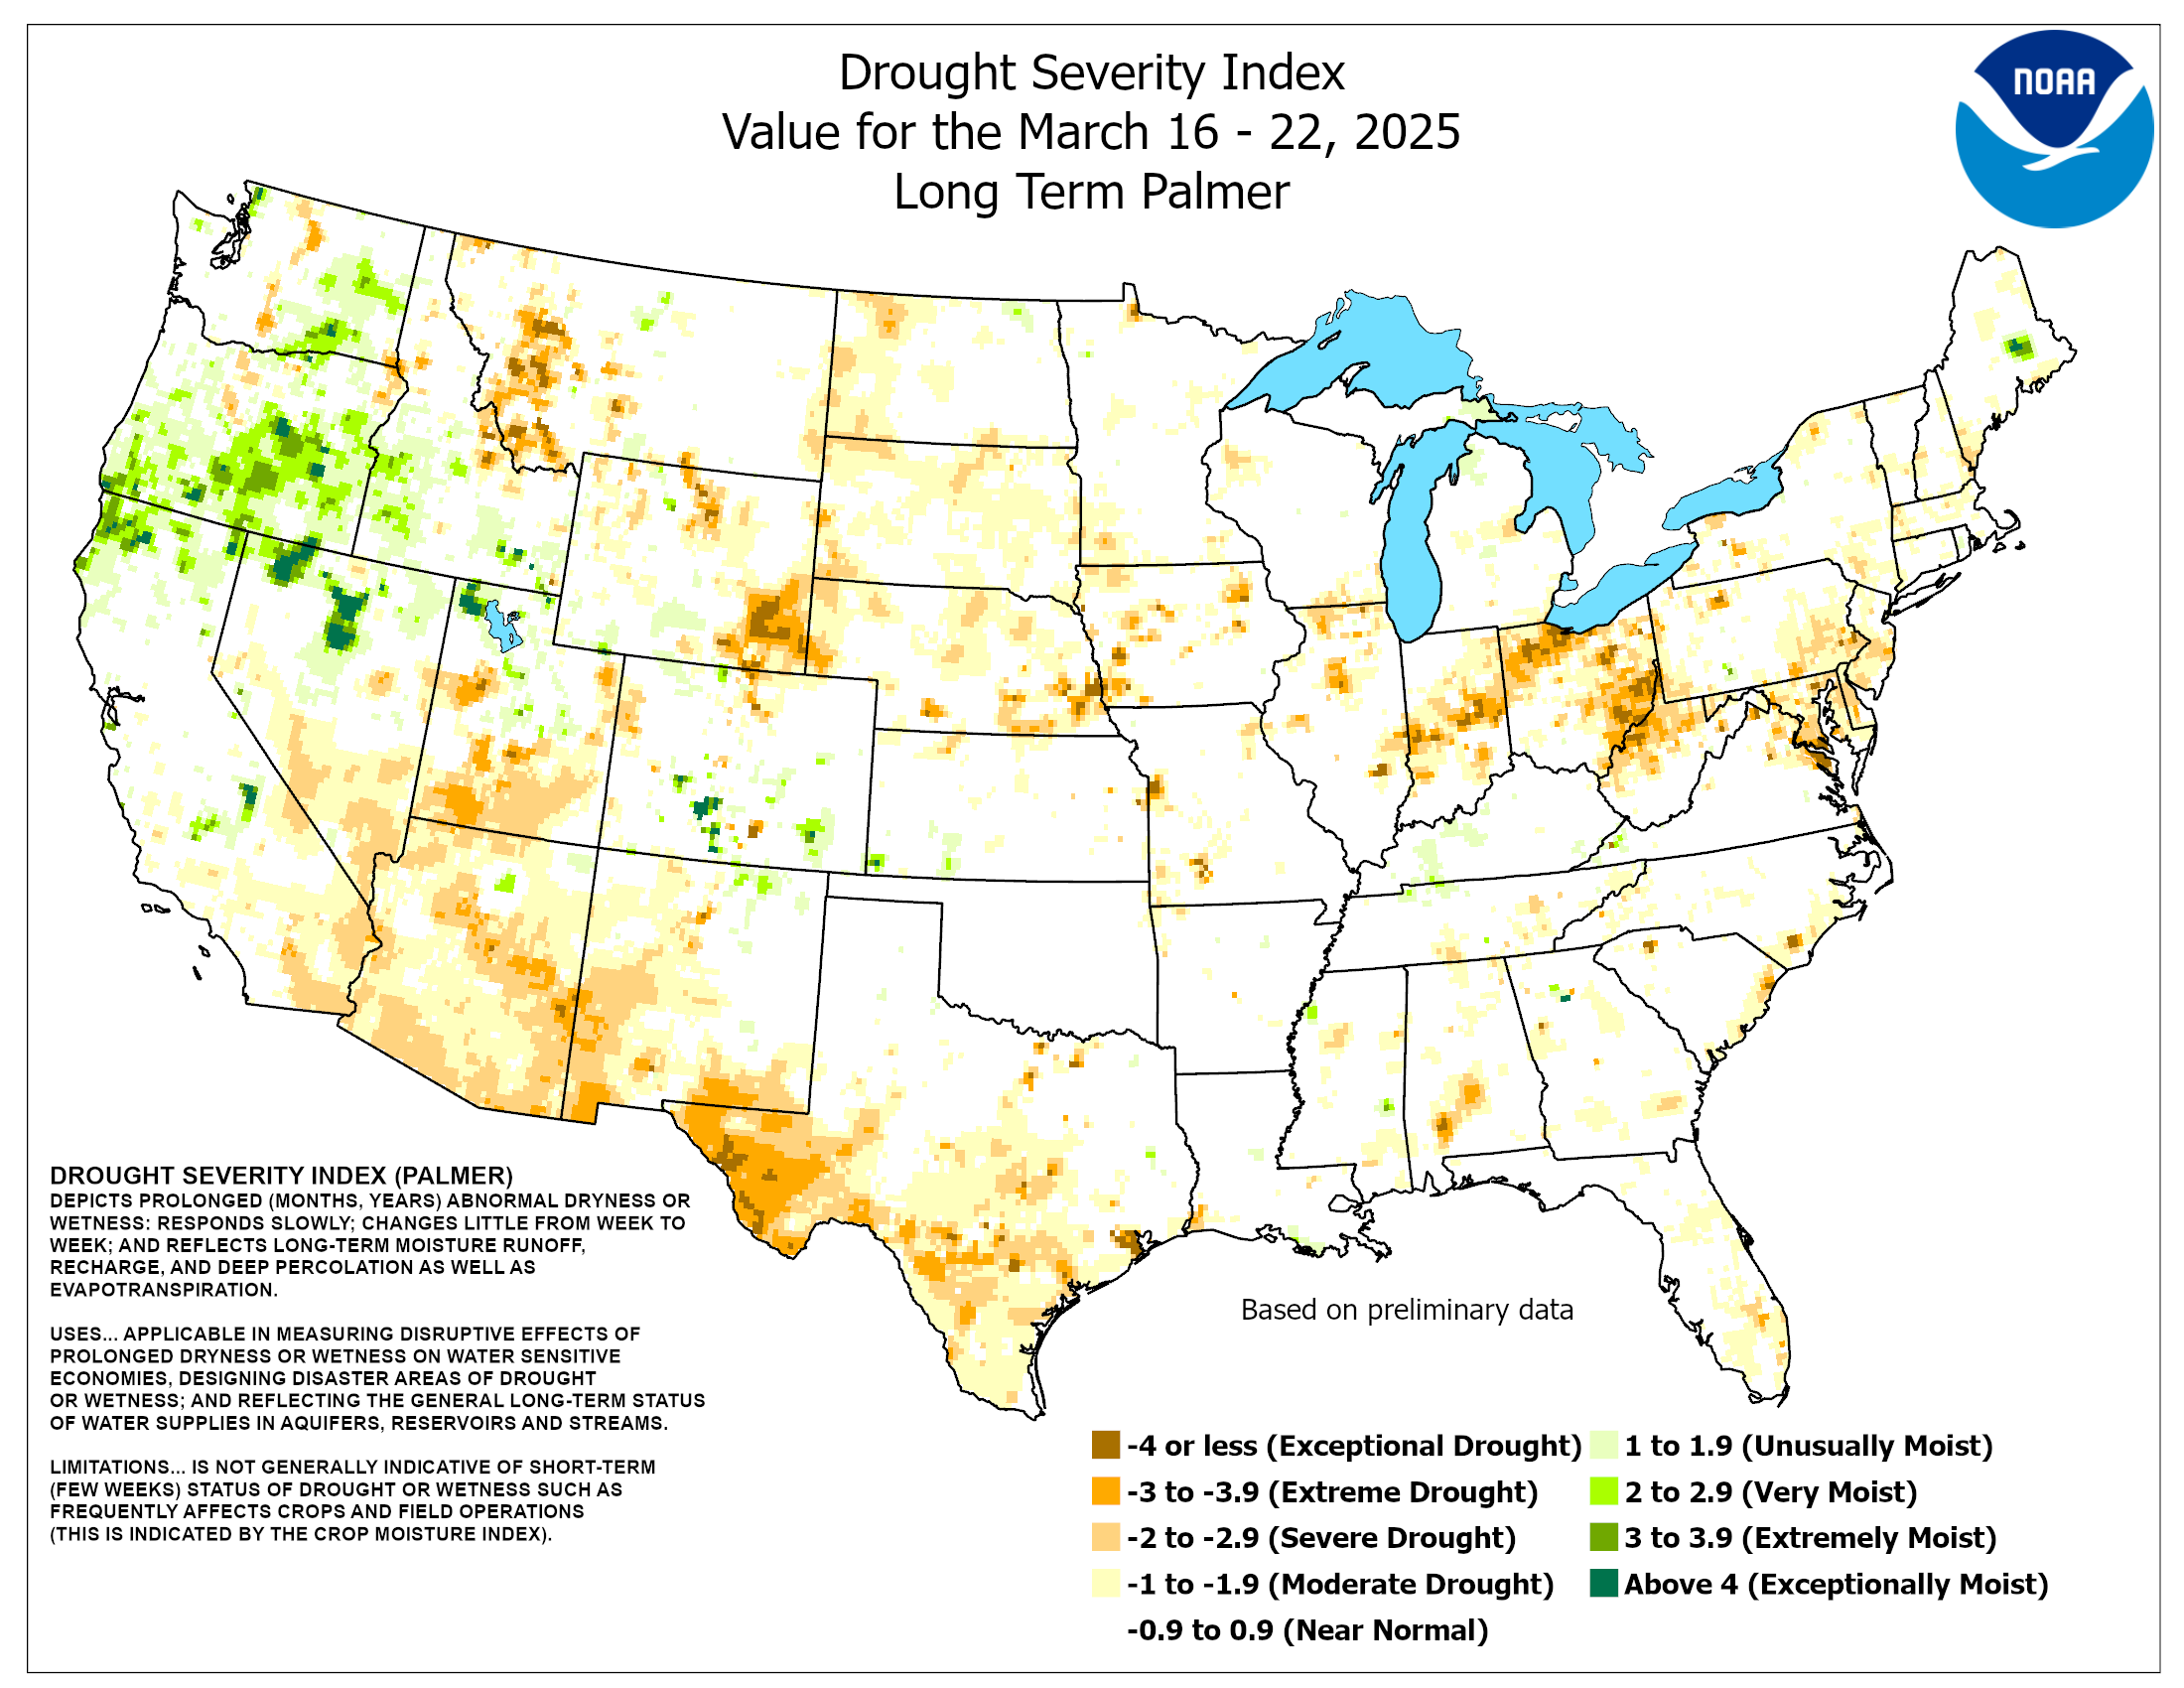 |
The long-term Palmer drought severity index is useful to estimate deep soil moisture conditions.
Additional soil moisture data is available from the Climate Prediction Center (CPC) at the following locations:
https://www.cpc.ncep.noaa.gov/products/Drought/Monitoring/smp.shtml
https://www.cpc.ncep.noaa.gov/products/Soilmst_Monitoring/US/Soilmst/Soilmst.shtml
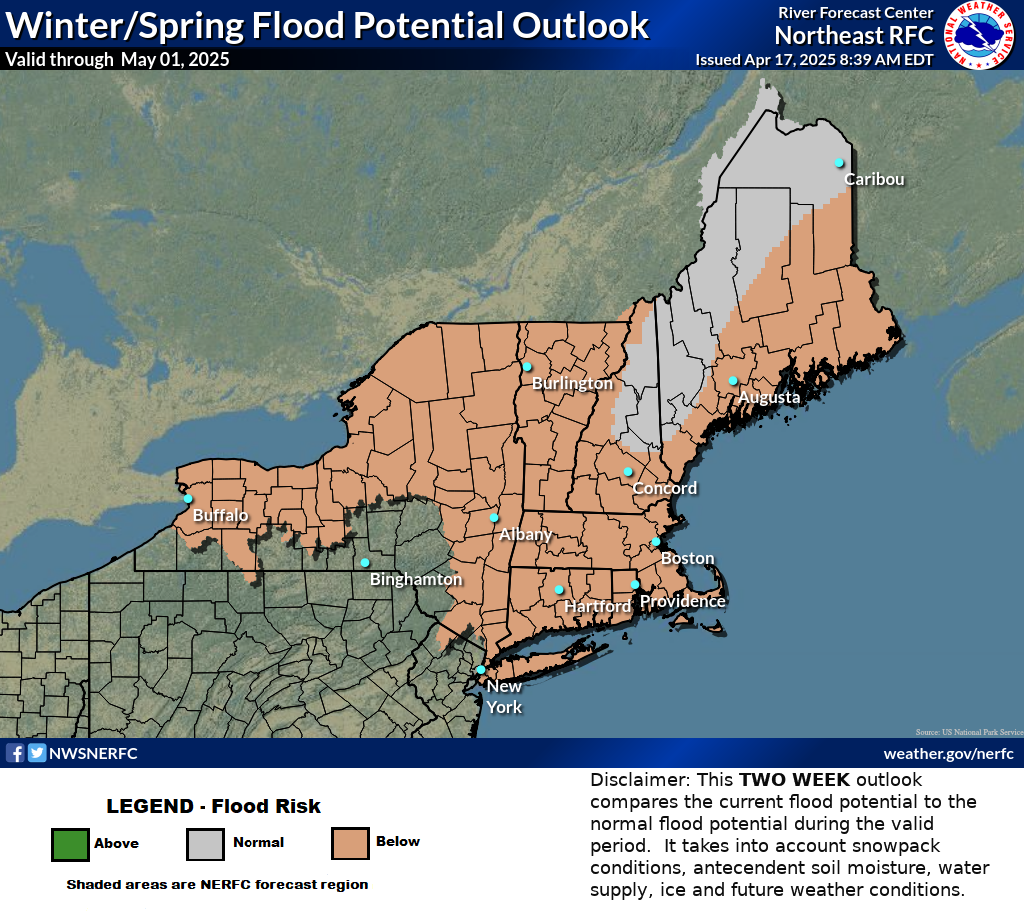
| Latest Winter/Spring Flood Potential Outlook |
 |
|
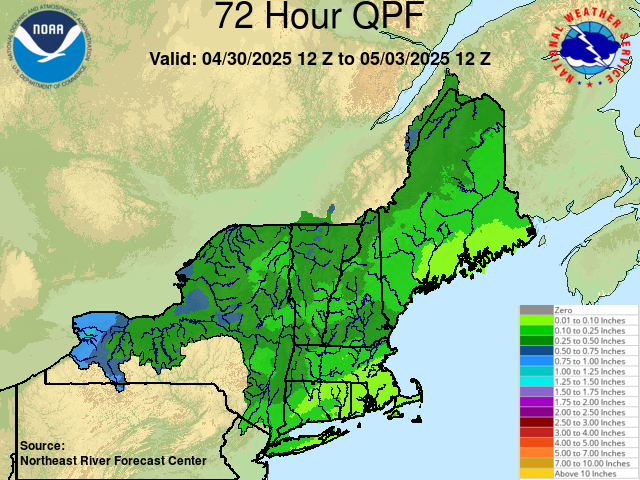
3 Day Precipitation Forecast |
3 Day Snowfall Forecast |
 |
|
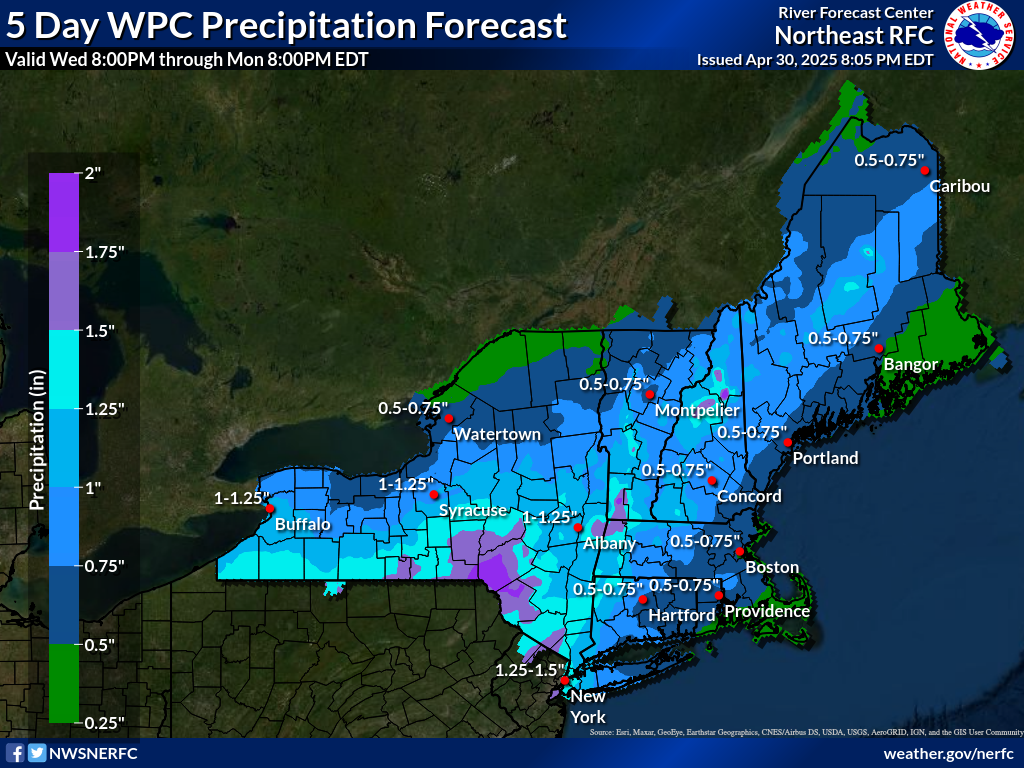
5 Day Precipitation Forecast |
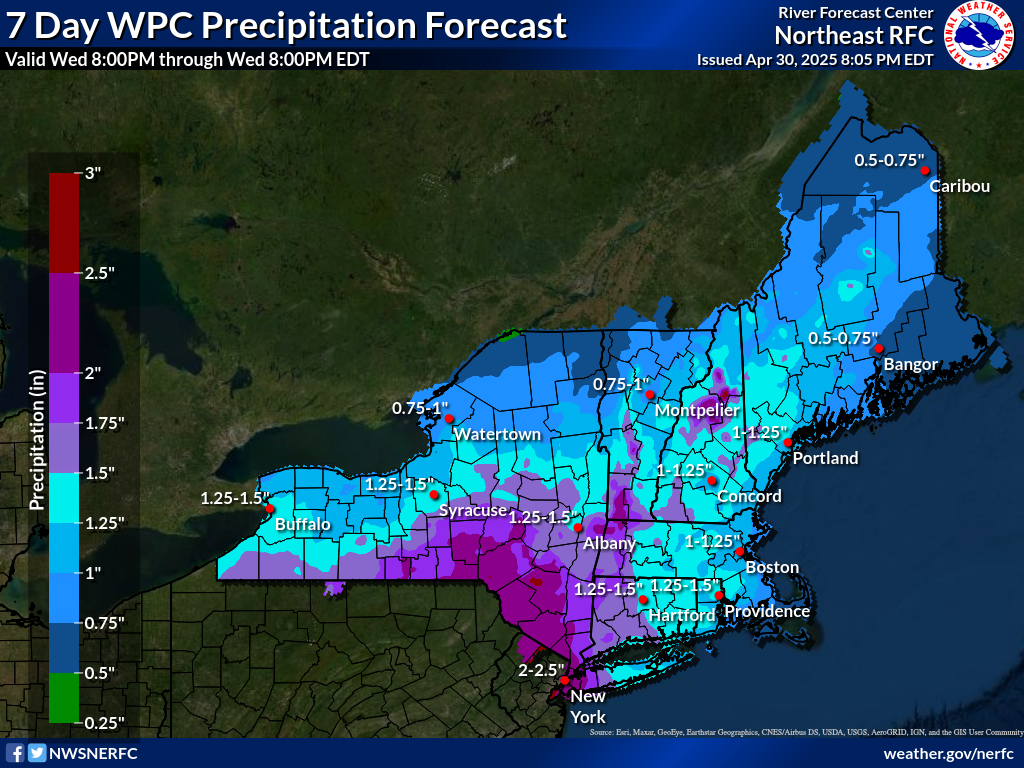
7 Day Precipitation Forecast |
 |
 |
|
6-10 Day Temperature Forecast |
6-10 Day Precipitation Forecast |
 |
 |
|
8-14 Day Temperature Forecast |
8-14 Day Precipitation Forecast |
 |
 |
|
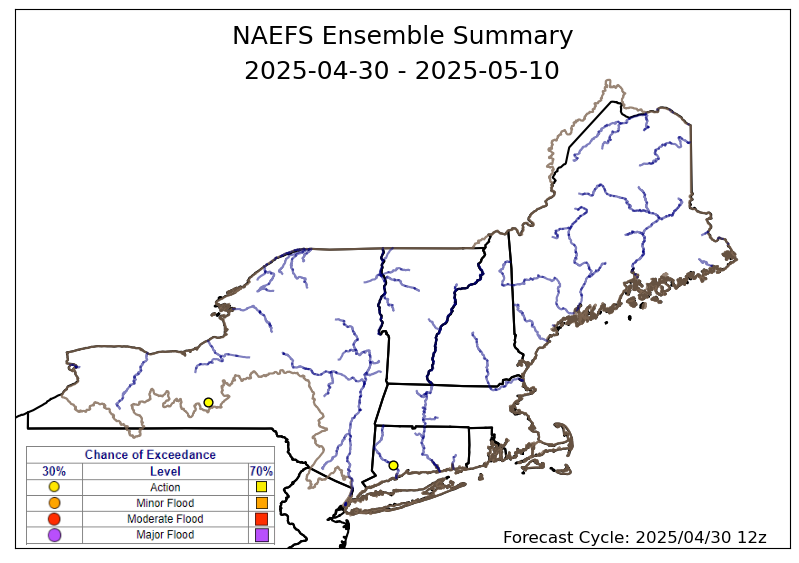
The North American Ensemble Forecast System (NAEFS) Summary |
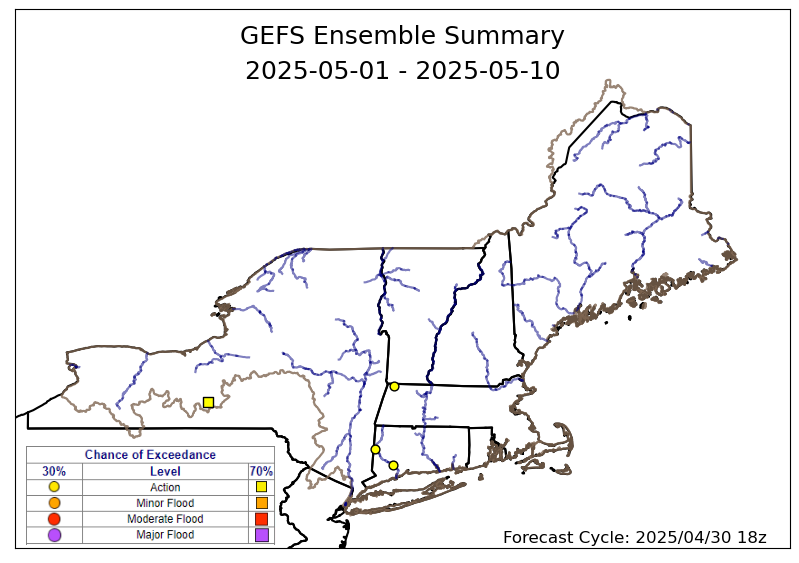
The Global Ensemble Forecast System (GEFS) Summary |
|
 |
 |

