Preliminary data on fatalities which occurred in the surf zones across National Weather Service areas of forecast responsibility through November 30, 2015. This data is preliminary and may not be completely accurate.
|
Rip Current |
High Surf |
Sneaker |
Other |
Unknown |
Location |
Gender |
Age |
Date |
|
X |
Guam |
M |
19 |
1/6 |
||||
|
X |
Guam |
M |
43 |
1/6 |
||||
|
X |
Guam |
M |
47 |
1/6 |
||||
|
X |
Point Reyes, CA |
M |
Unk |
1/20 |
||||
|
X |
Wakiki Kaimana Beach |
M |
36 |
1/23 |
||||
|
X |
Lighthouse Point CA |
M |
47 |
1/24 |
||||
|
X |
Isabela PR |
M |
35 |
2/6 |
||||
|
X |
Guam |
F |
74 |
3/4 |
||||
|
X |
Manati PR |
M |
28 |
3/9 |
||||
|
X |
Poipu Kaui |
M |
79 |
3/15 |
||||
|
X |
Guyanilla PR |
M |
65 |
3/23 |
||||
|
X |
San Juan PR |
M |
30 |
3/25 |
||||
|
X |
Arecibo PR |
M |
37 |
3/30 |
||||
|
X |
South Padre Island TX |
M |
18 |
3/30 |
||||
|
X |
Guadalupe Dunes Park CA |
M |
42 |
3/30 |
||||
|
X |
Ocean Ridge FL |
M |
18 |
4/2 |
||||
|
X |
Marbo Cave, Guam |
M |
20s |
4/6 |
||||
|
X |
Carolina PR |
F |
68 |
4/8 |
||||
|
X |
Carolina PR |
M |
23 |
4/8 |
||||
|
X |
Ocean Beach CA |
M |
14 |
4/9 |
||||
|
X |
Somoa Beach CA |
M |
21 |
4/10 |
||||
|
X |
Huntington Beach CA |
M |
19 |
4/14 |
||||
|
X |
Haena St Park Kaui |
F |
65 |
4/16 |
||||
|
X |
Cocoa Beach FL |
M |
51 |
4/19 |
||||
|
X |
Luquillo PR |
M |
20 |
4/25 |
||||
|
X |
Barrio Islote, Arecibo, PR |
F |
61 |
4/26 |
||||
|
X |
Isle of Palms, SC |
M |
22 |
5/7 |
||||
|
X |
Carolina PR |
F |
83 |
5/7 |
||||
|
X |
Fajardo PR |
M |
64 |
5/14 |
||||
|
X |
Luquillo PR |
M |
25 |
5/17 |
||||
|
X |
South Padre Island TX |
M |
40 |
5/25 |
||||
|
X |
Orange Beach AL |
M |
21 |
5/28 |
||||
|
X |
Navarre Beach FL |
M |
36 |
5/28 |
||||
|
X |
Moonlight Beach CA |
M |
17 |
5/29 |
||||
|
X |
Moonlight Beach CA |
M |
39 |
5/29 |
||||
|
X |
Carolina Beach, NC |
M |
24 |
5/31 |
||||
|
X |
Virginia Beach, VA |
M |
46 |
6/1 |
||||
|
X |
Juno Beach FL |
M |
27 |
6/1 |
||||
|
X |
Ocean City, MD |
M |
18 |
6/2 |
||||
|
X |
San Juan PR |
F |
18 |
6/10 |
||||
|
X |
Little Talbot Island SP FL |
M |
29 |
6/11 |
||||
|
X |
Ocean City, MD |
M |
17 |
6/13 |
||||
|
X |
Clearwater Beach FL |
M |
20 |
6/13 |
||||
|
X |
Whihala Beach, IN |
M |
18 |
6/16 |
||||
|
X |
Toa Baja PR |
M |
19 |
6/17 |
||||
|
X |
Santa Isabel PR |
M |
67 |
6/18 |
||||
|
X |
New Smyrna Beach FL |
M |
25 |
6/22 |
||||
|
X |
Lajas PR |
M |
25 |
6/25 |
||||
|
X |
Ocean City, NJ |
M |
14 |
6/29 |
||||
|
X |
Orange Beach AL |
M |
34 |
7/3 |
||||
|
X |
Bolstad Beach WA |
F |
11 |
7/3 |
||||
|
X |
Isabela PR |
M |
42 |
7/4 |
||||
|
X |
Ponce PR |
M |
15 |
7/4 |
||||
|
X |
Port Austin Harbor MI |
M |
25 |
7/5 |
||||
|
X |
Newport Beach CA |
M |
32 |
7/5 |
||||
|
X (Longshore current |
Shore Haven, NY |
F |
37 |
7/9 |
||||
|
X |
Island Park Beach NJ |
M |
25 |
7/18 |
||||
|
X |
Myrtle Beach SC |
M |
11 |
7/19 |
||||
|
X |
Santa Isabel PR |
M |
66 |
7/19 |
||||
|
X |
Cabo Rojo PR |
M |
55 |
7/19 |
||||
|
X |
Playalinda Beach FL |
M |
31 |
7/19 |
||||
|
X |
Melbourne Beach FL |
M |
37 |
7/20 |
||||
|
X |
Gulf Shores AL |
M |
16 |
7/20 |
||||
|
X |
Coney Island NY |
F |
10 |
7/22 |
||||
|
X |
Ocean Shores WA |
M |
18 |
7/26 |
||||
|
X |
Atlantic City NJ |
F |
59 |
8/4 |
||||
|
X |
St Johns County FL |
M |
20 |
8/5 |
||||
|
X |
Beavertown SP, RI |
M |
58 |
8/6 |
||||
|
X |
Vieques PR |
M |
68 |
8/11 |
||||
|
X |
8 Mile Creek, NY |
M |
42 |
8/16 |
||||
|
X |
Ocean City MD |
M |
18 |
8/26 |
||||
|
X |
Sandy Hook NJ |
M |
17 |
8/26 |
||||
|
X |
Vieques PR |
M |
47 |
9/1 |
||||
|
X |
Navarre Beach FL |
M |
65 |
9/1 |
||||
|
X |
Pensacola Beach FL |
M |
23 |
9/1 |
||||
|
X |
Watsonville CA |
F |
late 30s |
9/1 |
||||
|
X |
Sunset State Beach CA |
F |
37 |
9/1 |
||||
|
X |
Redondo Beach CA |
M |
21 |
9/6 |
||||
|
X |
Whiting Power Plant MI |
M |
34 |
9/7 |
||||
|
X |
Ocean City MD |
M |
52 |
9/17 |
||||
|
X |
Ocean City MD |
M |
49 |
9/17 |
||||
|
X |
Ocean Beach CA |
M |
24 |
9/24 |
||||
|
X |
Ocean Beach CA |
M |
47 |
9/24 |
||||
|
X |
N. Marianas |
M |
26 |
9/26 |
||||
|
X |
Treasure Island FL |
M |
55 |
10/4 |
||||
|
X |
Rincon PR |
M |
62 |
10/5 |
||||
|
X |
Culebra PR |
M |
27 |
10/7 |
||||
|
X |
St Johns County FL |
M |
63 |
10/12 |
||||
|
X |
Gray Whale Cove CA |
F |
68 |
10/12 |
||||
|
X |
Asilomar CA |
M |
18 |
10/25 |
||||
|
X |
San Juan PR |
M |
53 |
10/26 |
||||
|
X |
San Juan Condado Beach |
M |
51 |
11/5 |
||||
|
X |
Culebra PR |
M |
26 |
11/7 |
||||
|
X |
Garrapata St Beach CA |
M |
24 |
11/11 |
||||
|
X |
Arecibo PR |
M |
24 |
11/15 |
||||
|
X |
Juana Diaz PR |
M |
21 |
11/18 |
||||
|
X |
Aguadilla PR |
M |
43 |
11/22 |
||||
|
X |
Isabela PR |
M |
49 |
11/28 |
||||
|
X |
Ypao Beach Tuman |
F |
8 |
11/30 |
||||
|
X |
Marianas |
M |
23 |
12/1 |
||||
|
X |
Marianas |
M |
38 |
12/4 |
||||
|
X |
Picara Point St Thomas |
M |
27 |
12/14 |
||||
|
X |
Annaly Bay St Croix |
M |
18 |
12/14 |
||||
|
X |
Anini Beach HI |
M |
69 |
12/17 |
||||
| 82 | 8 | 3 | 6 | 5 | Total: 104 |
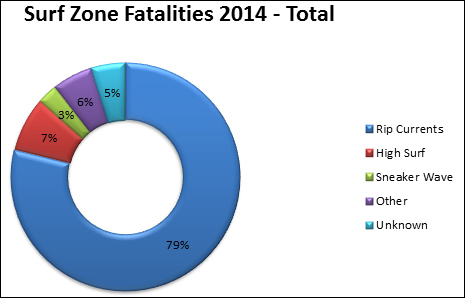
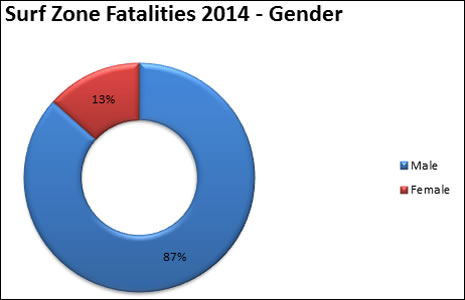
The graphs below show surf zone fatalities documented by NWS Marine and Coastal Services. Accurately tracking these types of fatalities is difficult because so many go unreported and undocumented. Due to the difficult nature of tracking surf zone fatalities; these data may not match other sources.
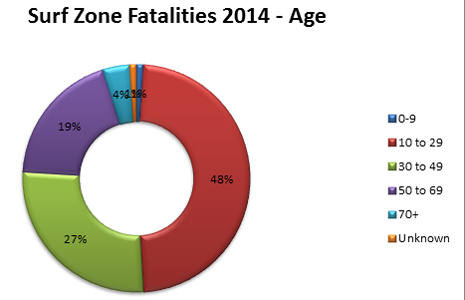
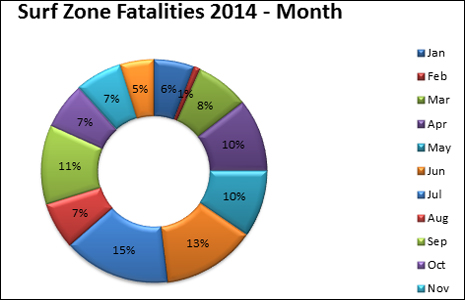
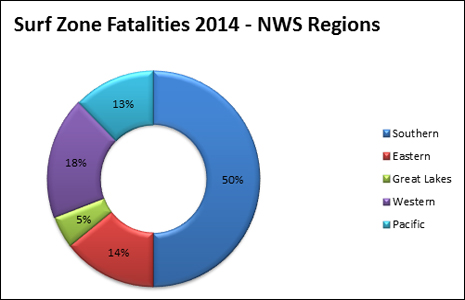
Occasionally, there are surf zone fatalities caused by other hazards such as unusual waves and currents. These hazards fall in the “Other” category. “Other” is not an official category defined by the NWS. Rip Currents cause a large of percentage of the surf zone fatalities in the United States. Typically, a victim of a surf zone hazard is a male between the ages of 10-29. Most of the fatalities occur during the months of June and July and in the NWS Southern Region.
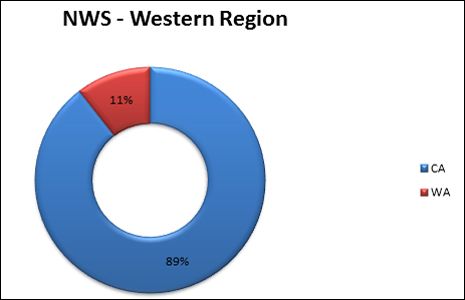
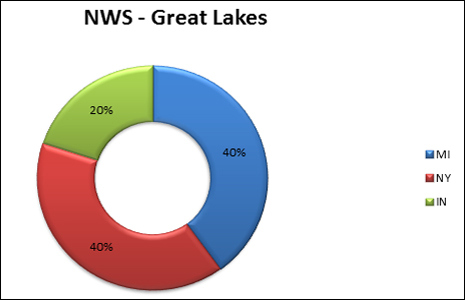
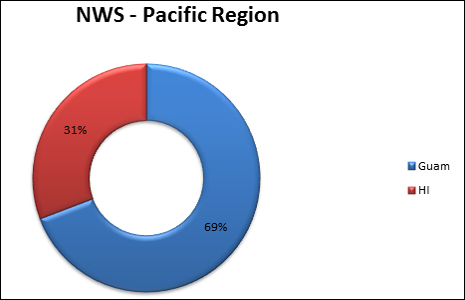
The NWS divides its areas of forecast responsibility into regions shown on the image below. It is rare to have a surf zone fatality in the NWS Alaska Region. The Great Lakes are covered by the NWS offices in the Central and Eastern Region and for the display of these data, all surf zone fatalities in the Great Lakes are categorized into a "Great Lakes Region."
 |
 |
 |
 |
 |
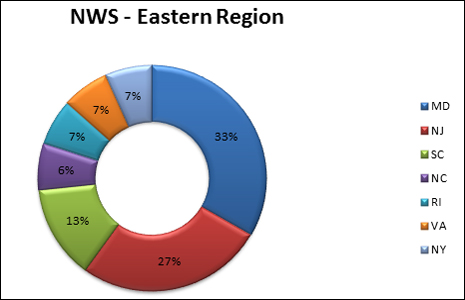
No fatalities in ME, NH, MA, CT, DE |
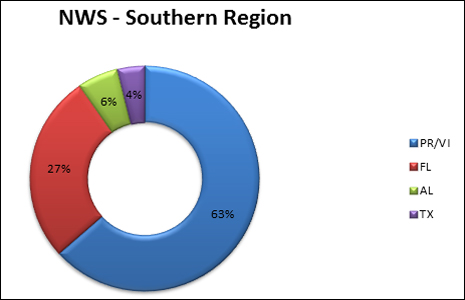
No fatalities in GA, MS, or LA |
No Fatalities in OH, WI, MN, PA |
|
|
 |
 |
|
NWS started tracking these statistics in 2013. We do not have breakdowns before 2013.