
Widespread life-threatening flash and urban flooding continues in south-central Texas, with considerable flooding impacts possible across central Texas. Wildfire smoke is impacting air quality across much of the Great Lakes region into southern New England and the Mid-Atlantic. Monsoonal thunderstorms may produce isolated to scattered flash flooding across the Southwest into the Great Basin. Read More >
Weather and Climate Summary for June 2016
Temperatures averaged below normal for the month. Table 1 summarizes June 2016 temperature, precipitation, and departure from normal for Abilene and San Angelo.
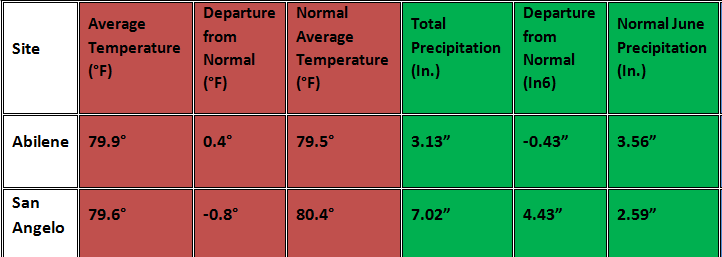
Table 1: June Climate Data for Abilene and San Angelo.
* This was the wettest June on record for San Angelo. *
Additional temperature and precipitation data for Abilene and San Angelo is summarized in Table 2.
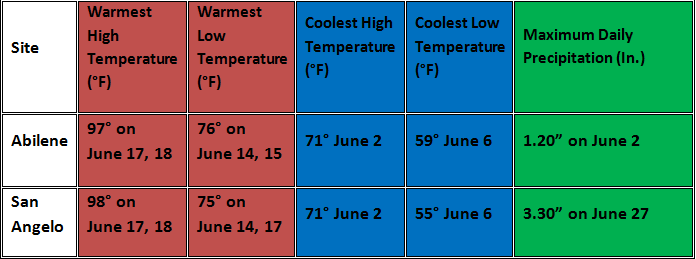
Table 2: Additional June Climate Data for Abilene and San Angelo.
The maximum daily precipitation for San Angelo (3.30 inches) occurred on June 27. This set a new record for daily maximum precipitation for that date. Record daily rainfall was also set on June 1 (1.39 inches). At Abilene, the maximum daily precipitation (1.20 inches) occurred on June 2. The monthly precipitation for June (Figure 1) and percent of normal precipitation for the month (Figure 2) are shown below.
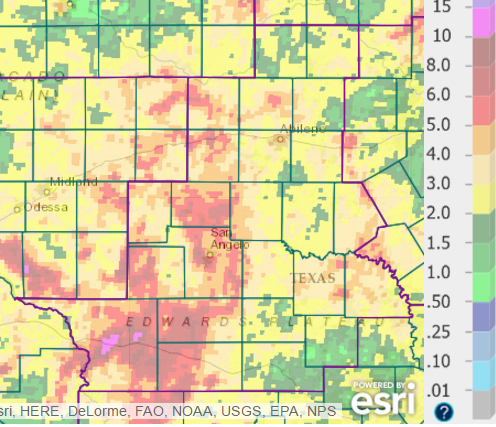
Figure 1: Total Precipitation for June.
Precipitation for June ranged fromless than one inch at isolated locations in the Northwest Hill Country, to more than 10 inches in parts of Crockett County. For a number of locations across mainly the western half of west-central Texas, June rainfall was in the range of 5-10 inches.
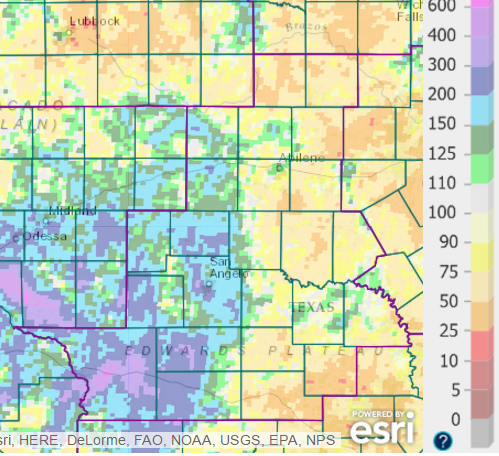
Figure 2: Percentage of Normal Precipitation for June.
The monthly precipitation was well-above normal across much of the western half of west-central Texas, and below normal across most of the eastern half of the area. At scattered locations, the June rainfall was less than 50 percent of normal.
The weather pattern continued to be active in June, with heavy rain events and flash flooding affecting the Abilene and San Angelo areas.

