
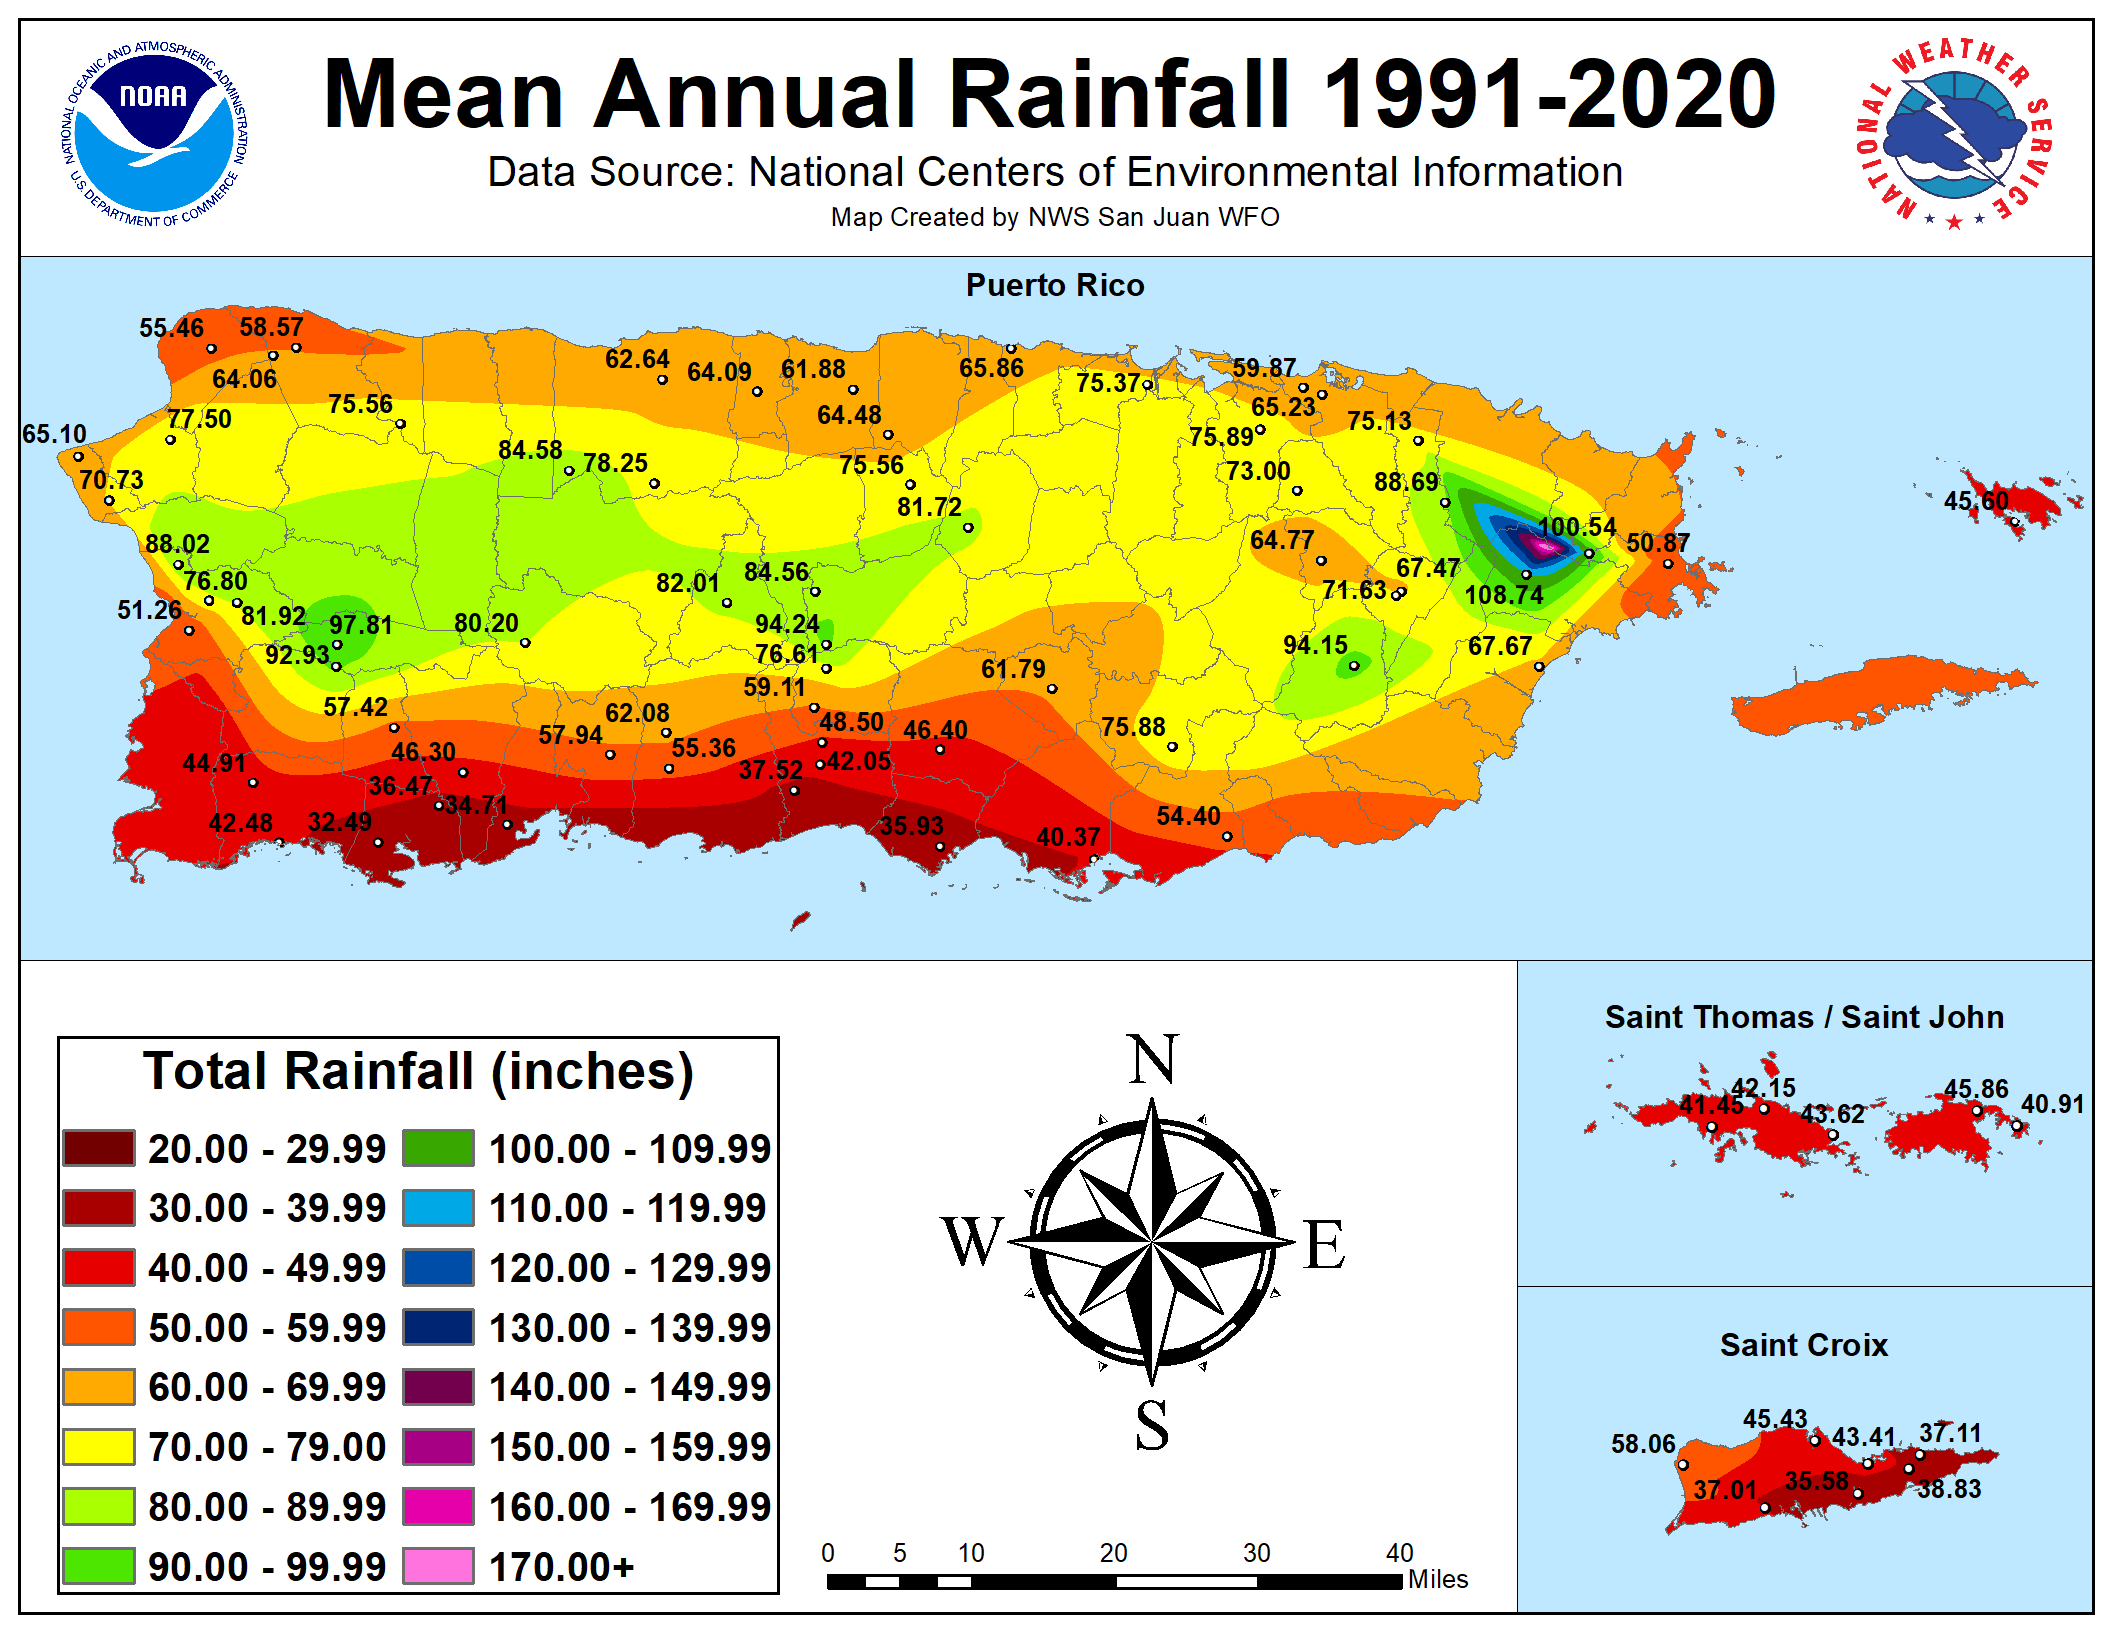
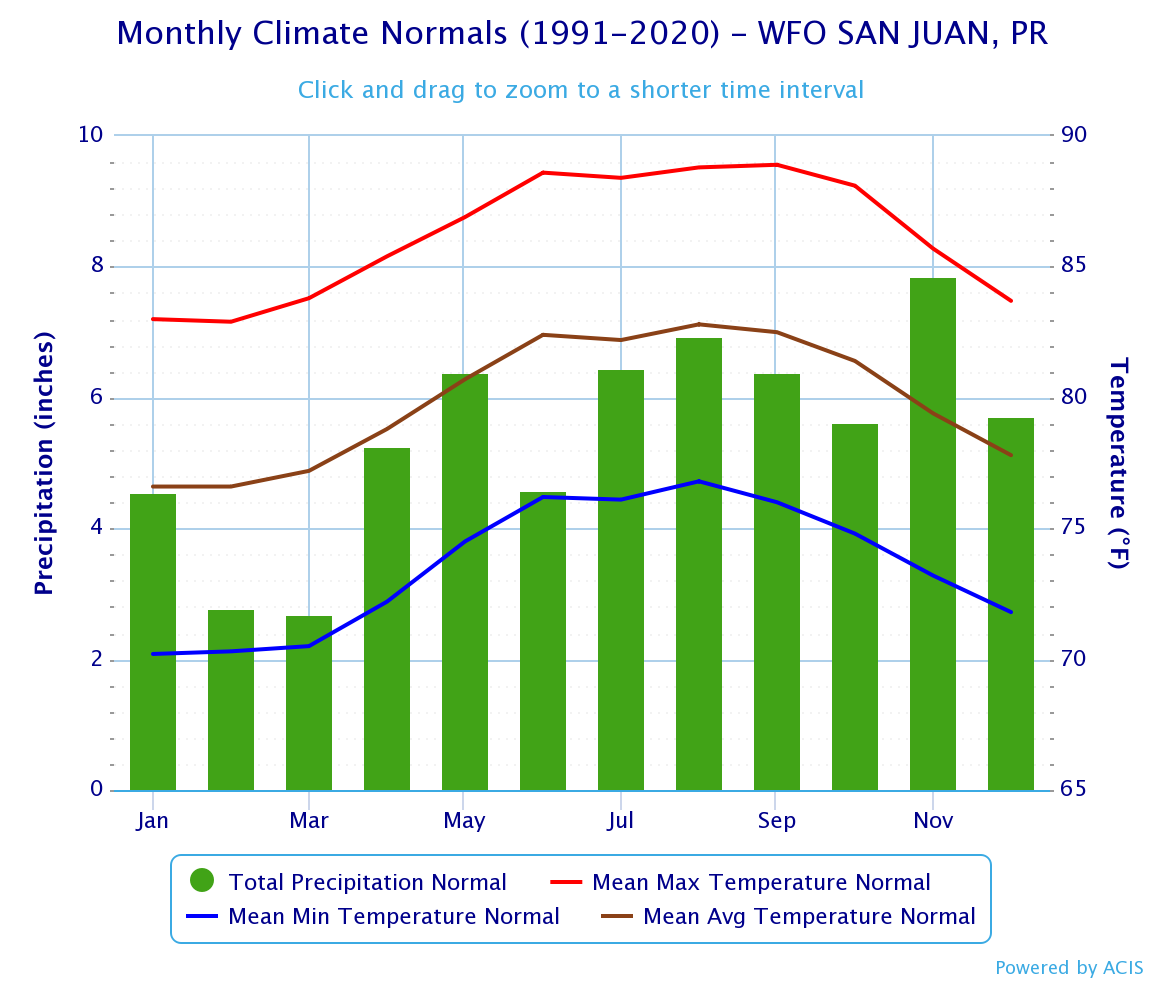
Rainfall and Temperature Maps for Puerto Rico and U.S. Virgin Islands
1991-2020 Monthly Normals
|
Please select from the below menu the desired month
|
Click the graphic below to access the
|
What are normals?
In a general sense, a "normal" is the expected value (e.g., temperature, precipitation amount, etc.) for a particular location during a particular time of year. Normals help describe a location's climate by quantifying certain elements, such as precipitation seasonality. For monthly and annual values, normals are typically the average values during the 30-year period. Distinctly different from averages, daily normals (1991-2020) were computed using a harmonic fit, a statistical method which dampens the effects of outliers, creating a smooth transition between adjacent days.
Why does NOAA produce normals?
NOAA's computation of climate normals is in accordance with the recommendation of the World Meteorological Organization (WMO), of which the United States is a member. While the WMO mandates each member nation to compute 30-year averages of meteorological quantities at least every 30 years (1931-1960, 1961-1990, 1991-2020, etc.), the WMO recommends a decadal update, in part to incorporate newer weather stations.
For what purposes are normals used?
Meteorologists and climatologists regularly use normals for placing recent climate conditions into a historical context. NOAA's normals are commonly seen on local weather news segments for comparisons with the day's weather conditions. In addition to weather and climate comparisons, normals are utilized in seemingly countless applications across a variety of sectors. These include: regulation of power companies, energy load forecasting, crop selection and planting times, construction planning, building design, and many others.
Is our climate becoming warmer and wetter?
The climate of a particular location changes over time, but climate normals were not designed to be metrics of climate change. They may capture recent trends, giving a better perspective of the current state of the climate, but changes between sets of normals do not necessarily confirm a trend. Because of the rigidity of the 30-year time period, a trend on shorter or longer time scales may not be represented.
Click here to return to unique local climate data web page for the NWS San Juan


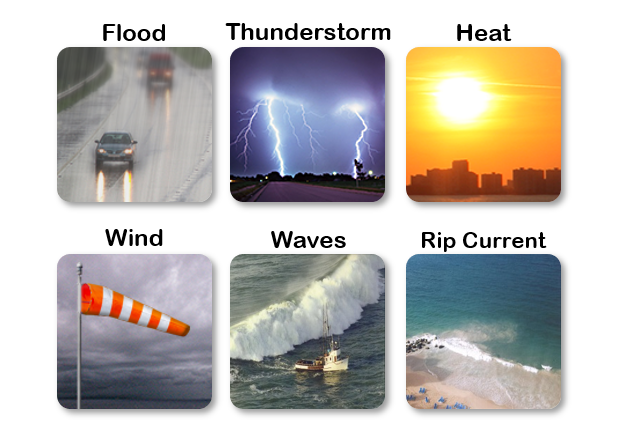 7-Day Graphical Hazardous Weather Outlook
 Tropical Analysis
 Tropical Weather
 Regional Satellite
 Puerto Rico and US Virgin Islands
 Local Radar