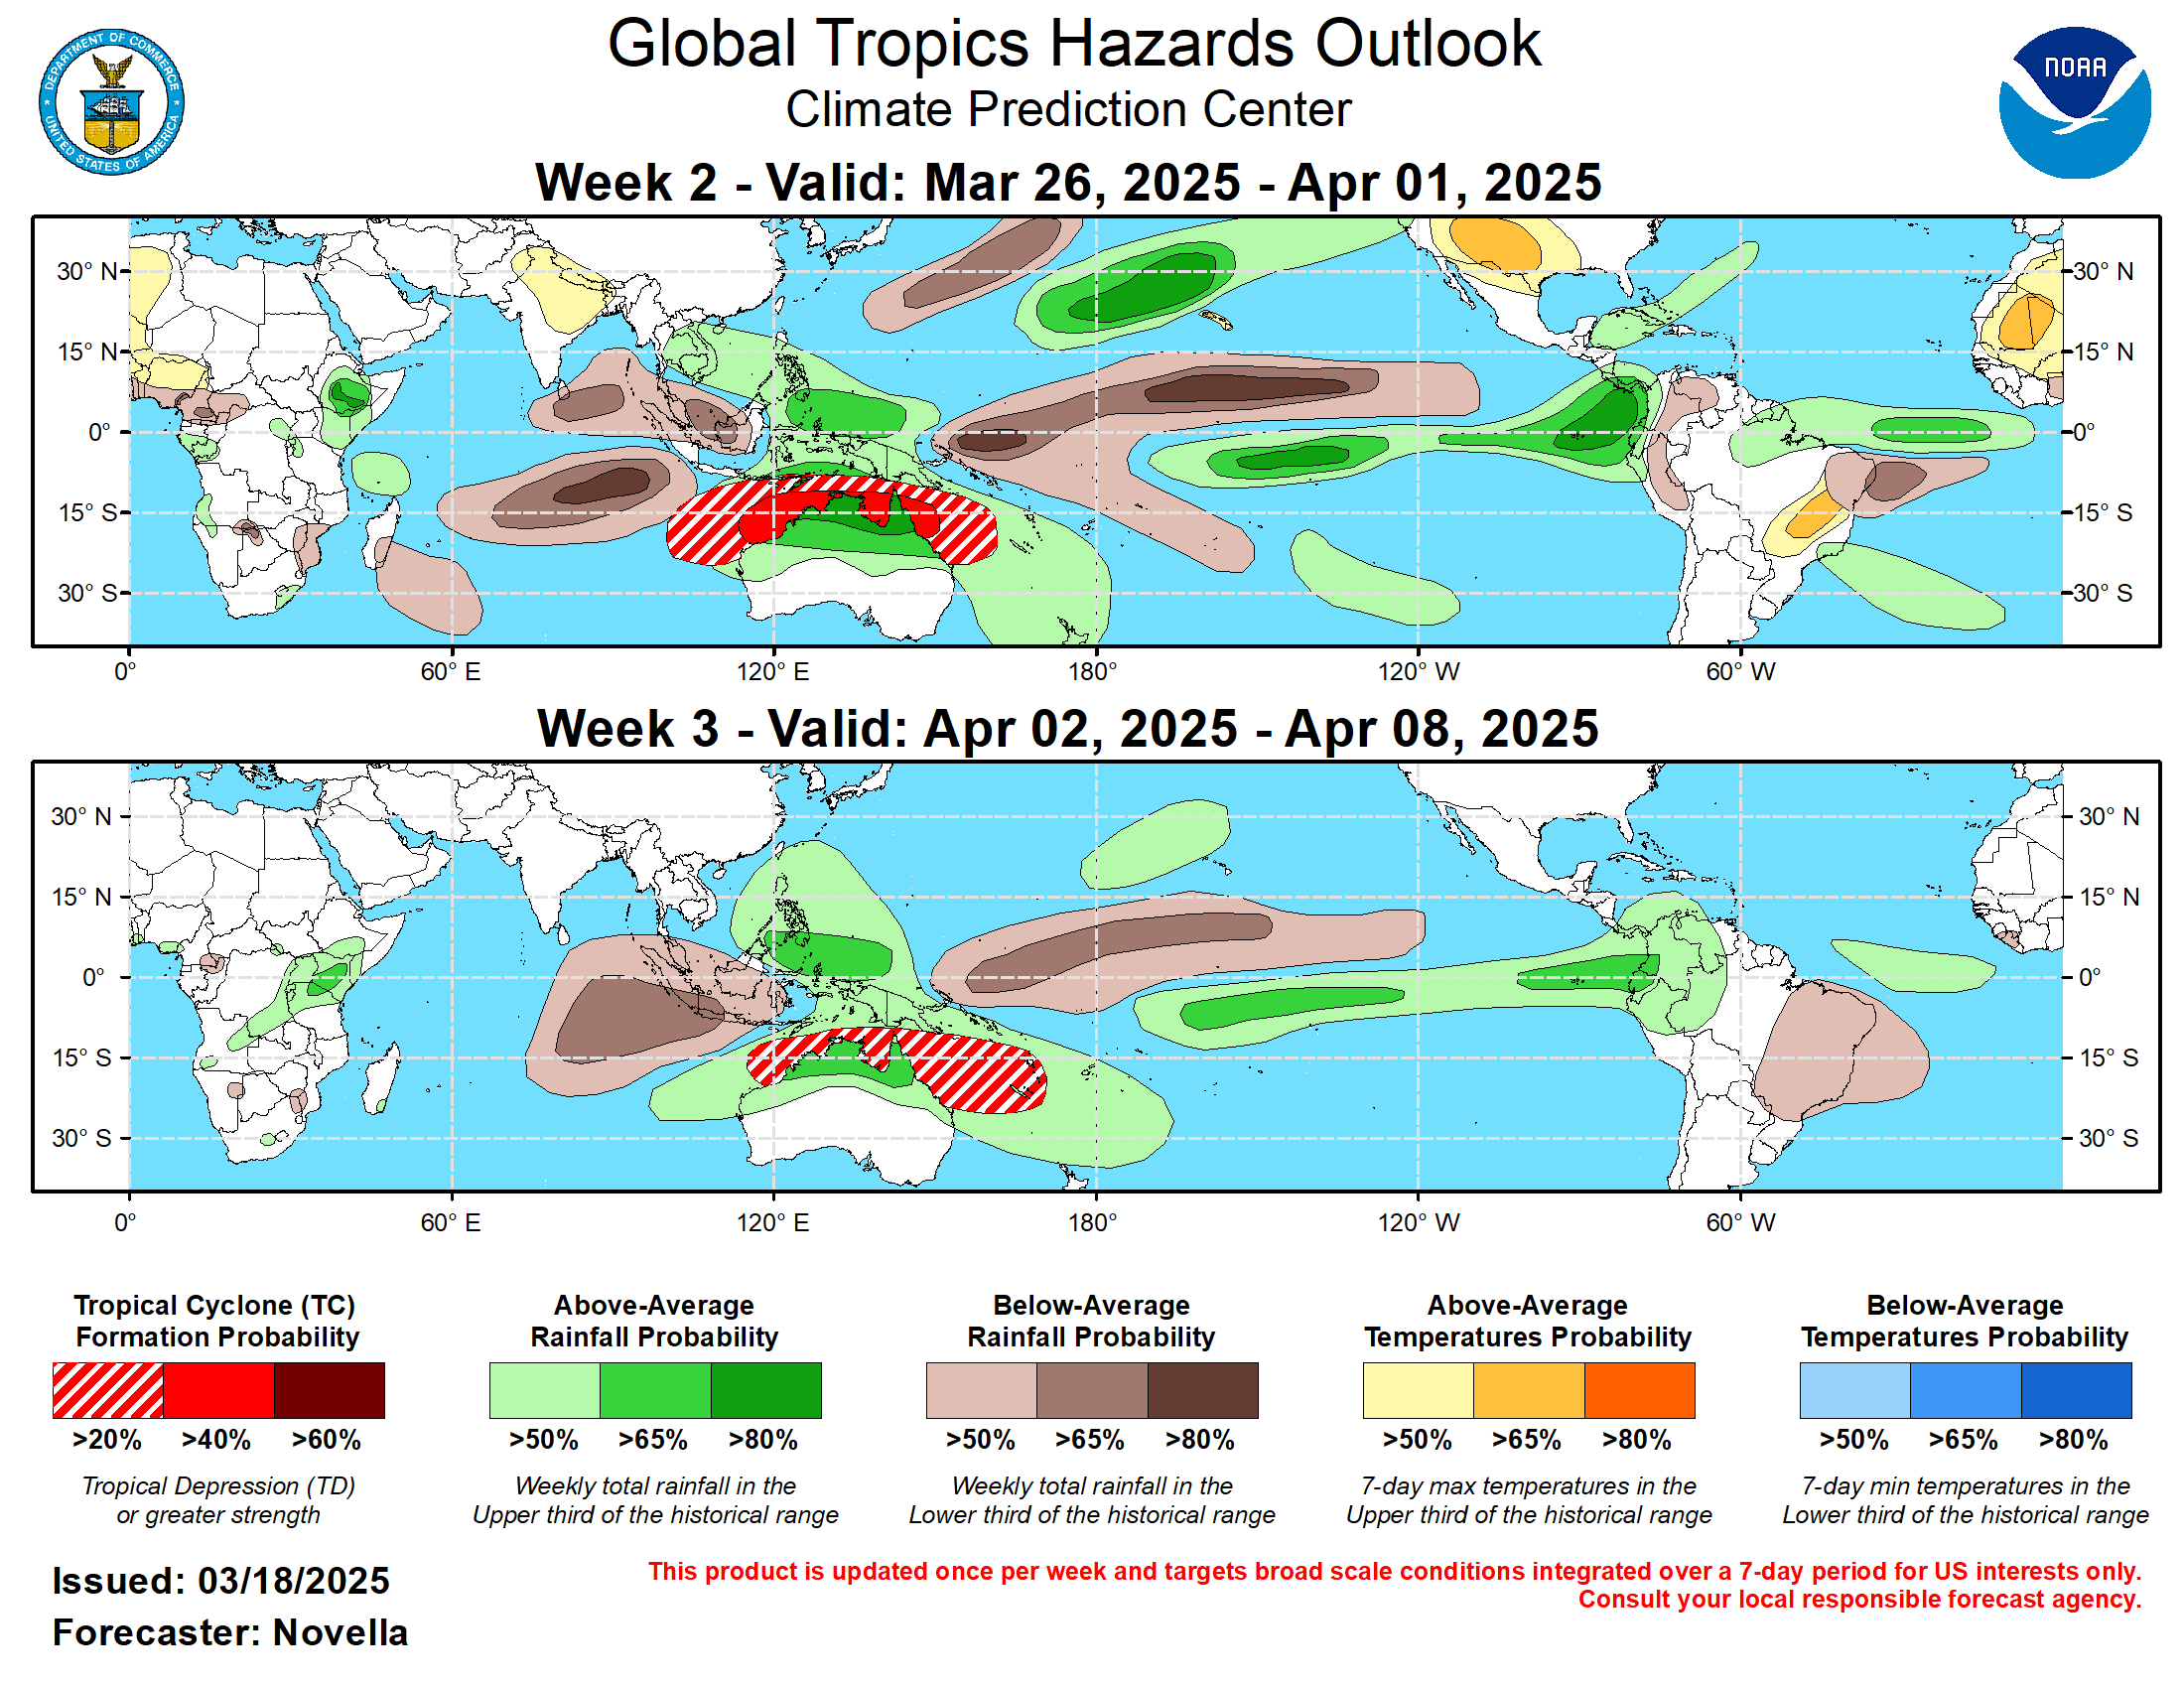
Historical percentile ranking allows no more than 5% missing data and requires at least 30 valid historical years. The comparison curve uses ACIS/NCEI 1991–2020 precipitation normals. Current accumulations end on each station's latest available numeric report when no more than 4 days old.
Source: NOAA Regional Climate Centers / Applied Climate Information System (ACIS).
Disclaimer: Data are preliminary and may contain errors. For official climate records, please refer to NOAA/NCEI.
Select a station on the map
Tap a station to view its analysis period, current accumulation, percentile band, category, historical range, and an interactive accumulated-precipitation graph versus the 1991–2020 normal.



 7-Day Graphical Hazardous Weather Outlook
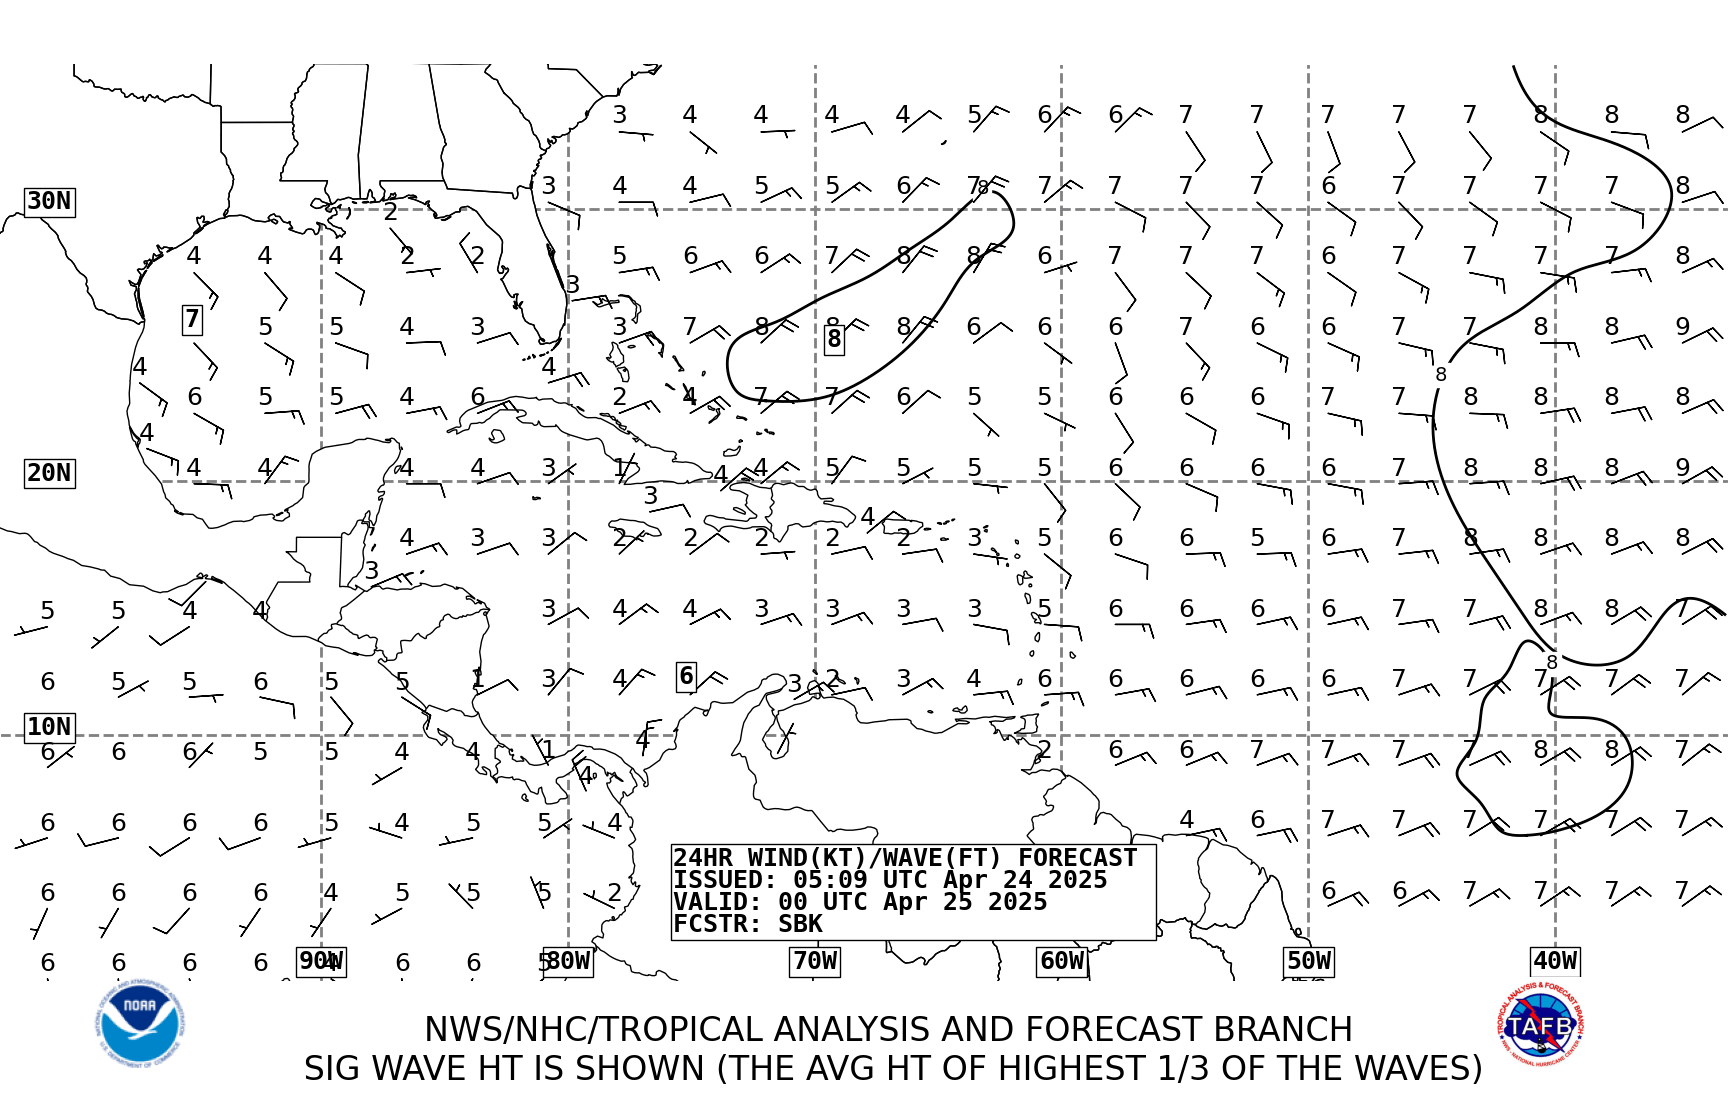 Tropical Analysis
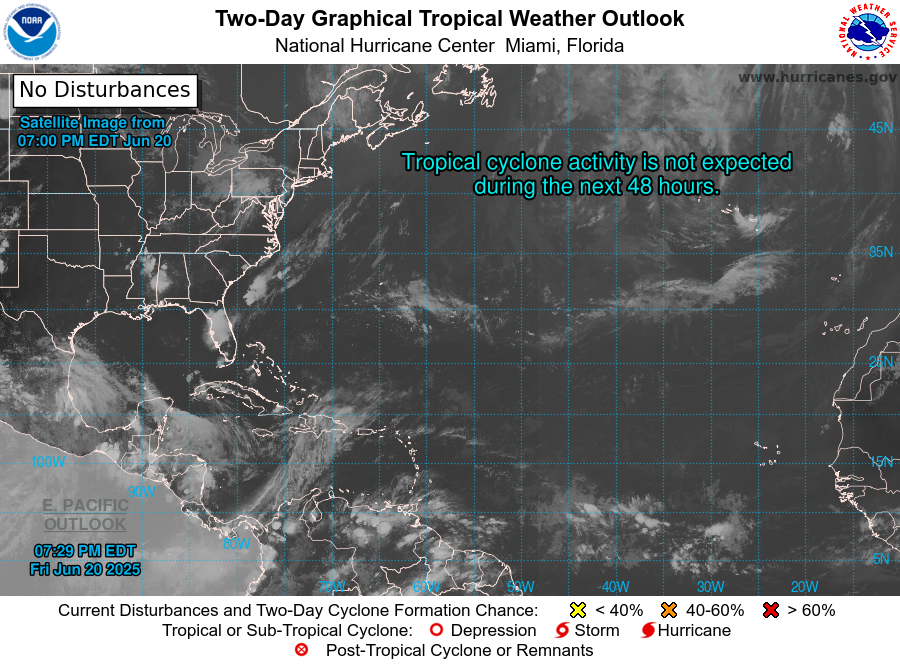 Tropical Weather
 Regional Satellite
 Puerto Rico and US Virgin Islands
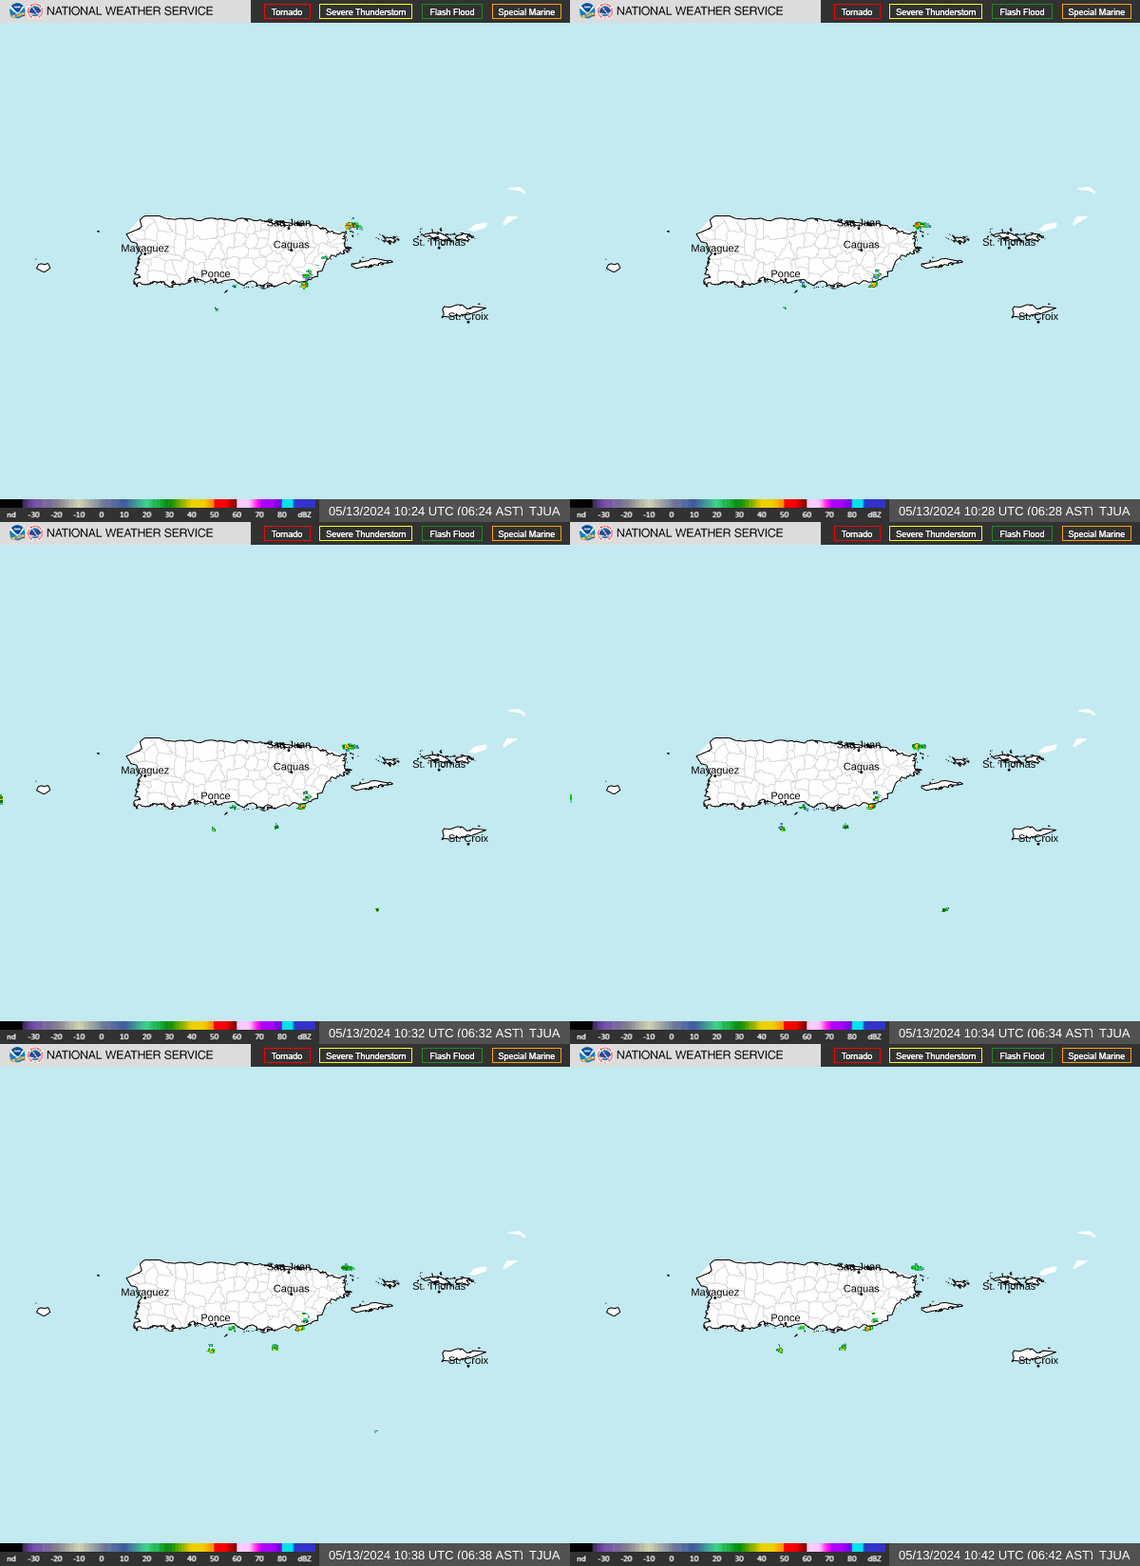 Local Radar
 Follow us on X
 Follow us on Facebook
 SJU RSS Feed