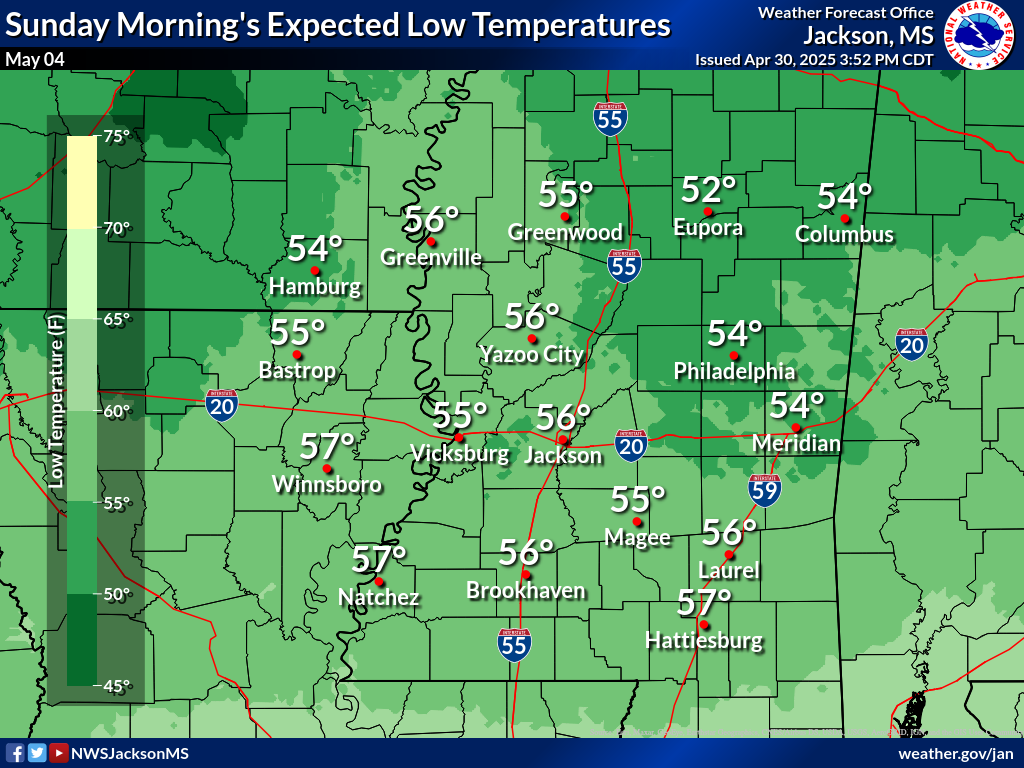
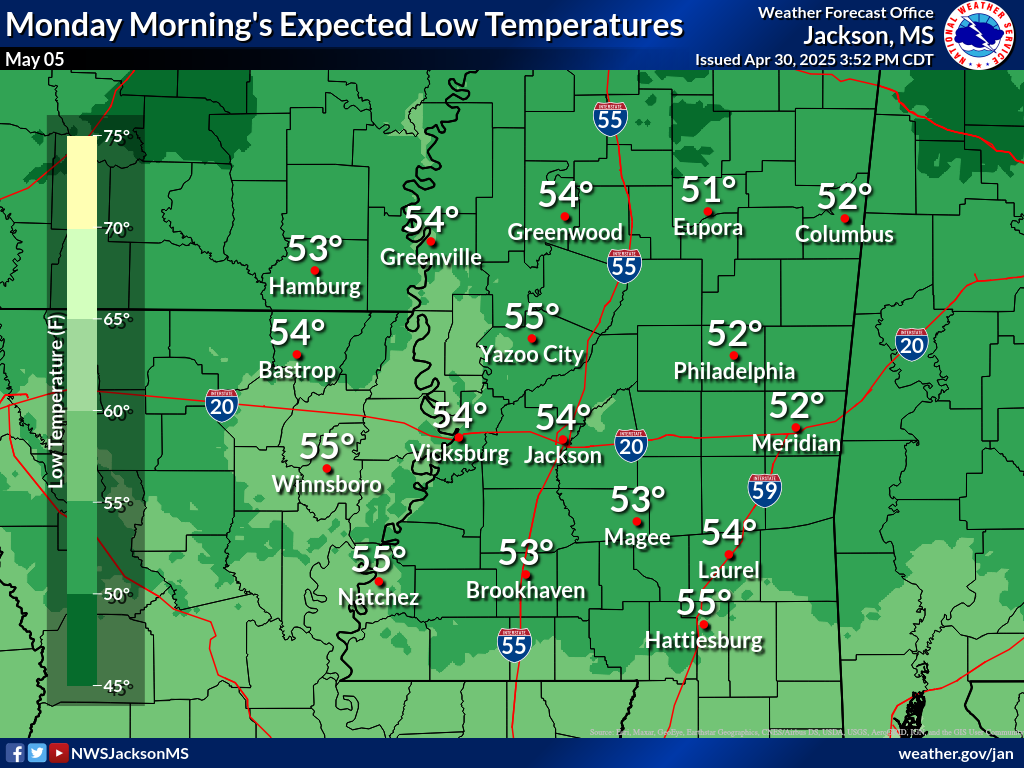
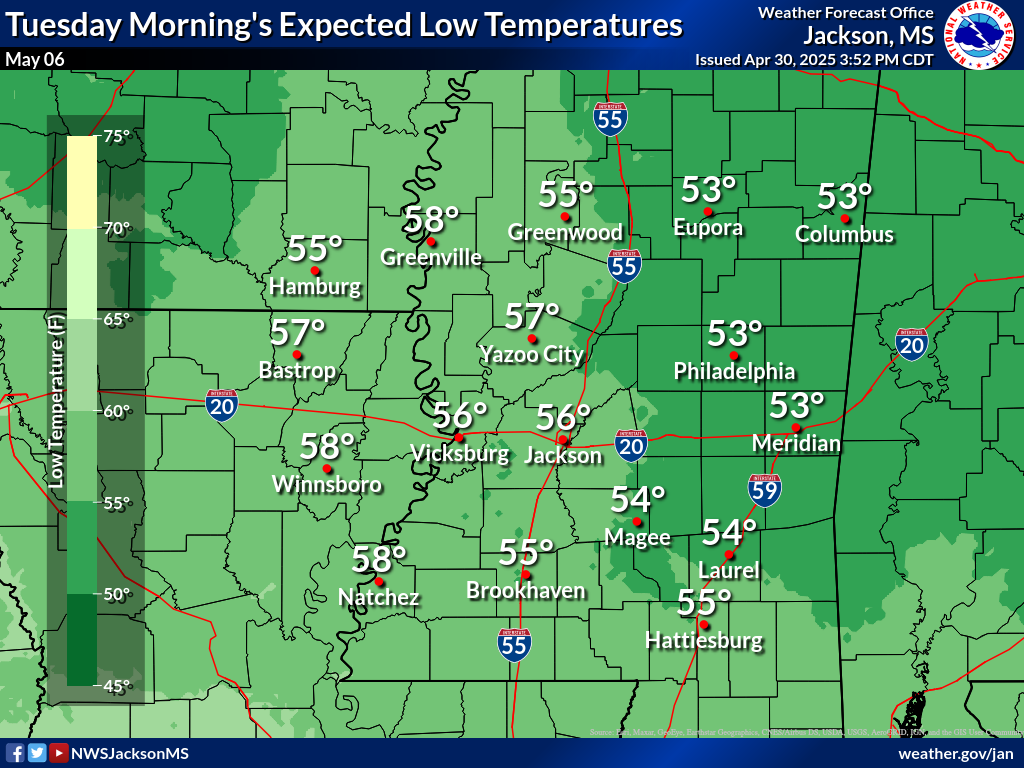
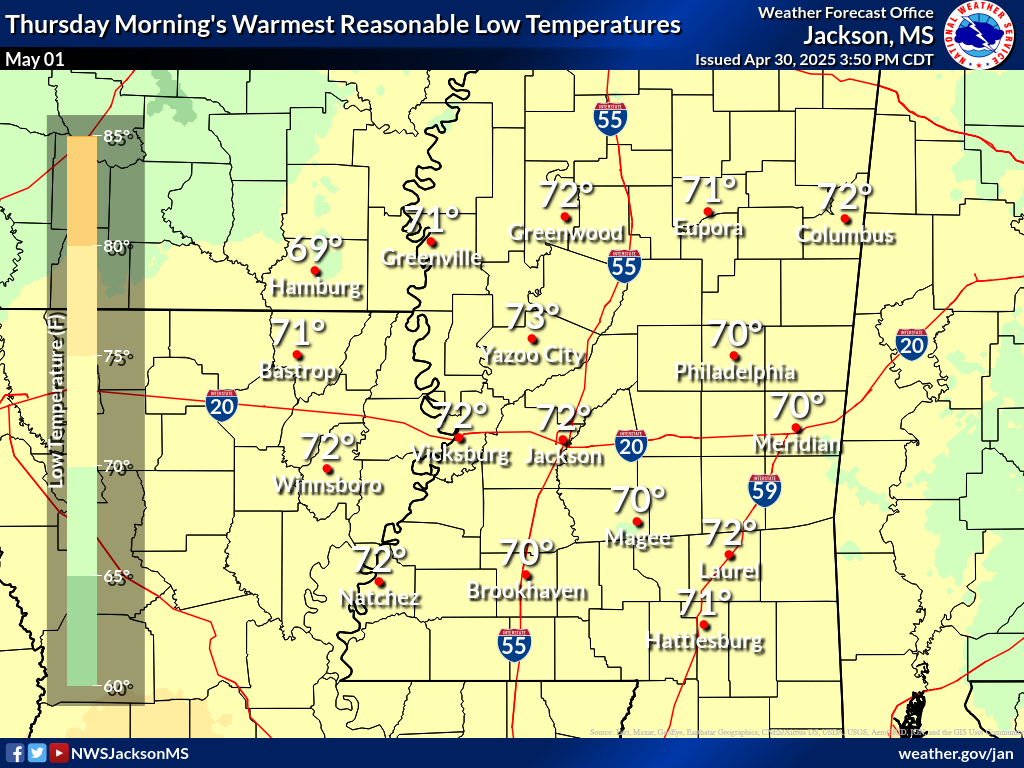
Welcome to the NWS Jackson Probabilistic Decision Support Services Page. Information contained here is intended to show a range of weather possibilities that the area could experience over the next 7 days for certain weather variables. Graphics shown on this page are the official forecast as well as graphics derived from the National Weather Service (NWS)
National Blend of Models (NBM) version 4.1. Graphics on this page are generally updated twice per day at 4:00 AM and 4:00 PM.
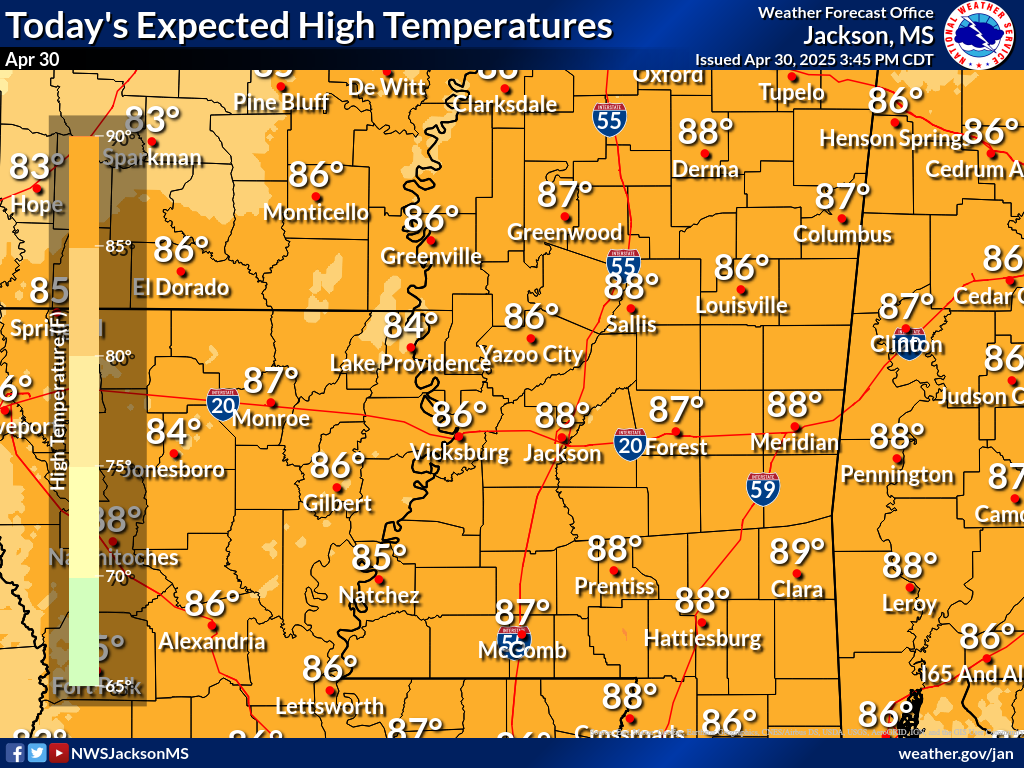
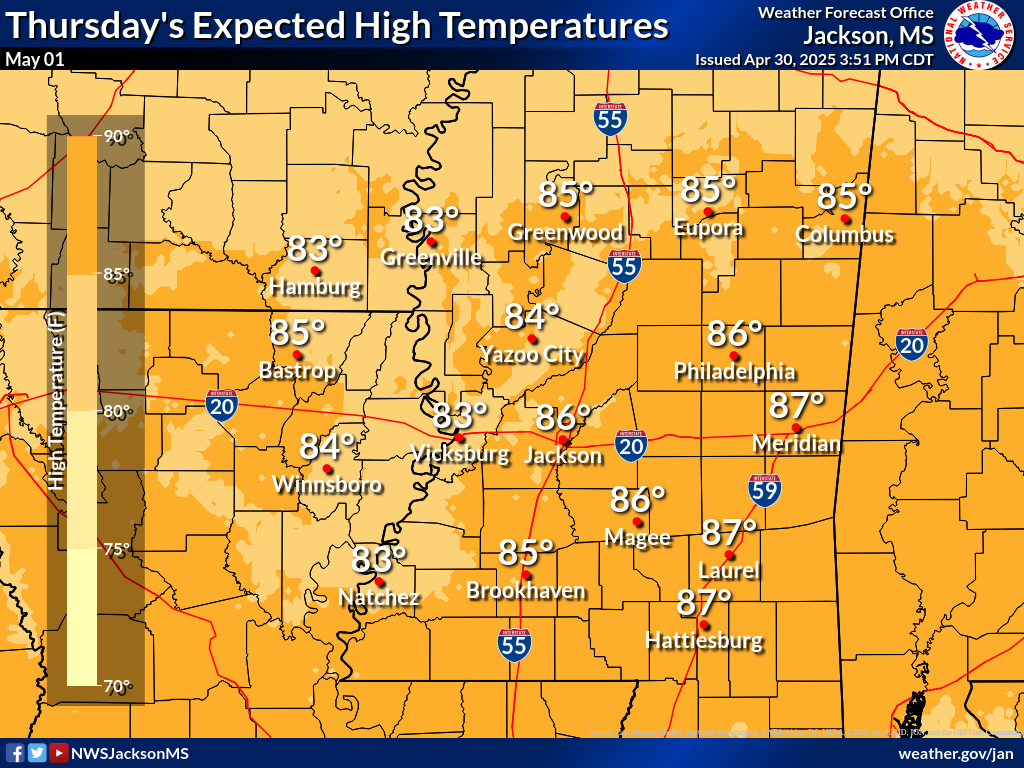
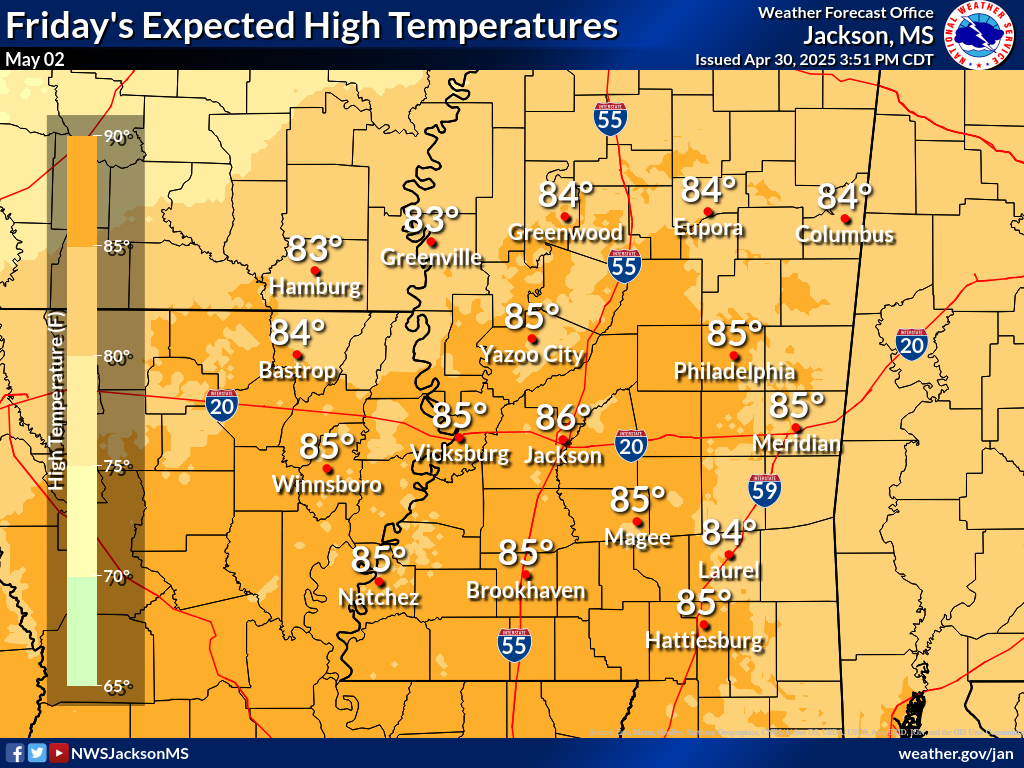
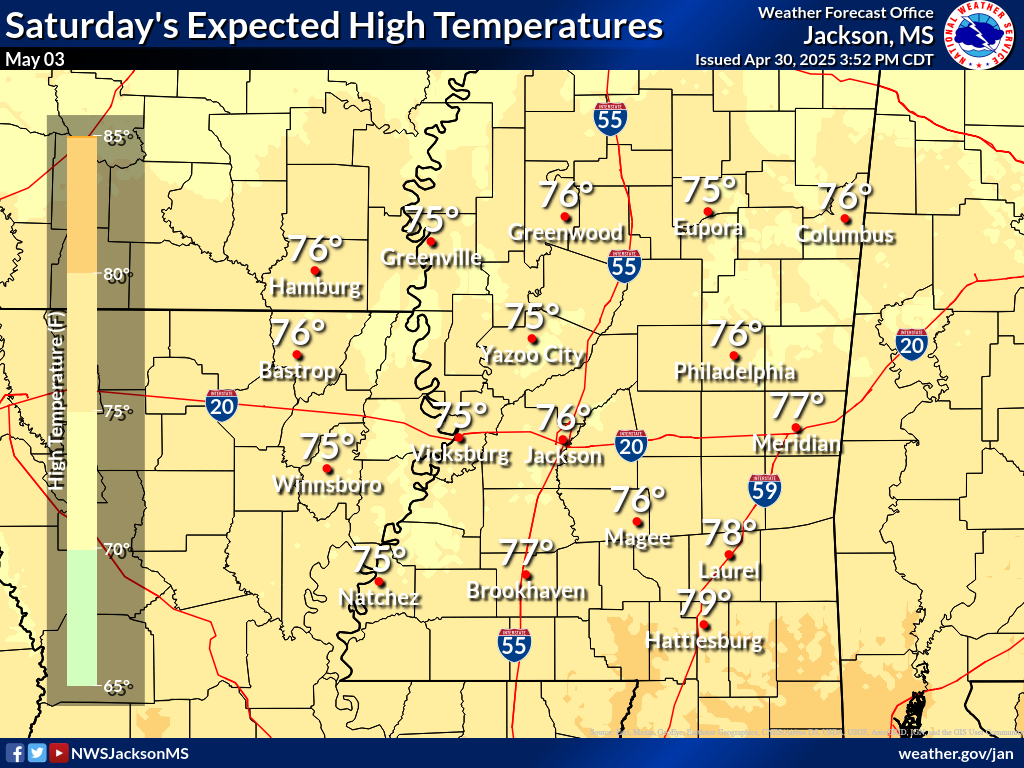
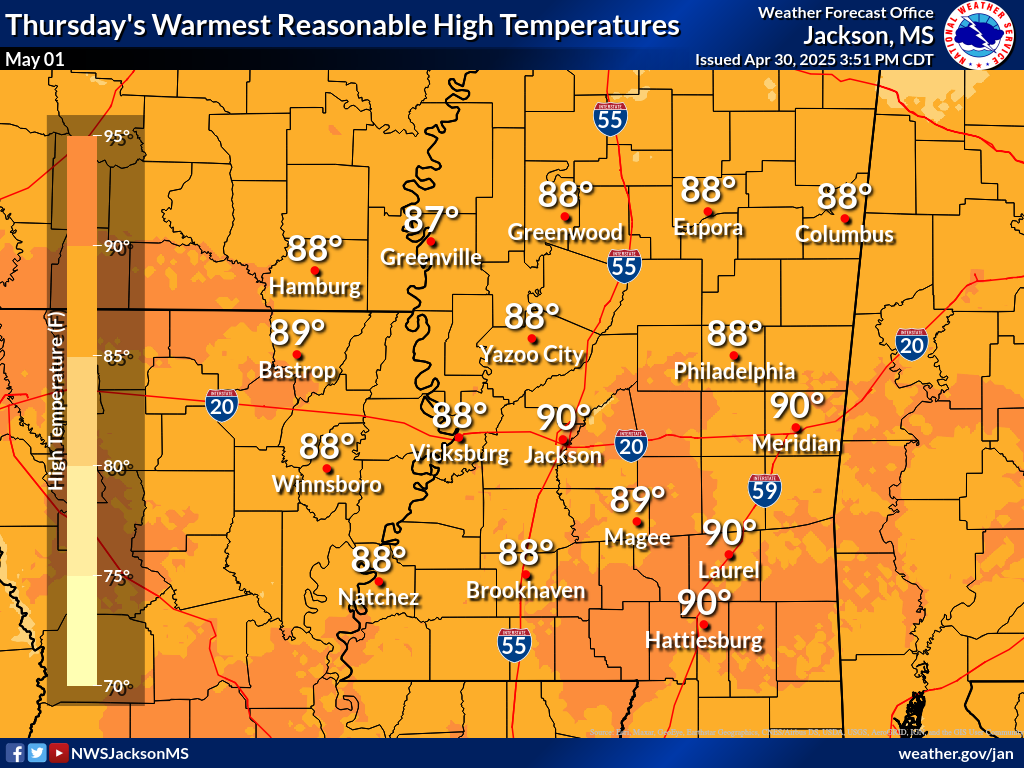
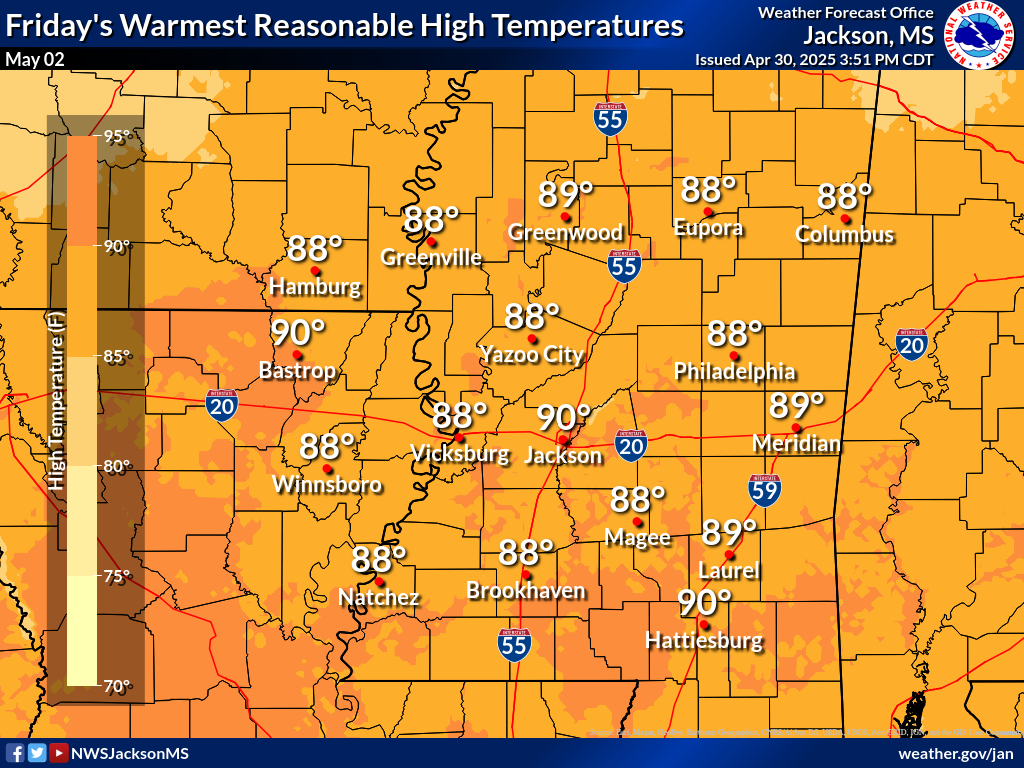
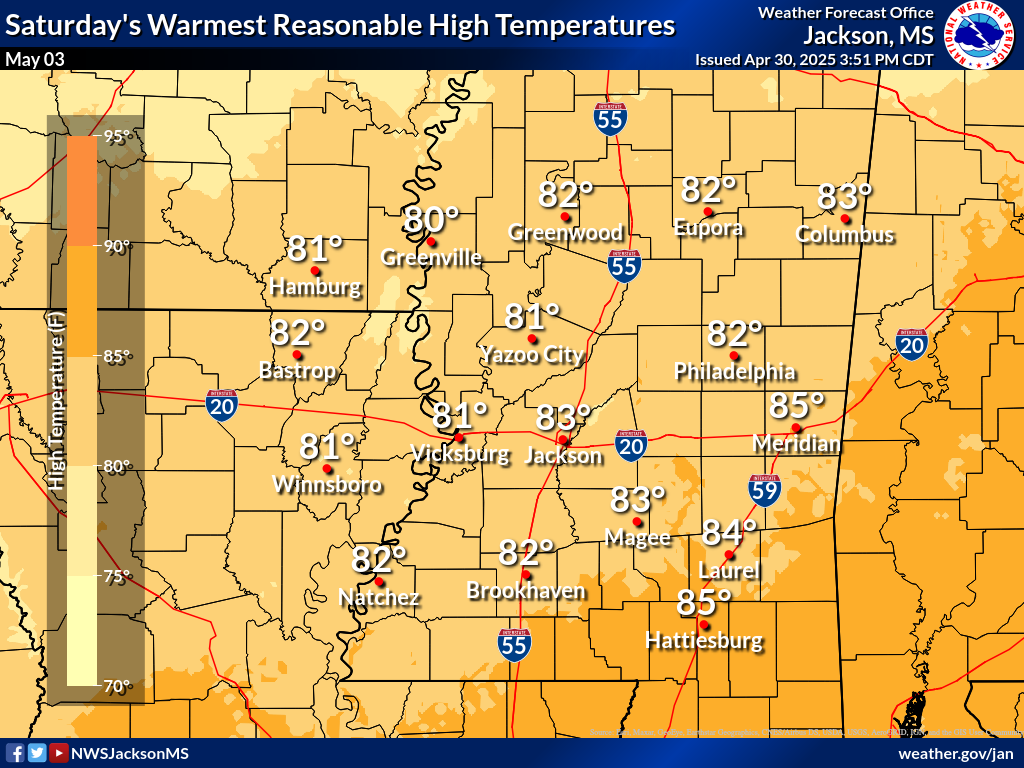
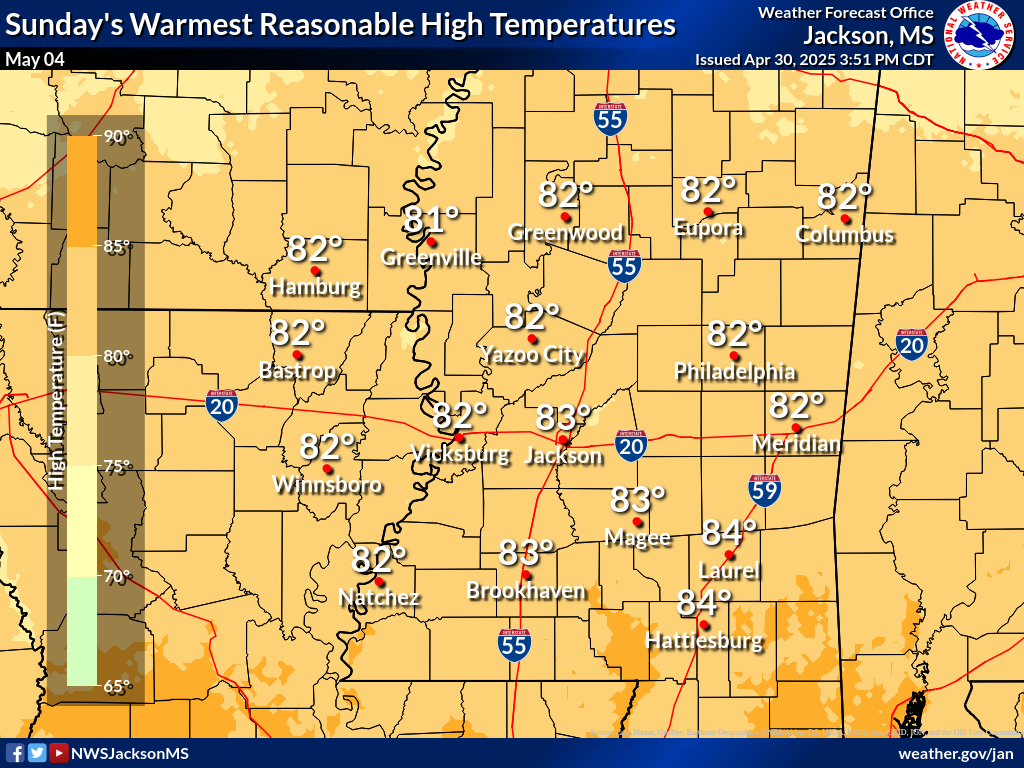
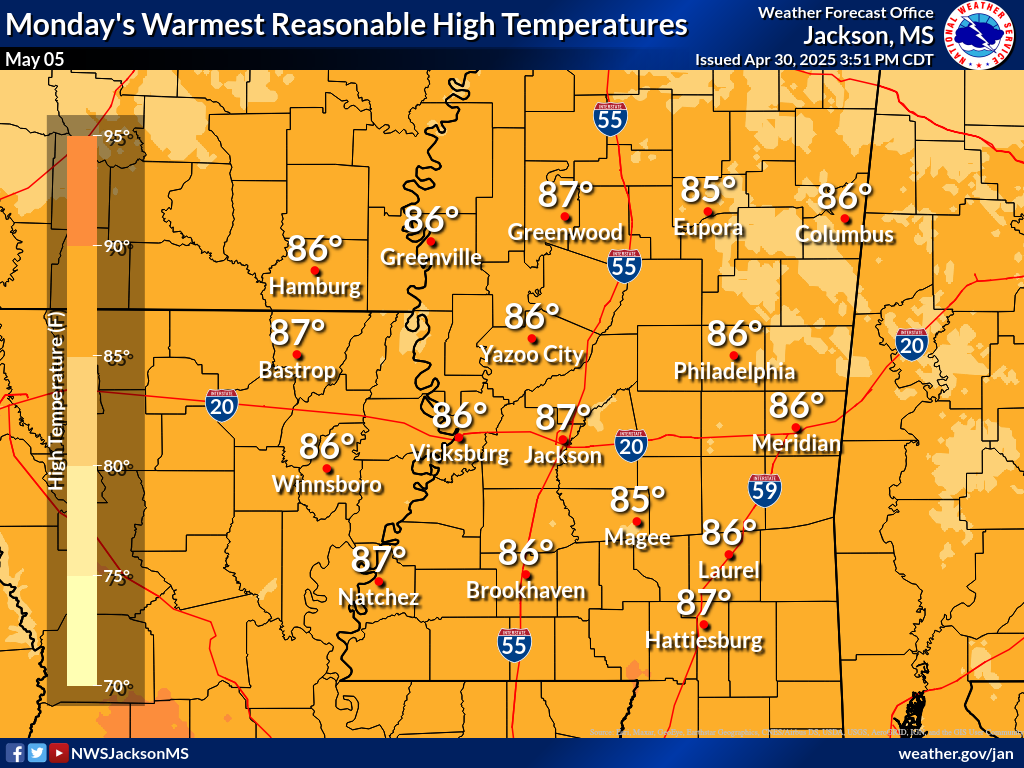
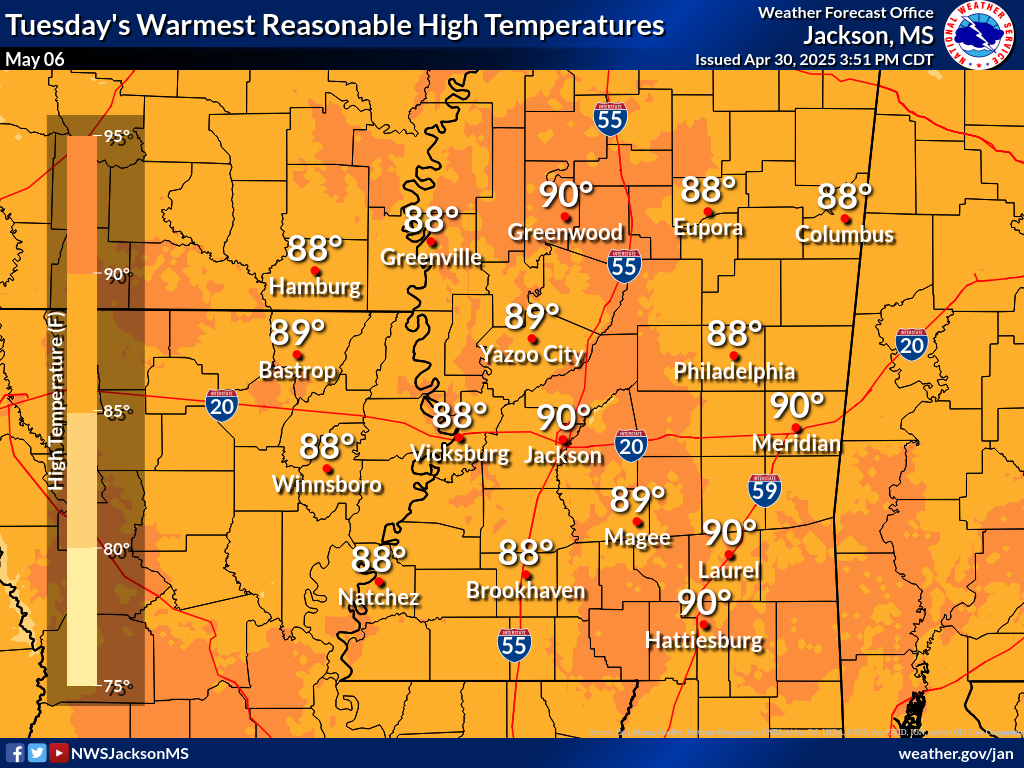
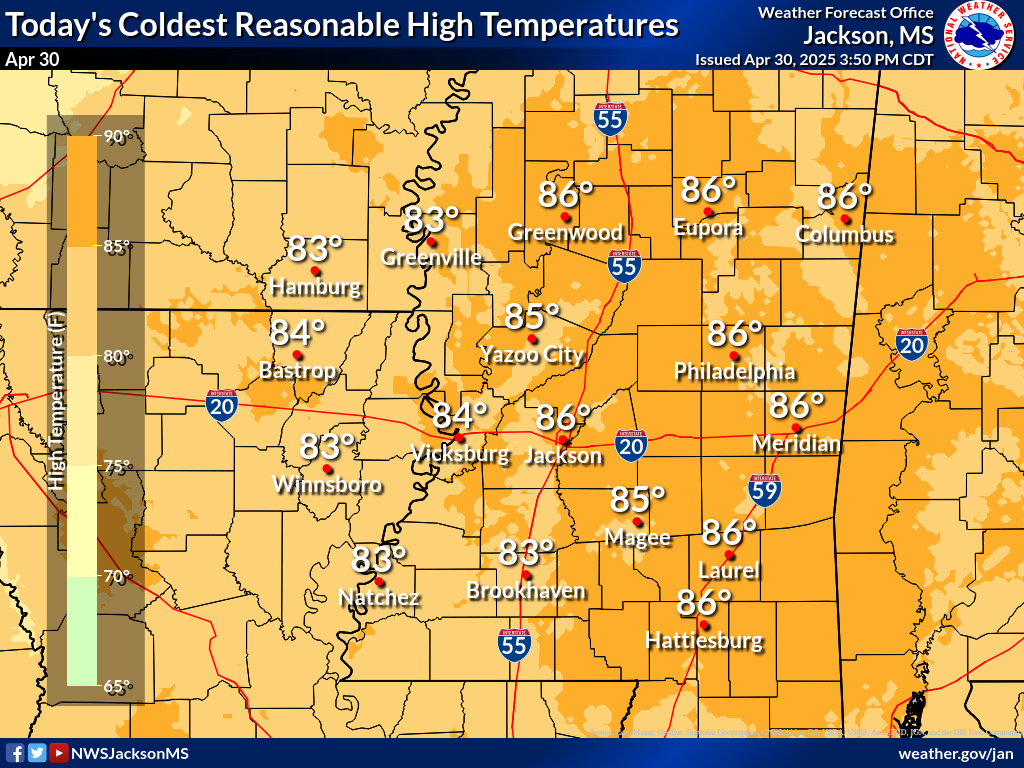
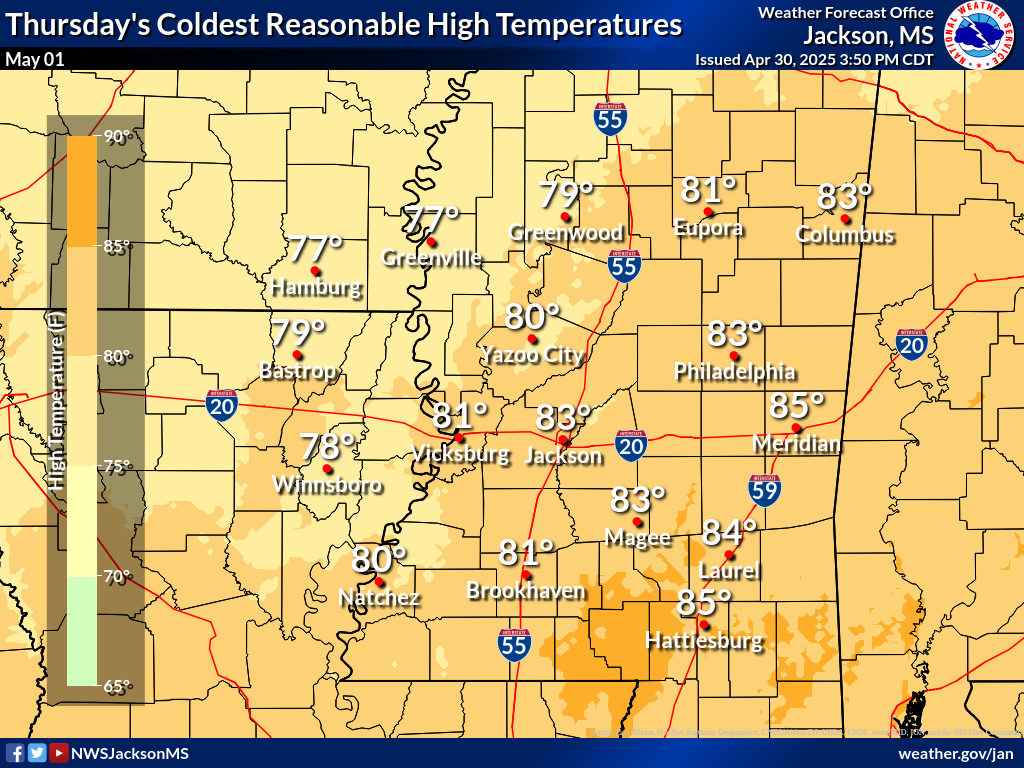
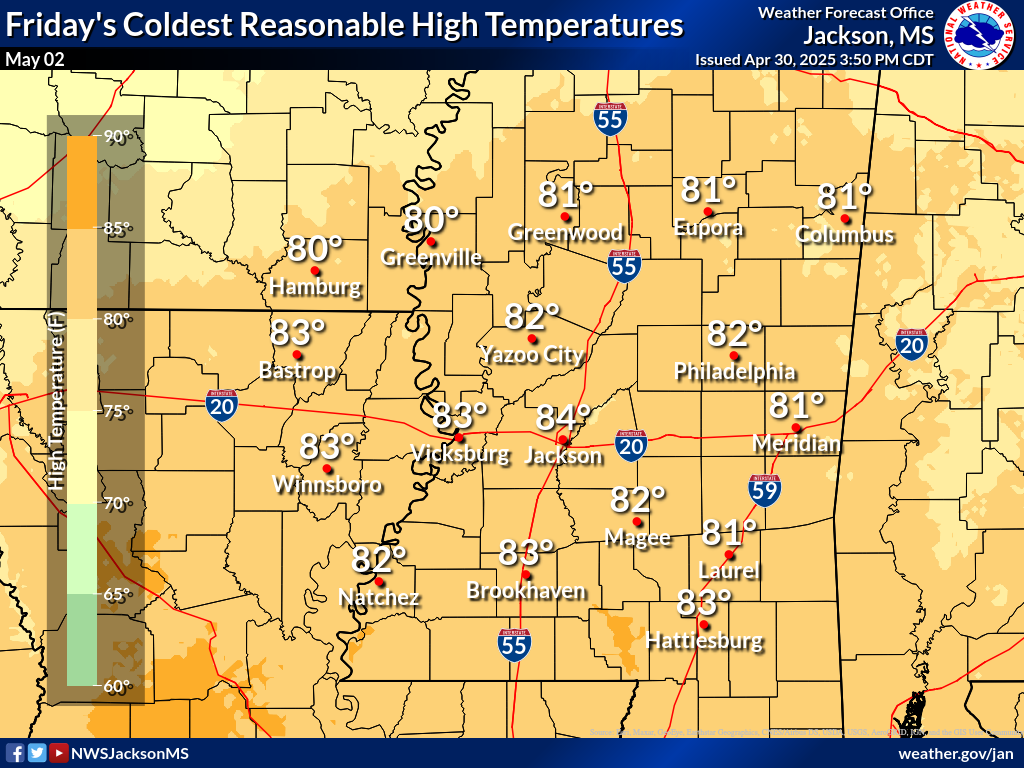
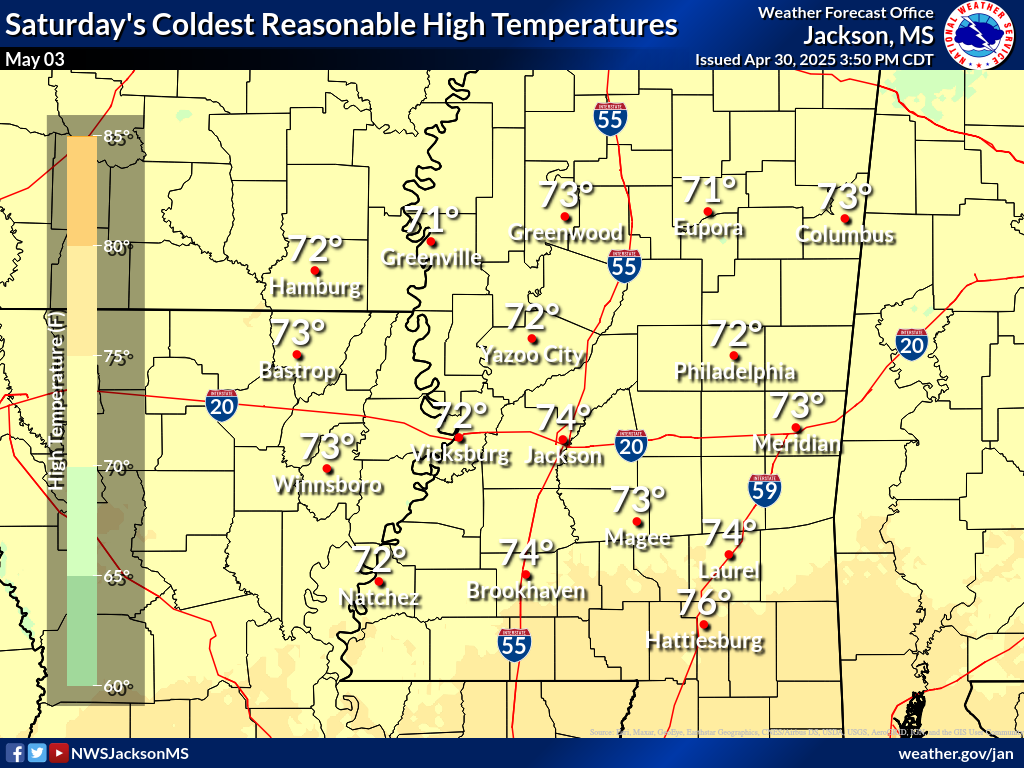
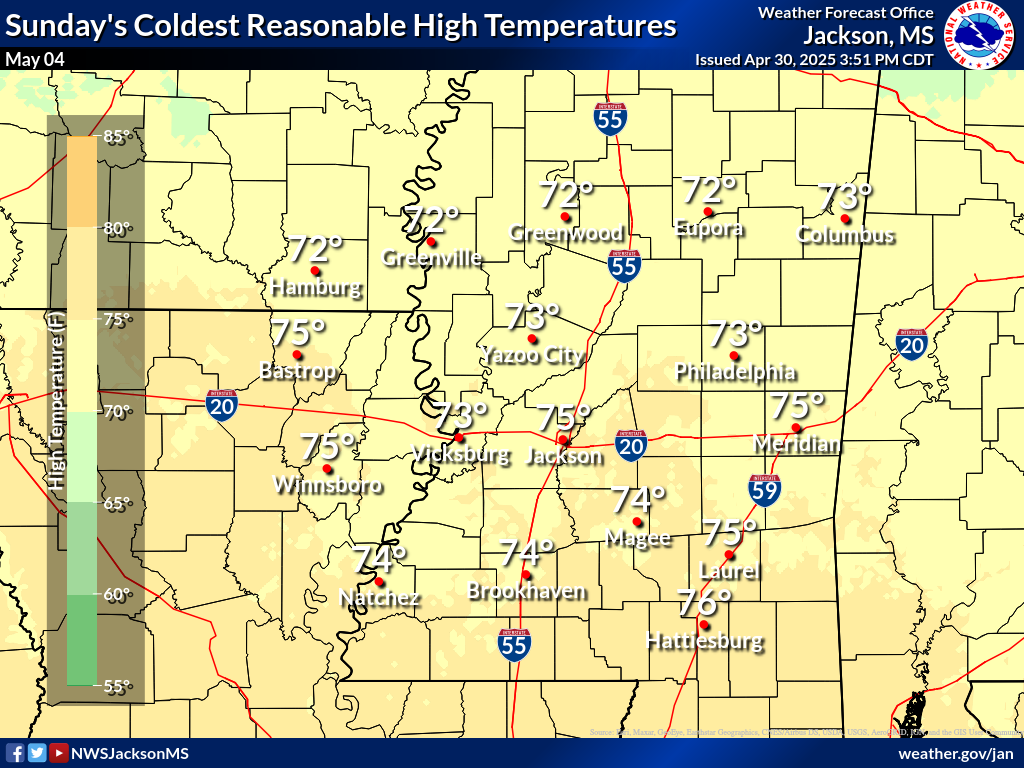
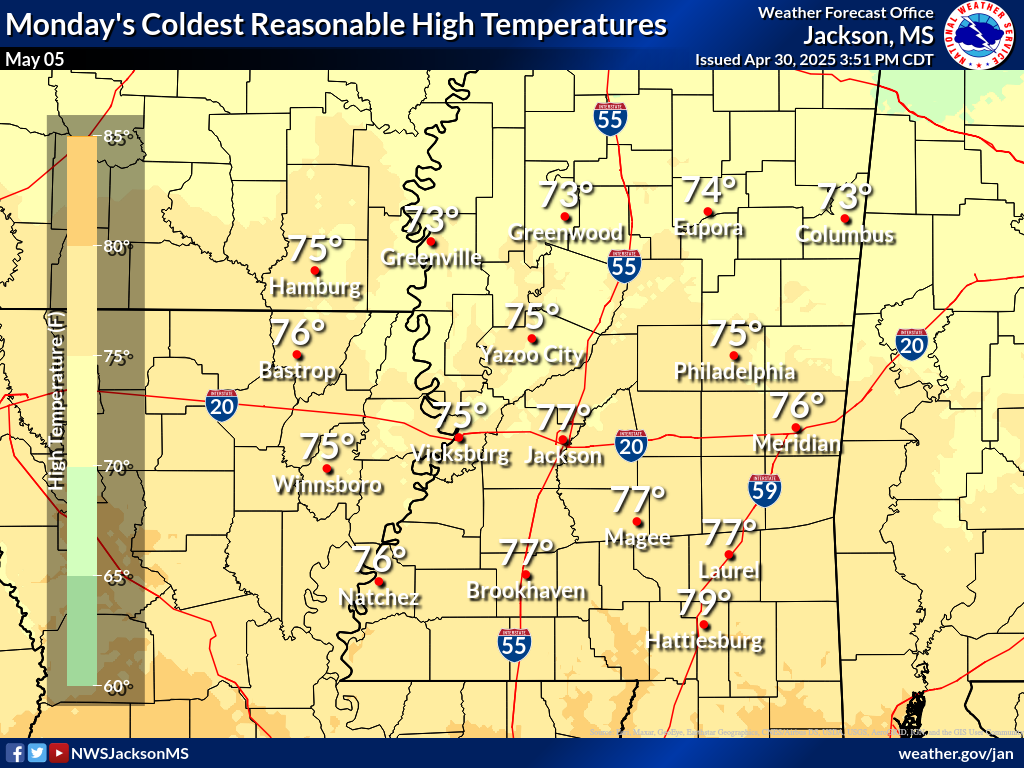
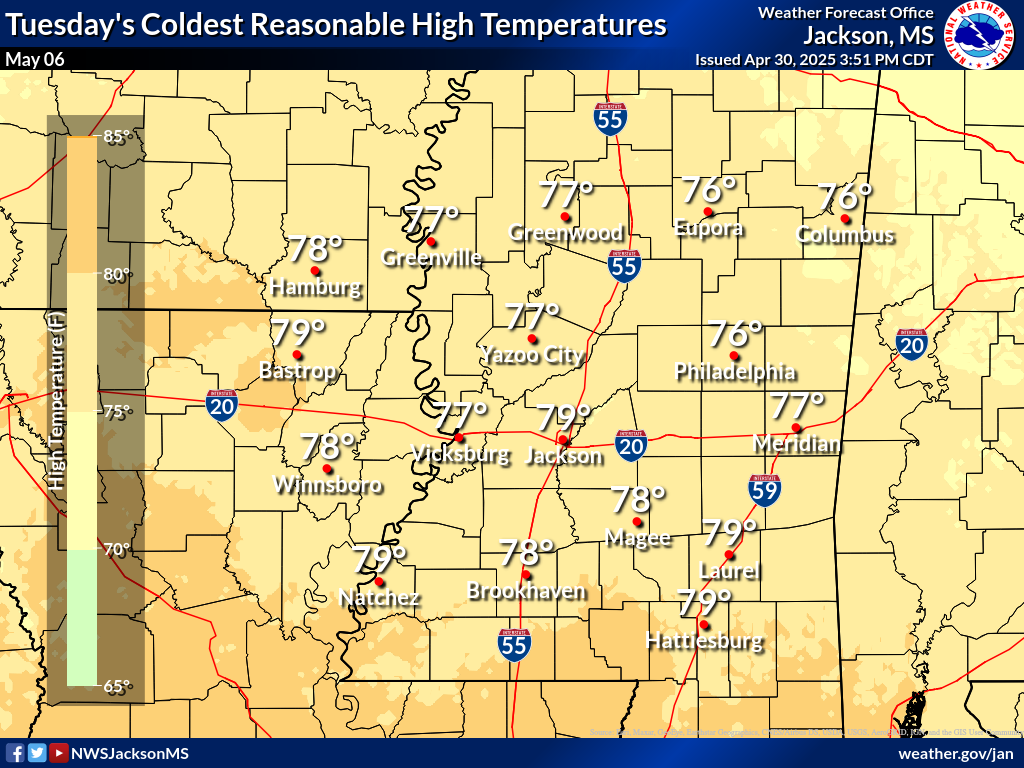
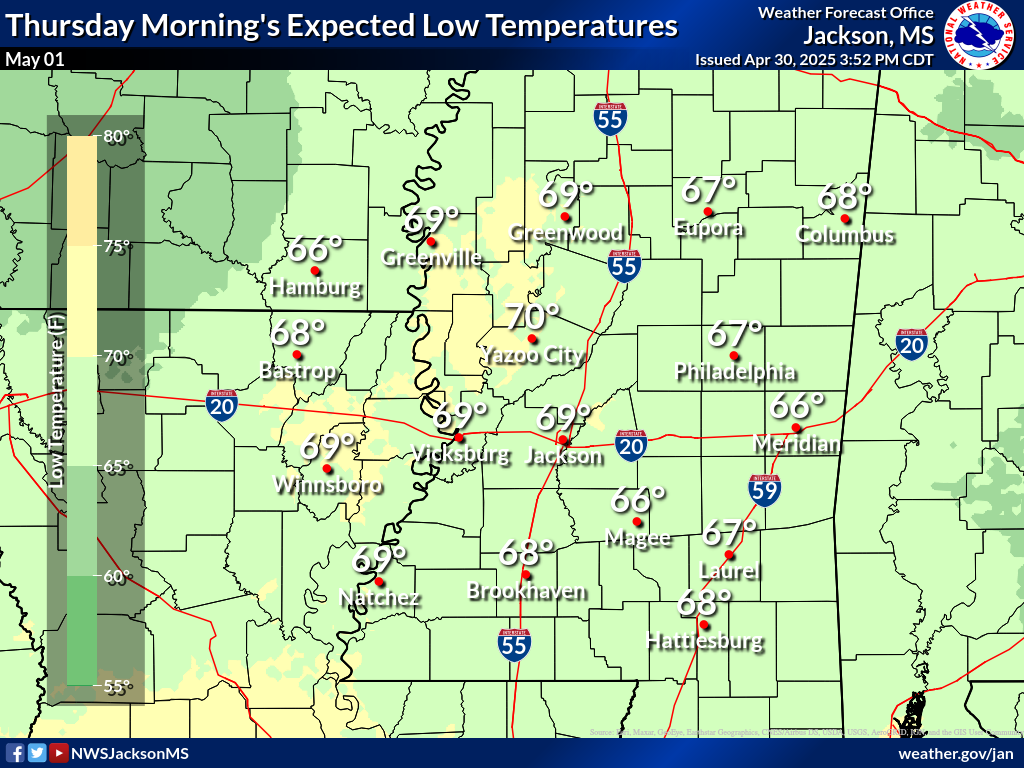
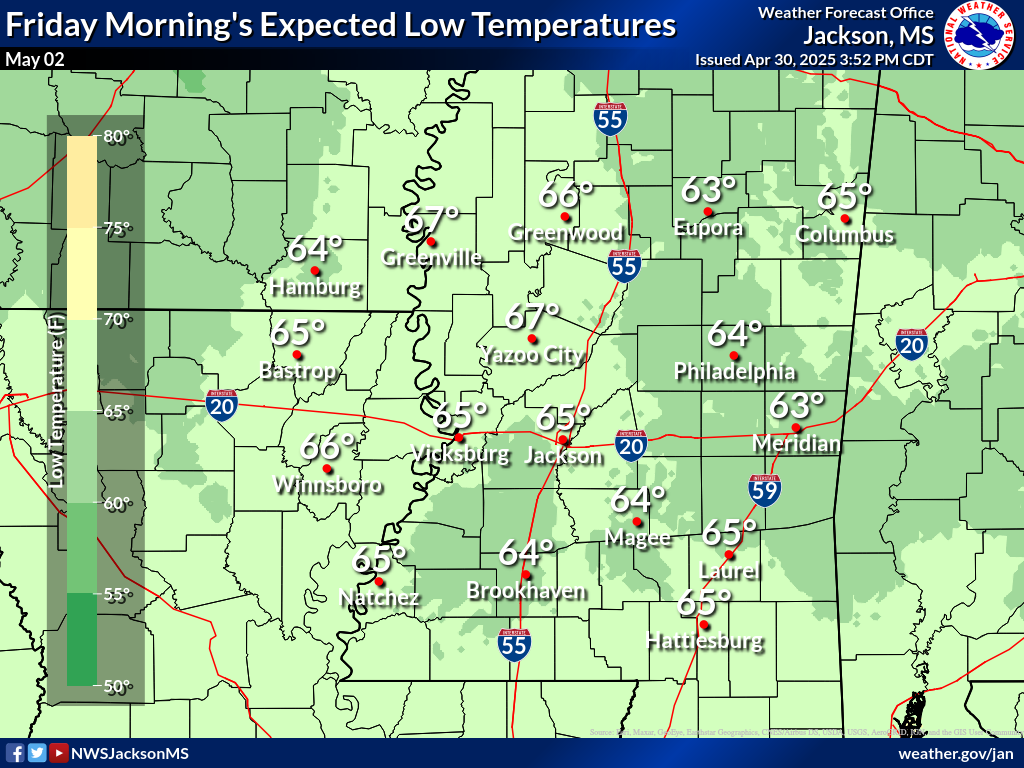
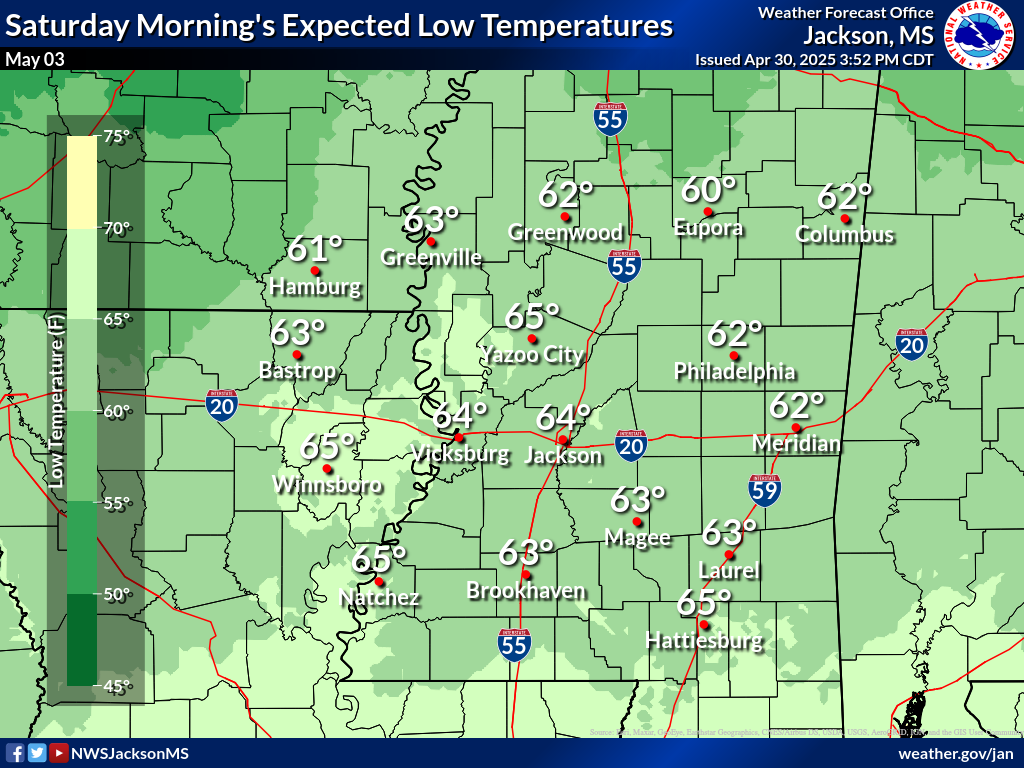
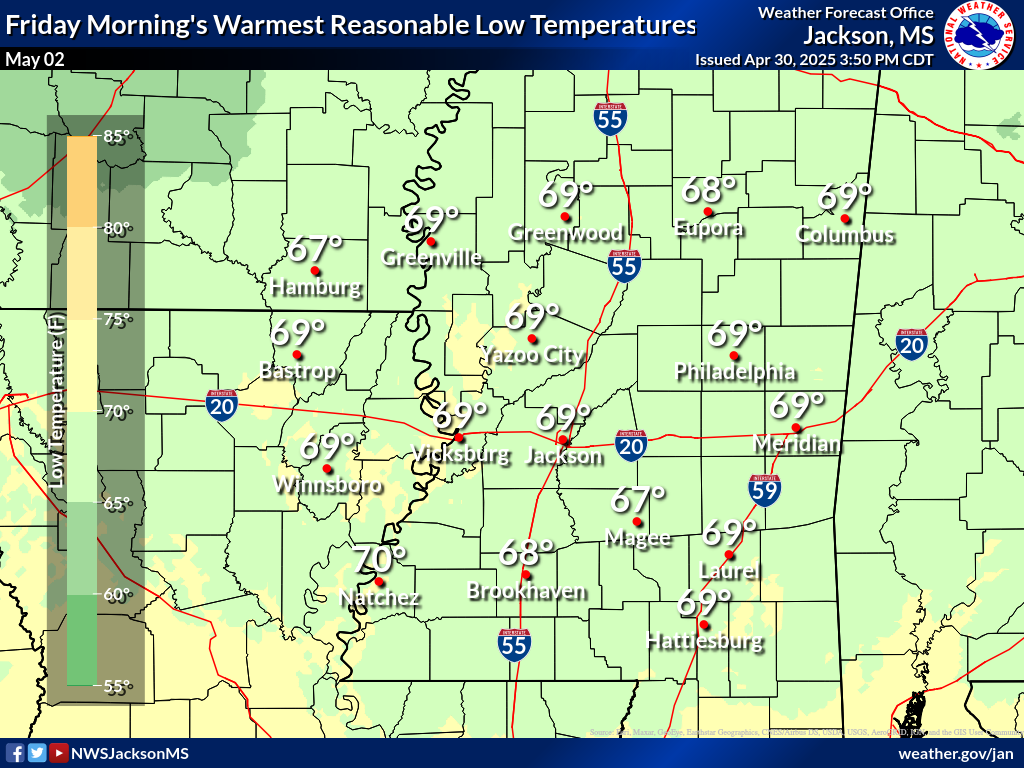
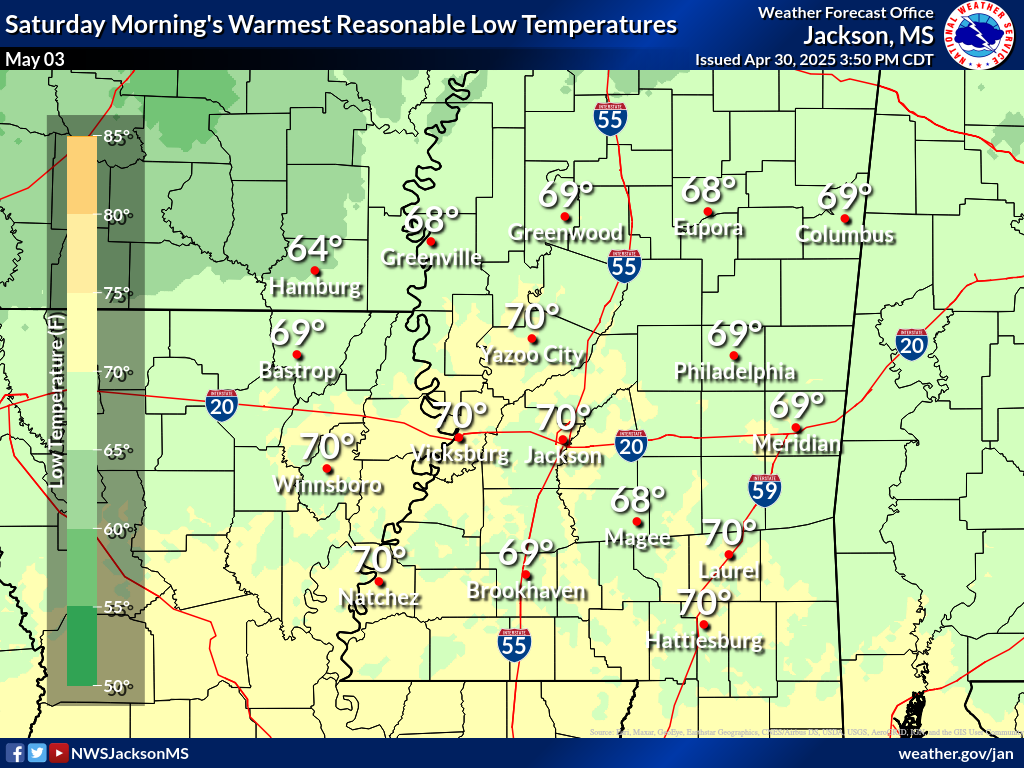
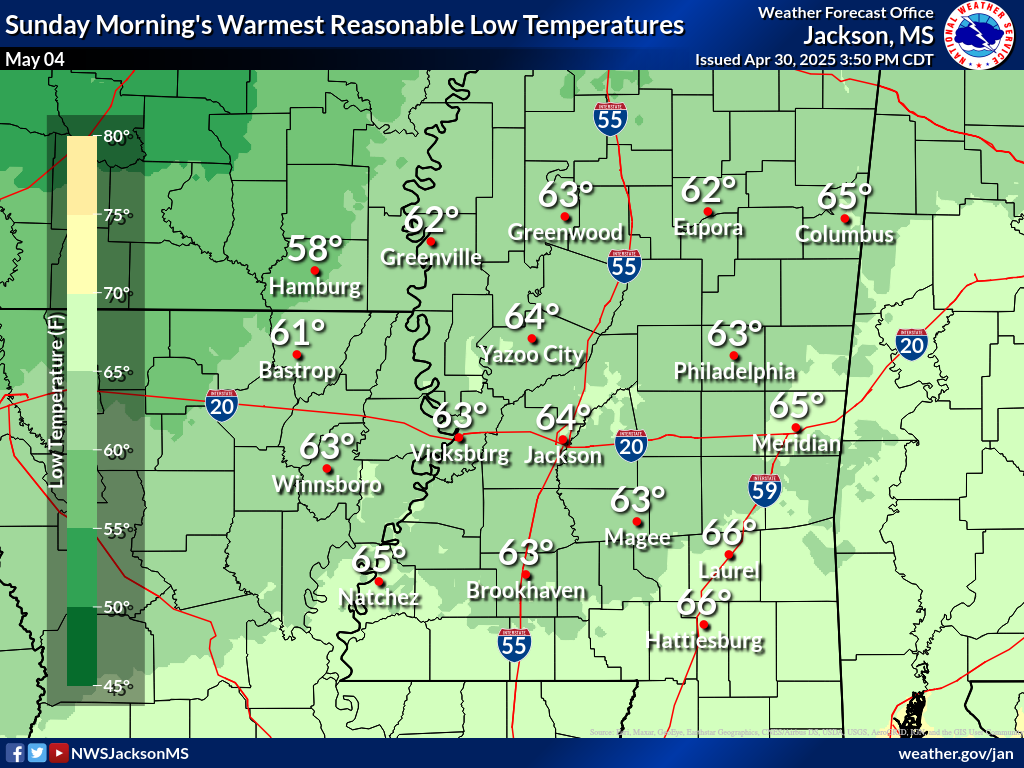
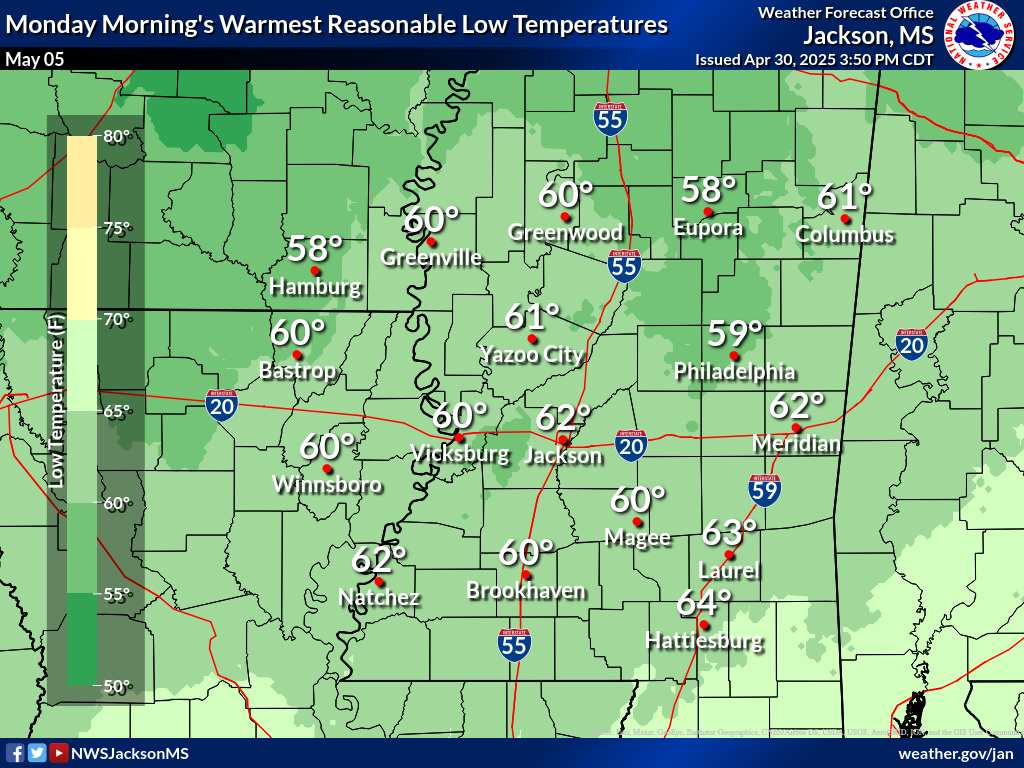
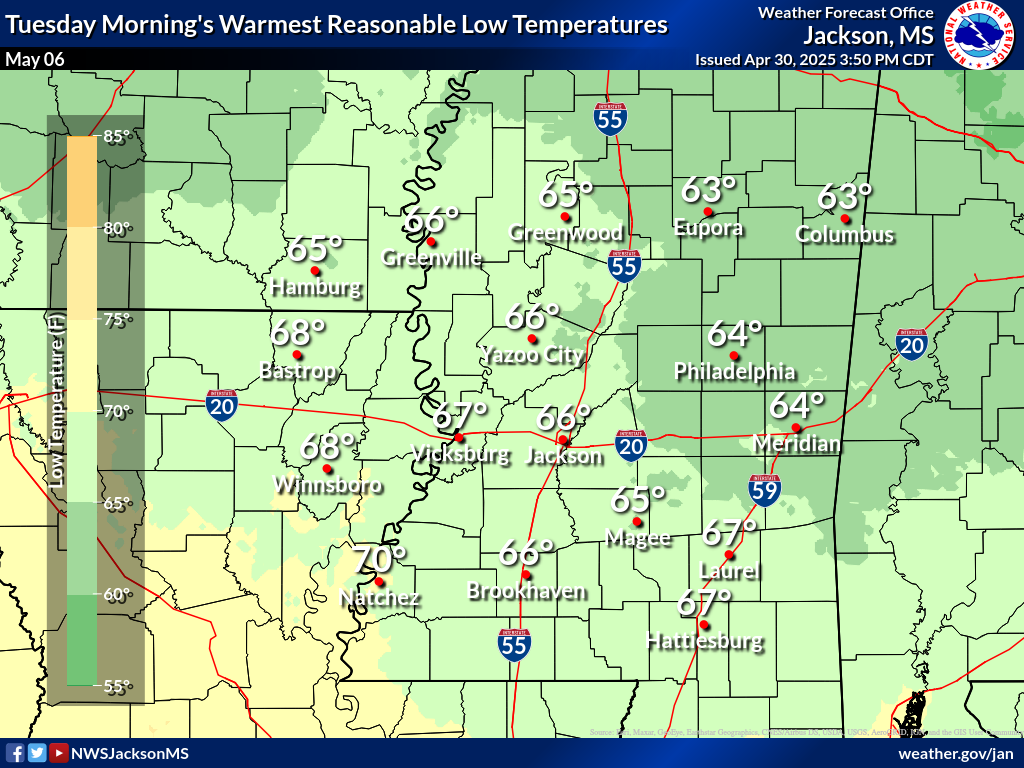
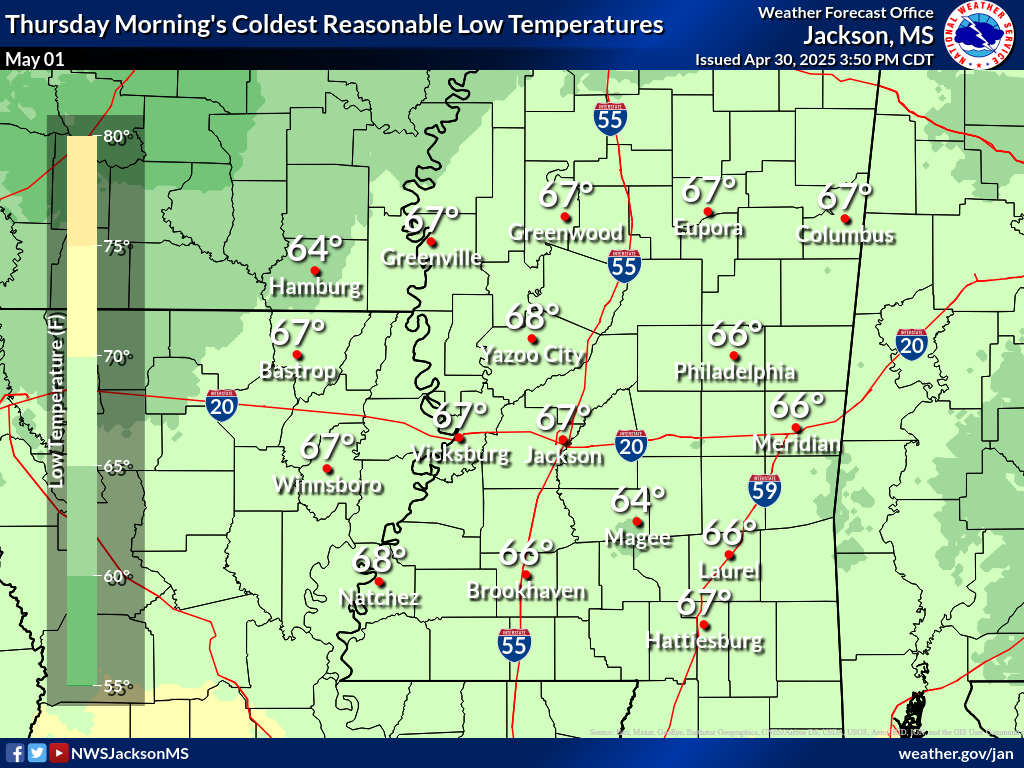
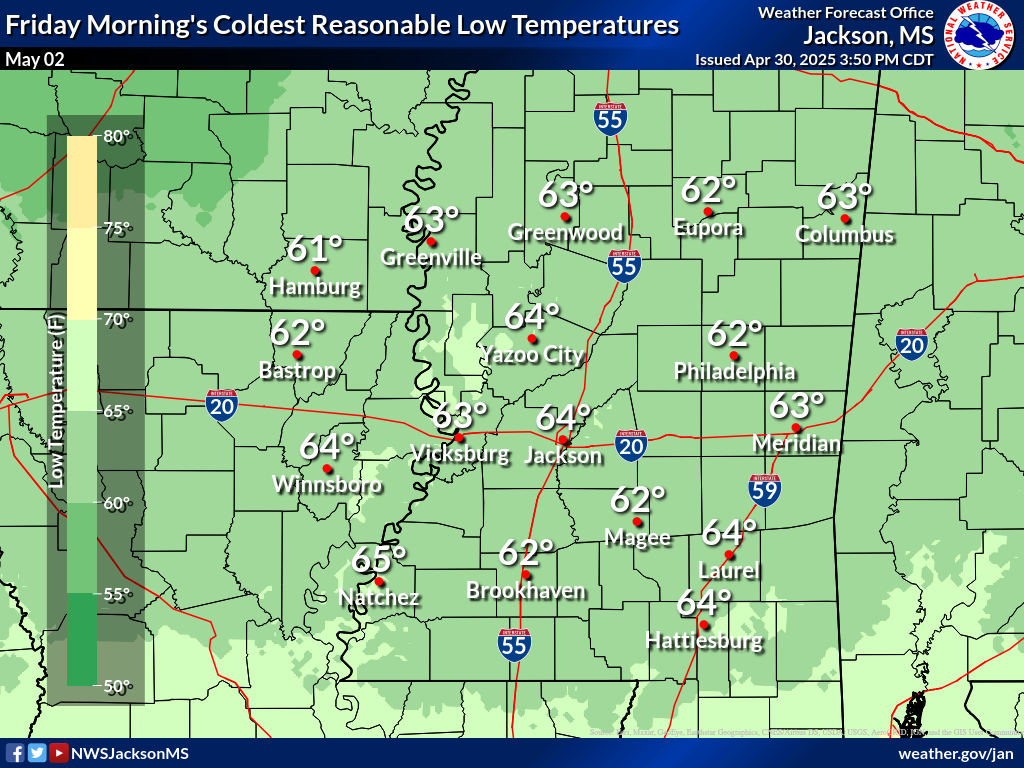
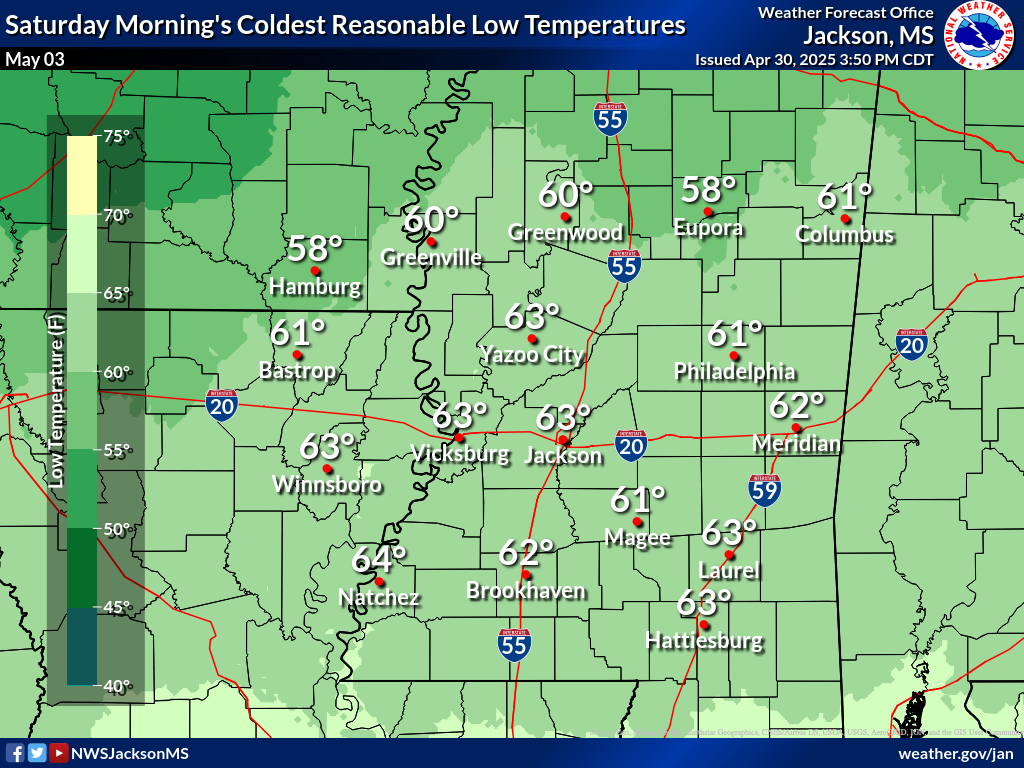
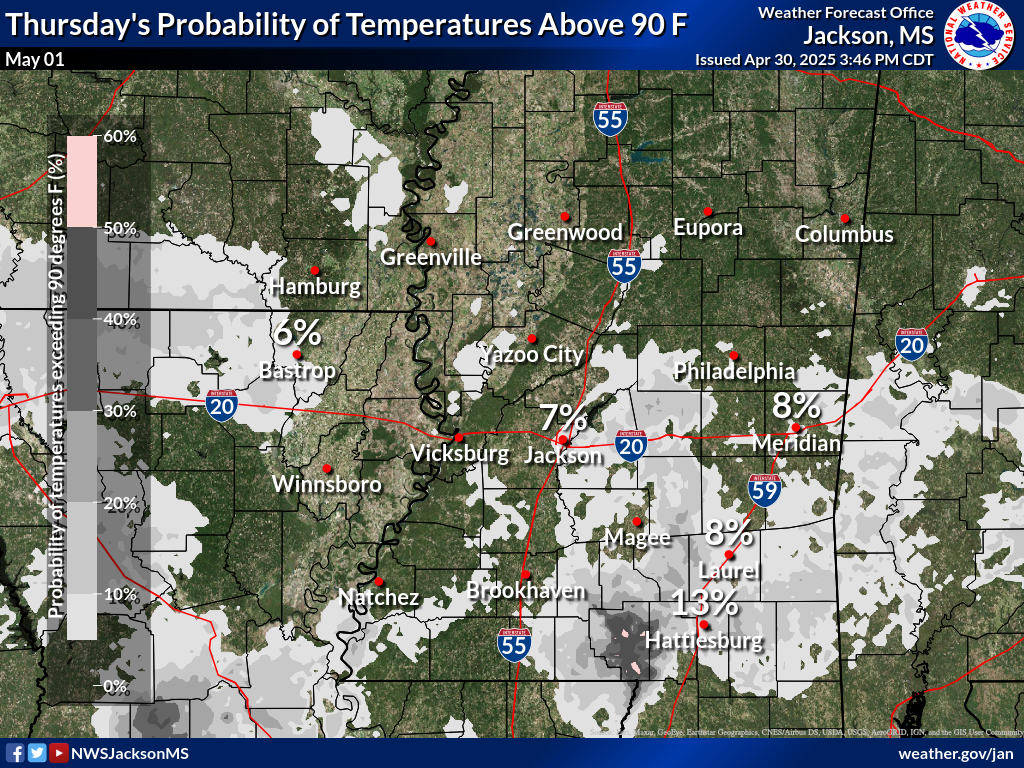
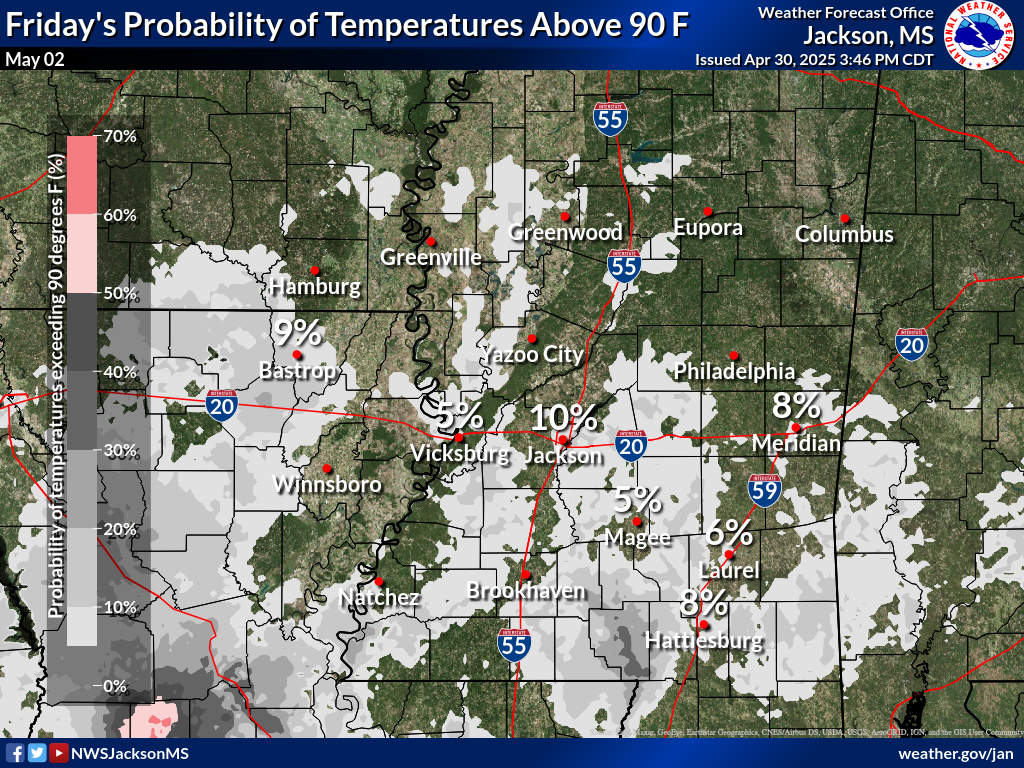
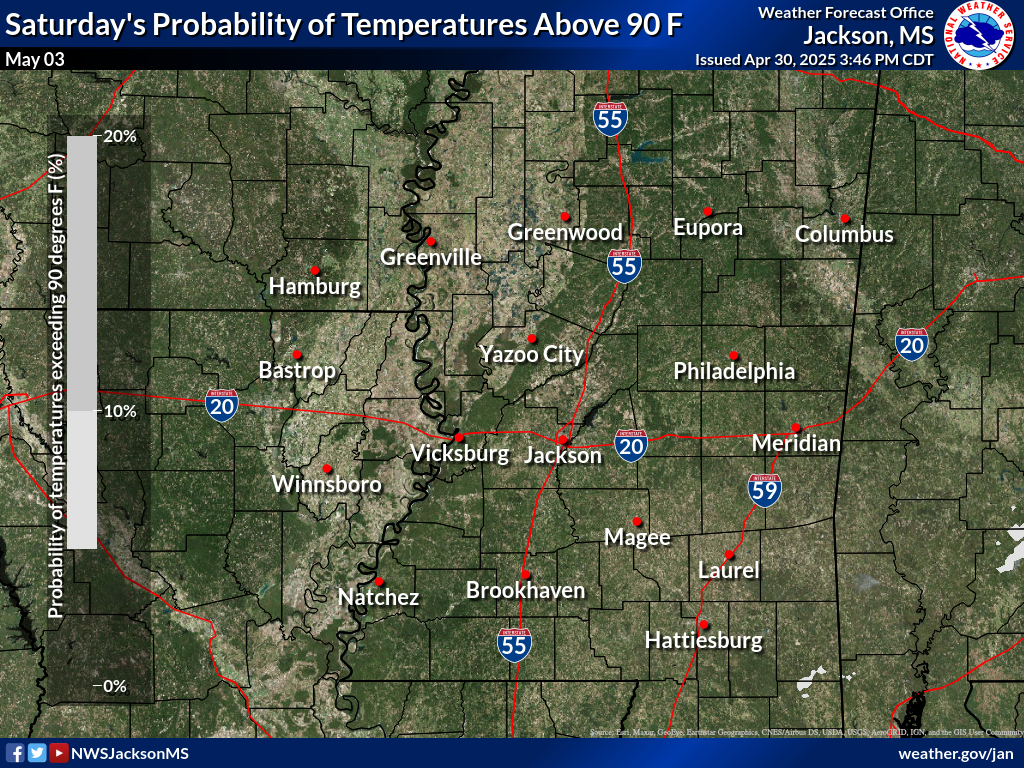
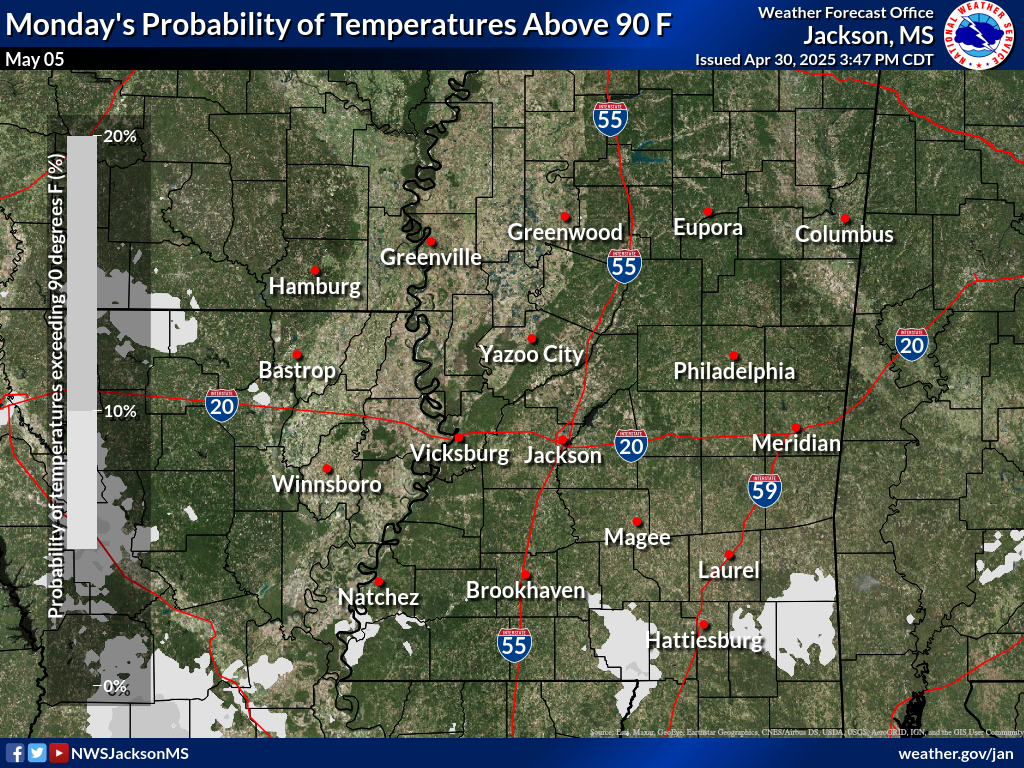
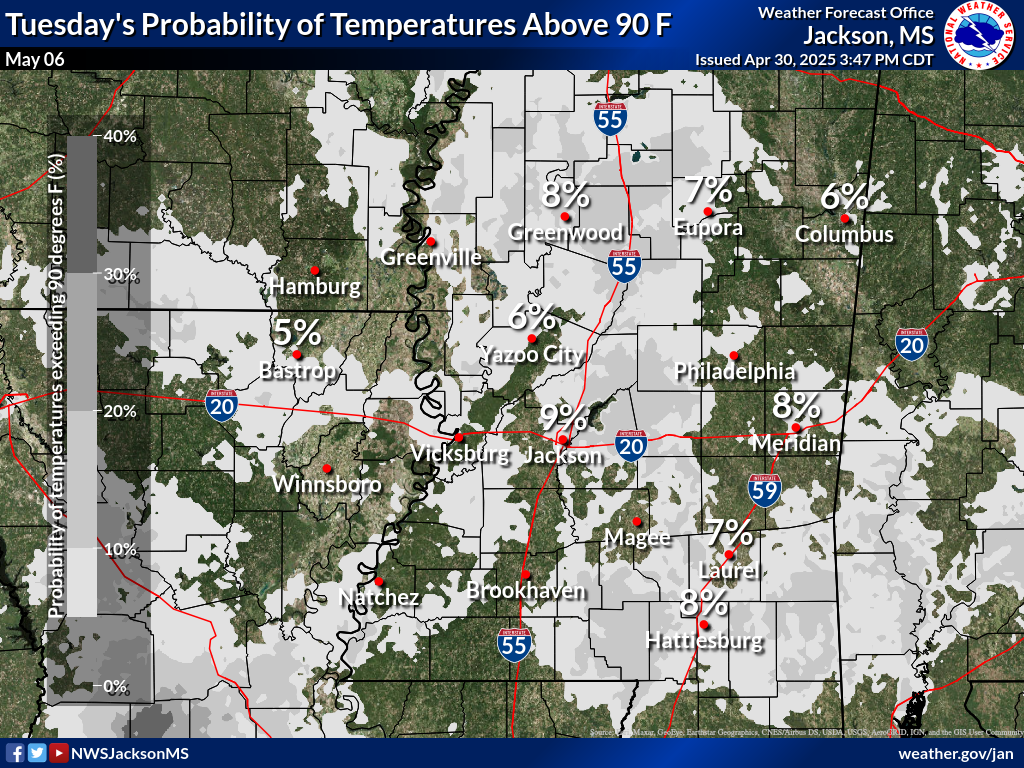
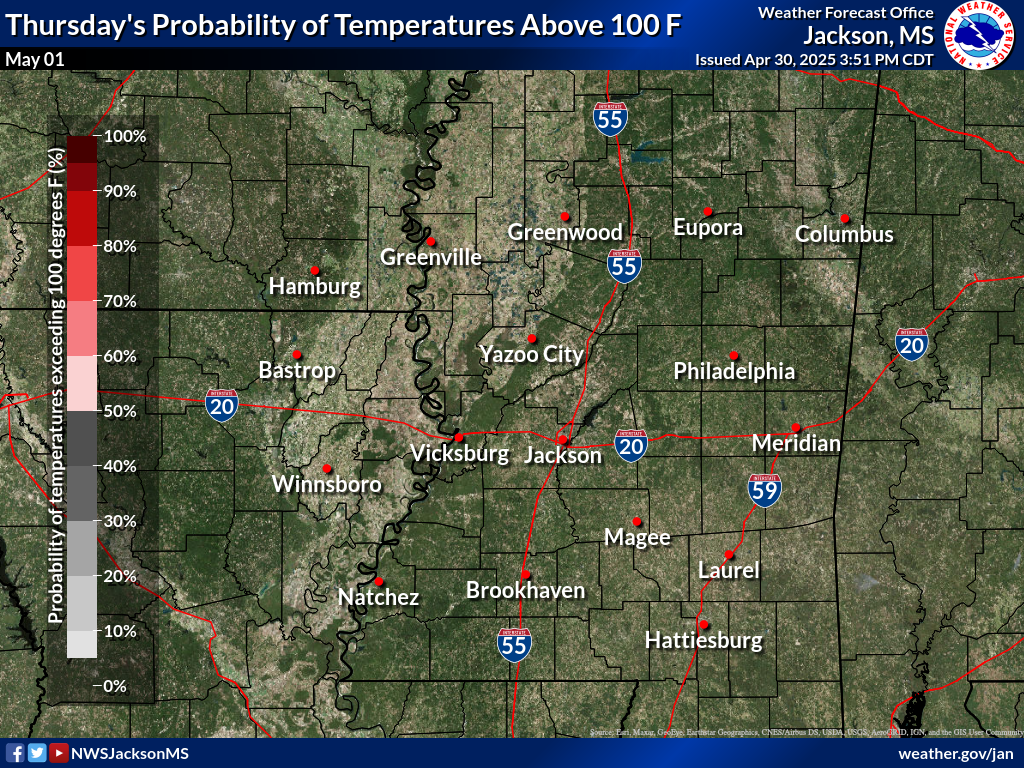
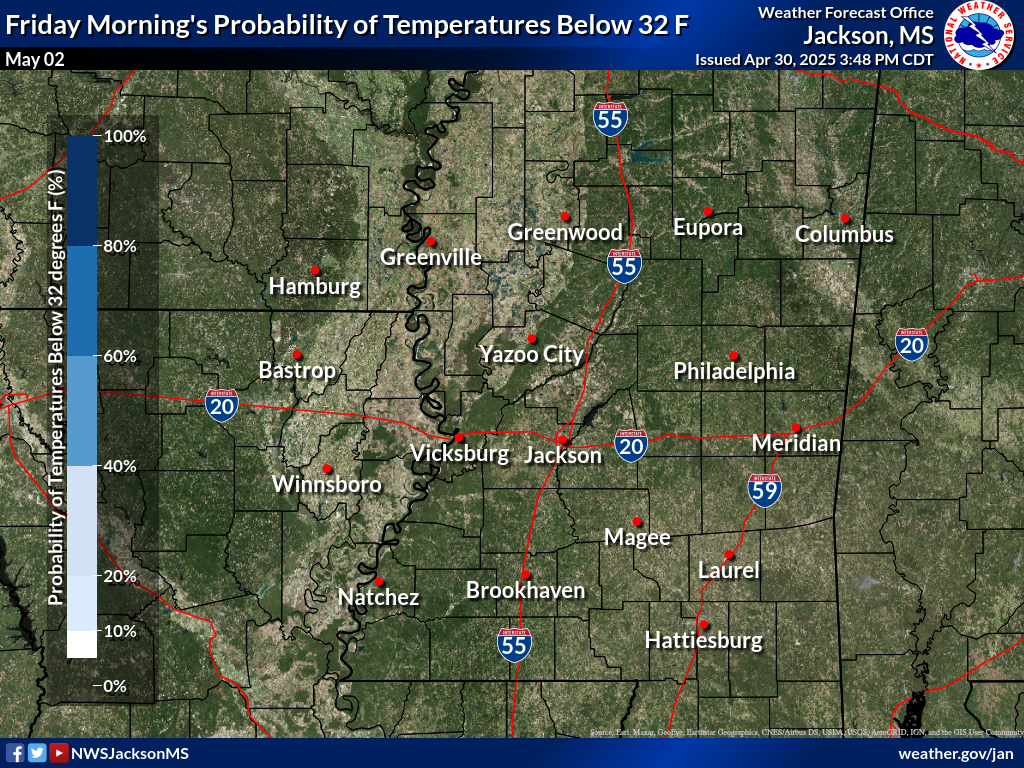
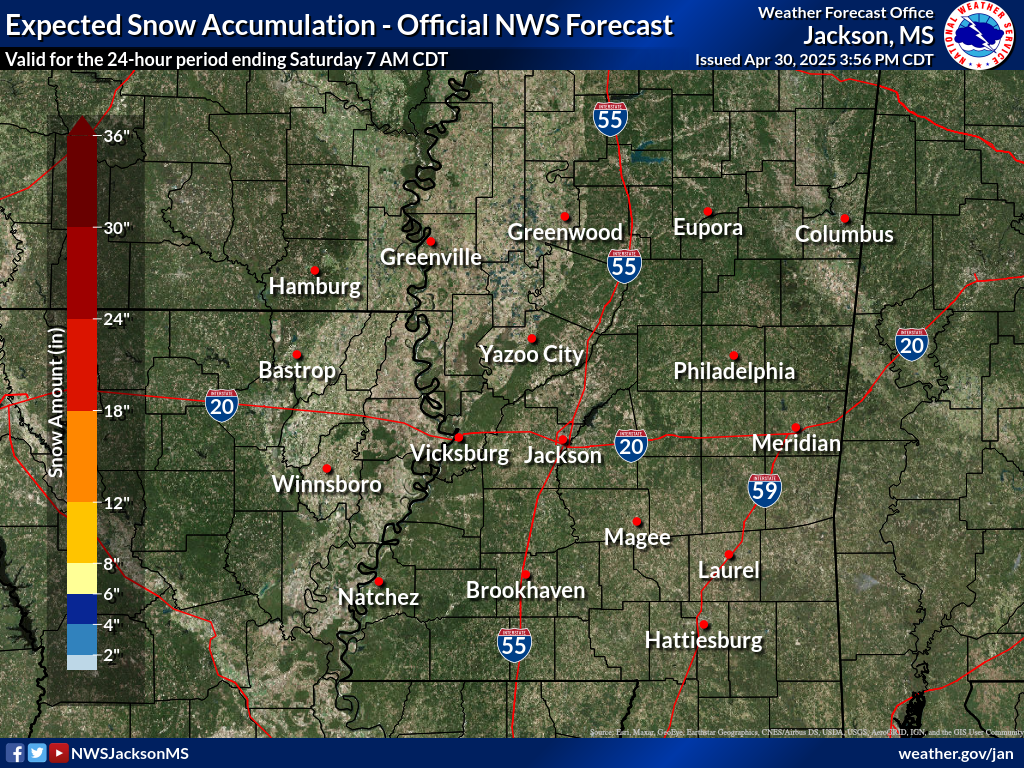
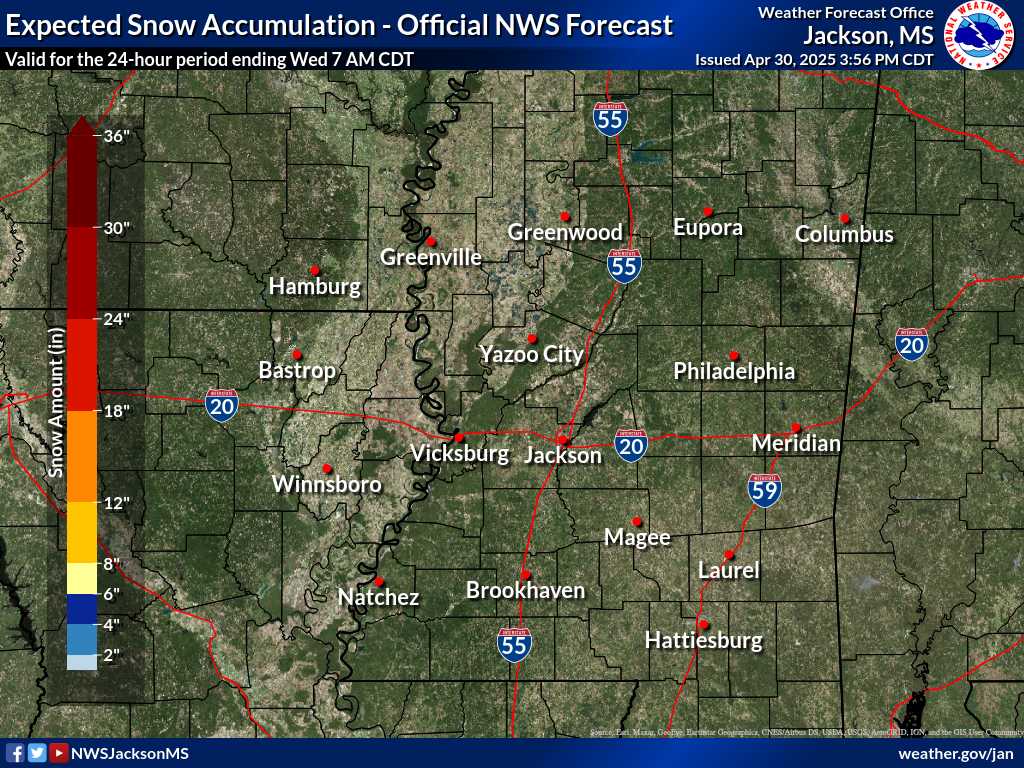
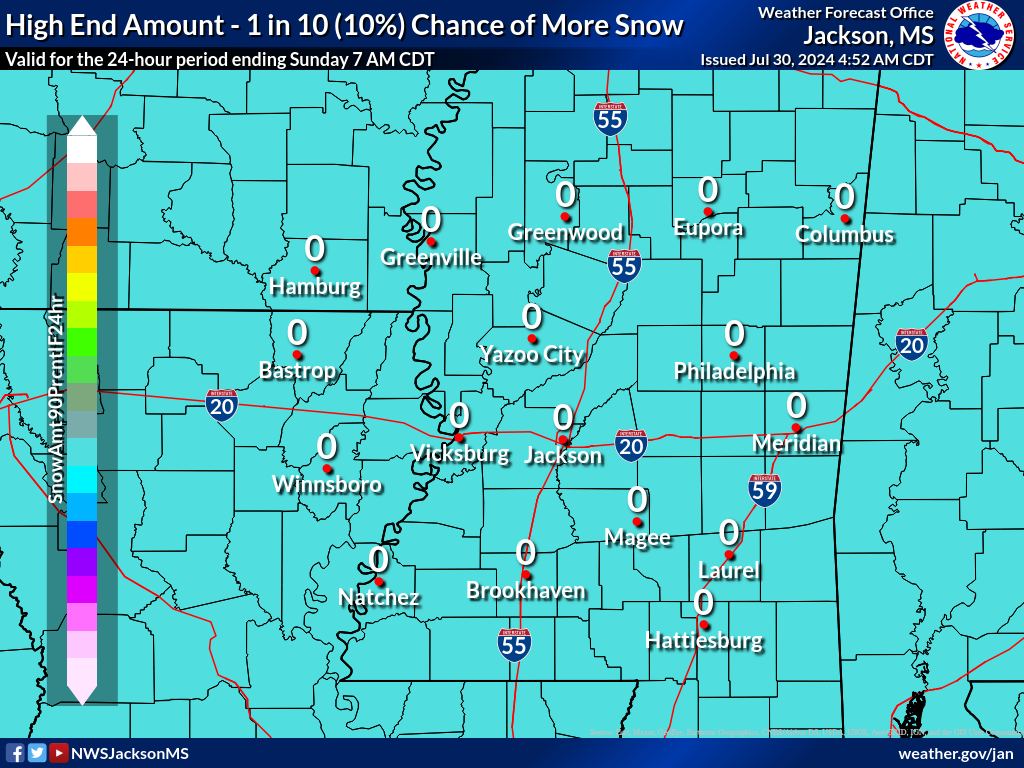
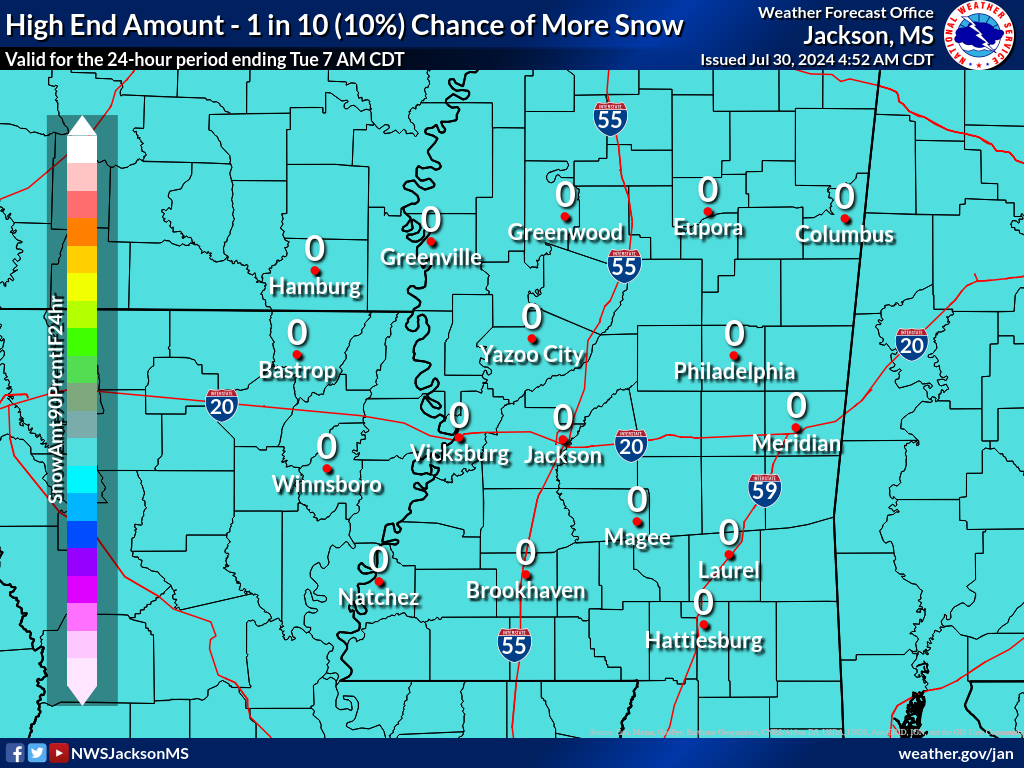
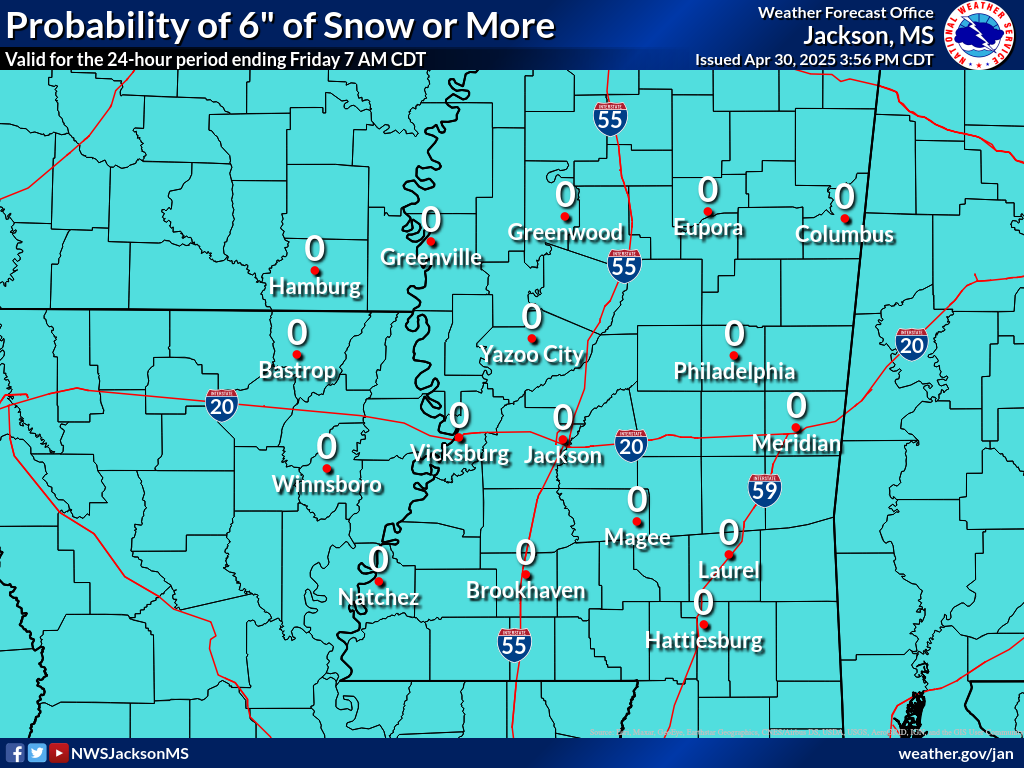
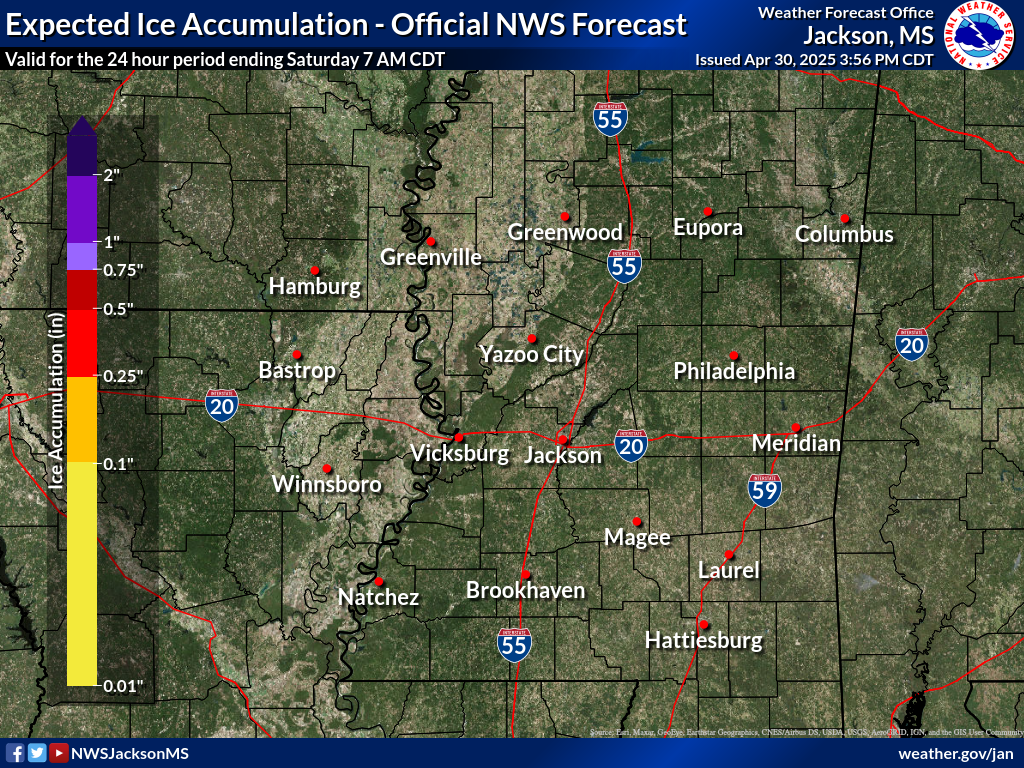
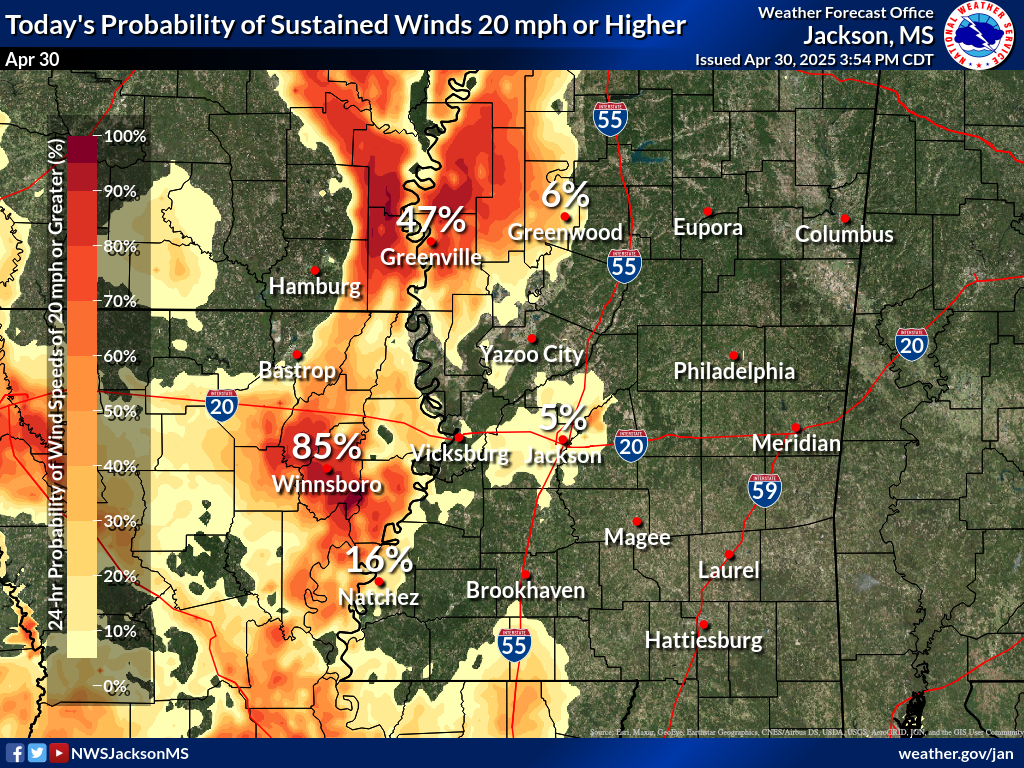
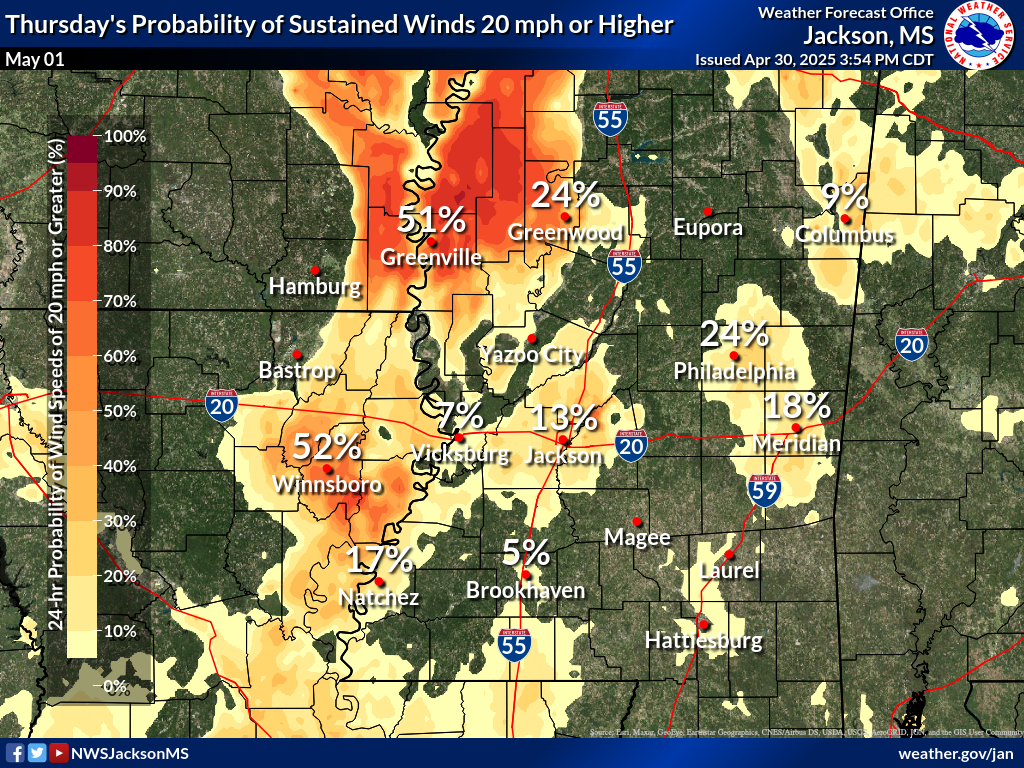
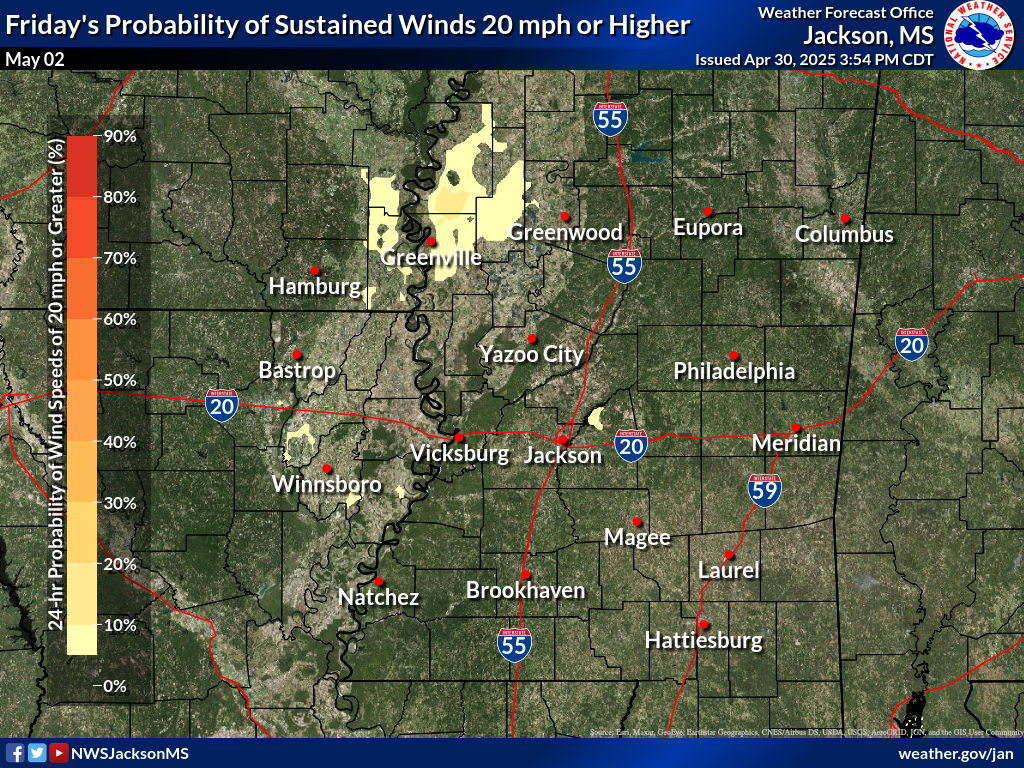
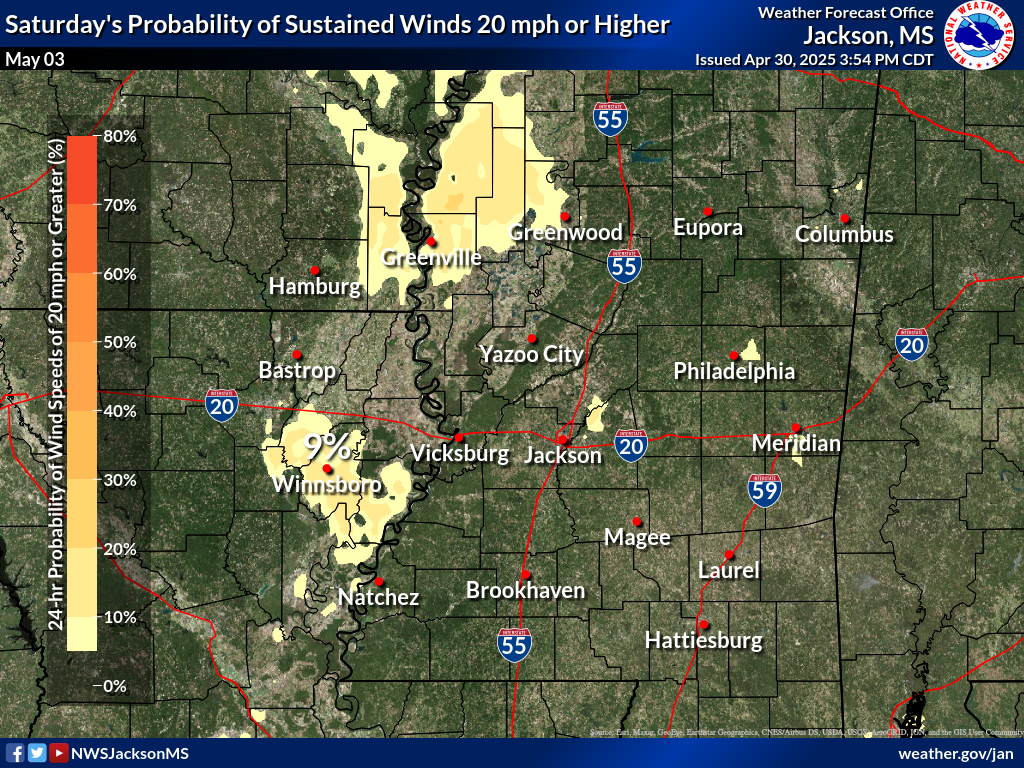
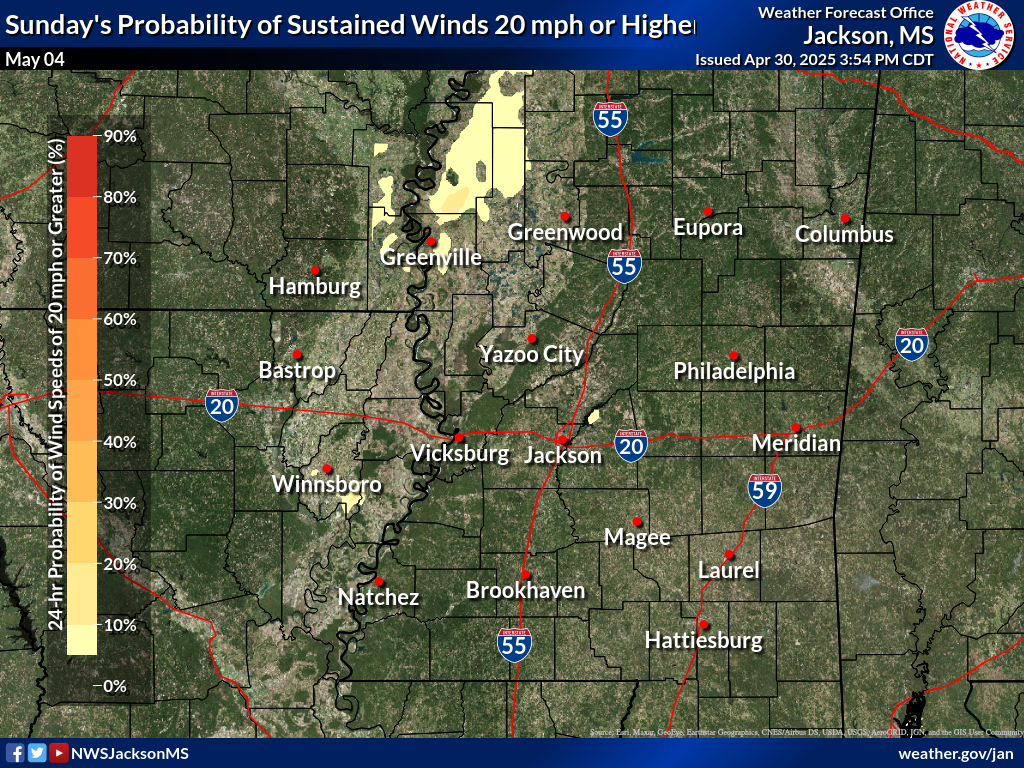
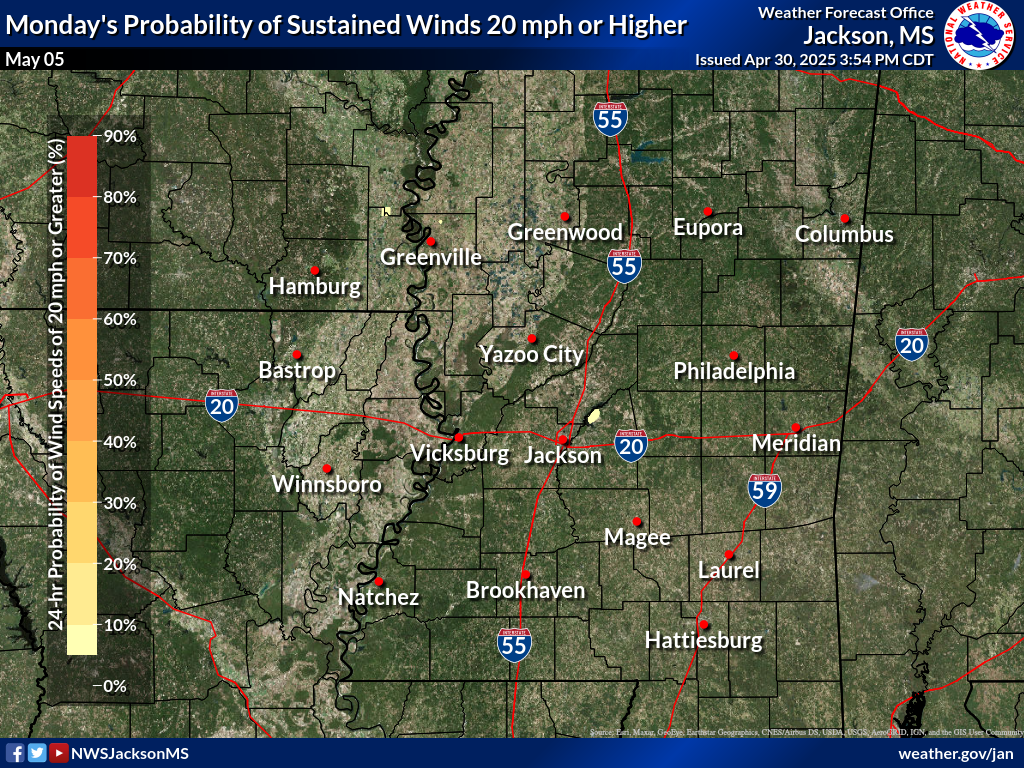
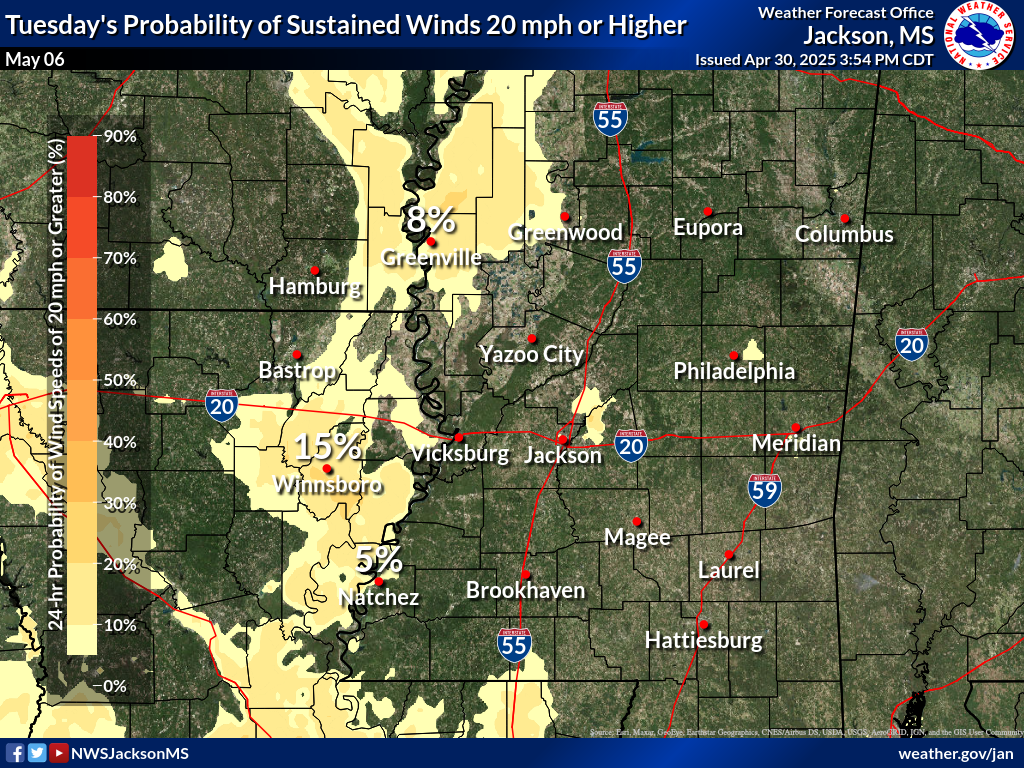
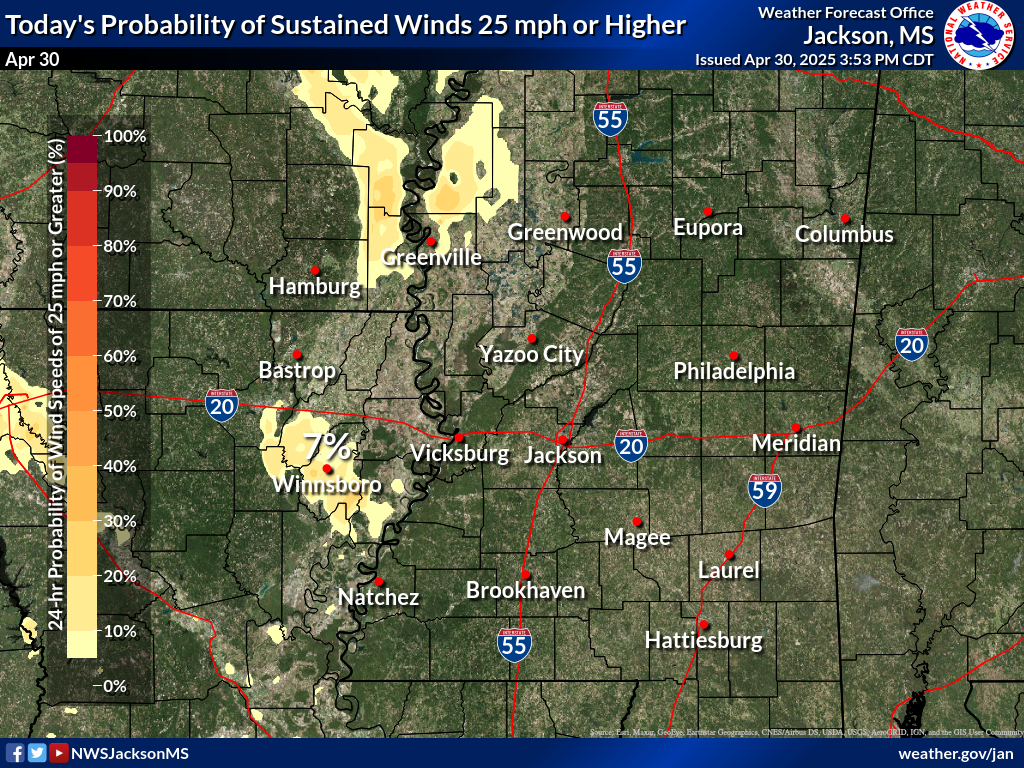
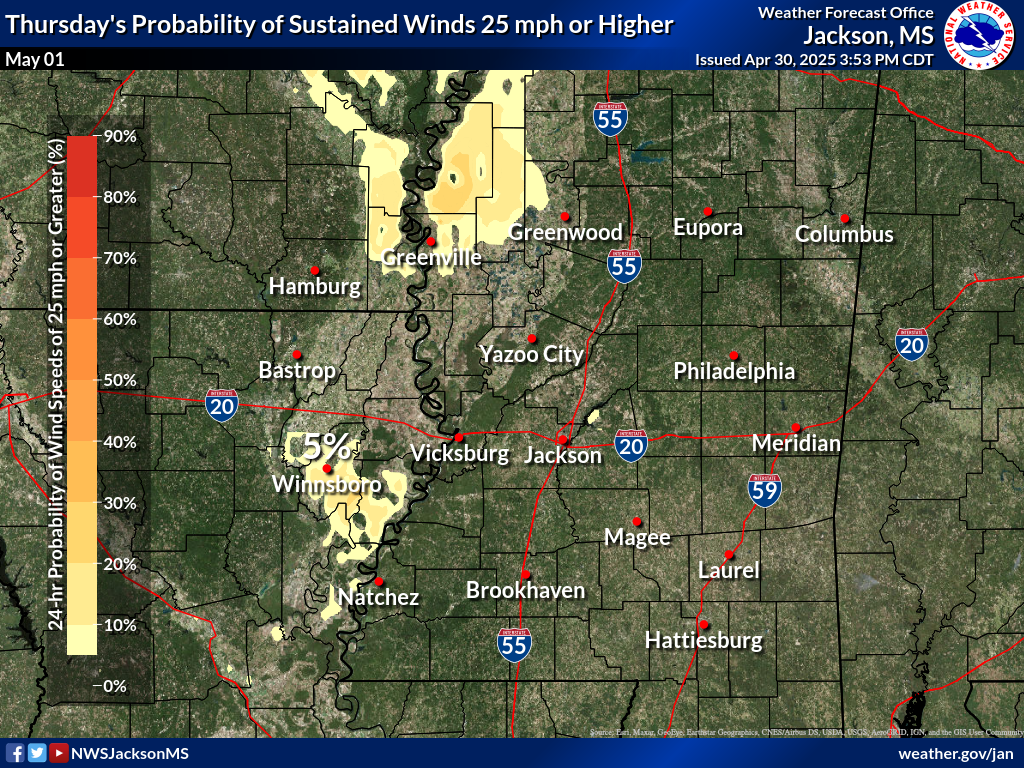
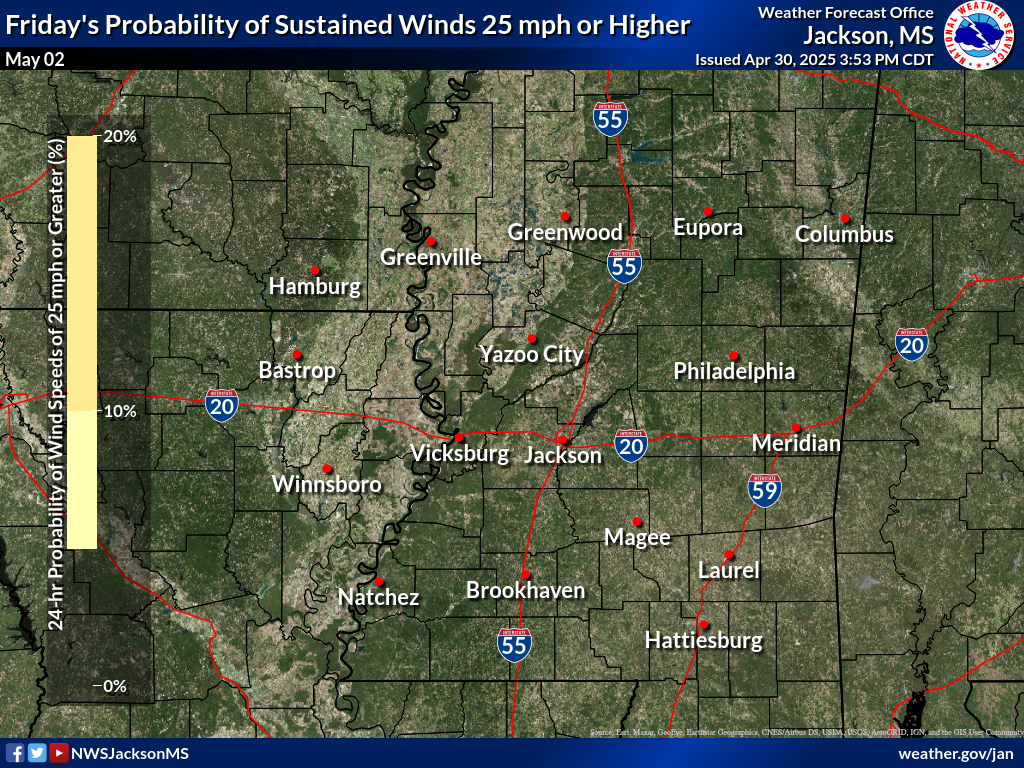
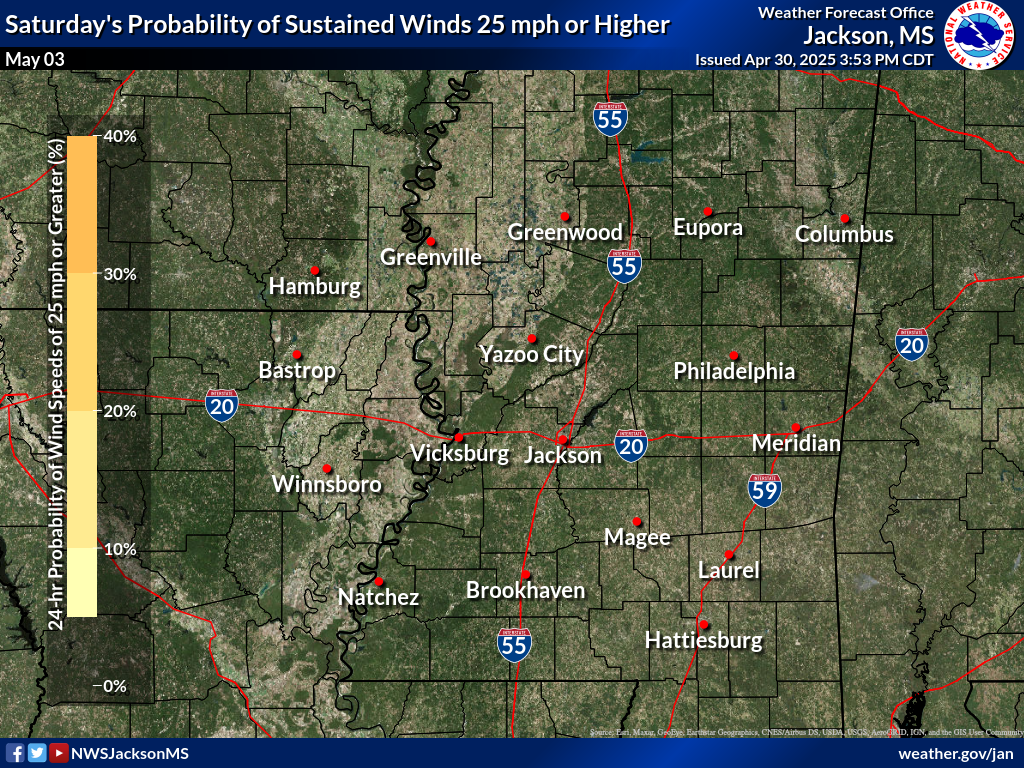
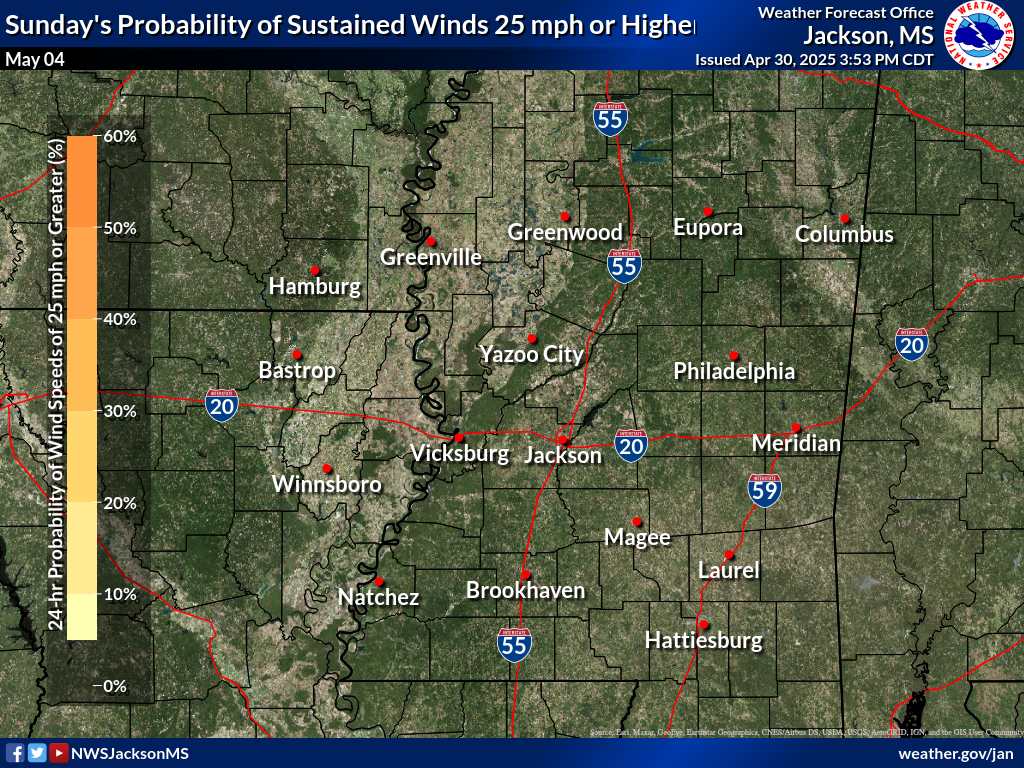
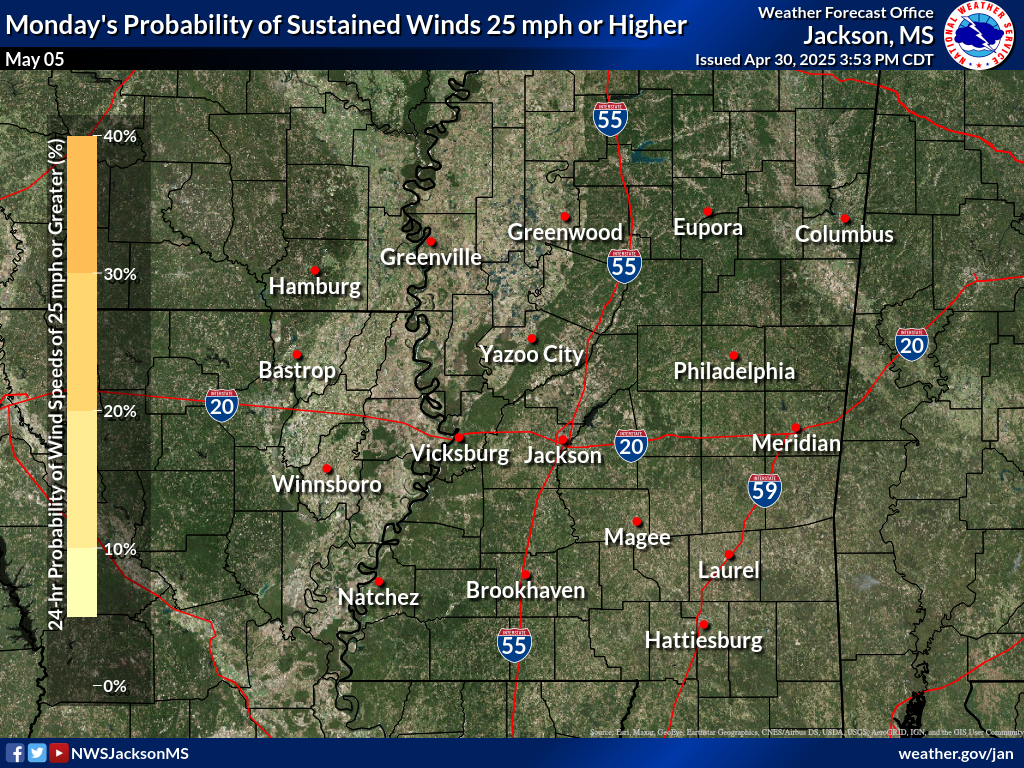
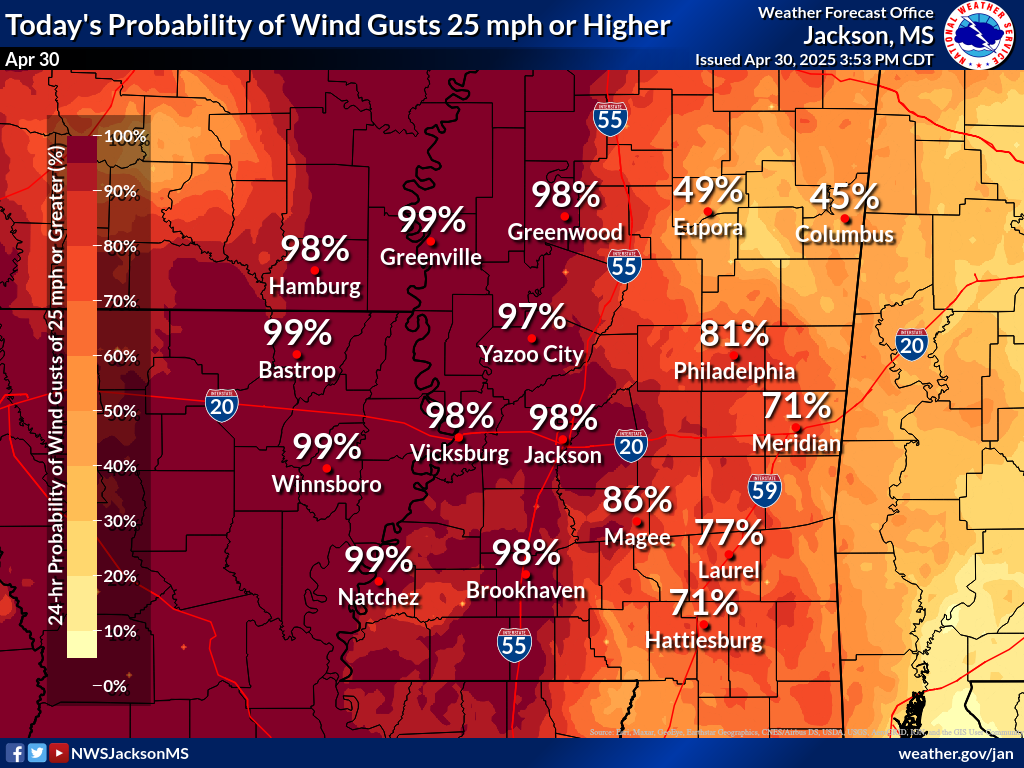
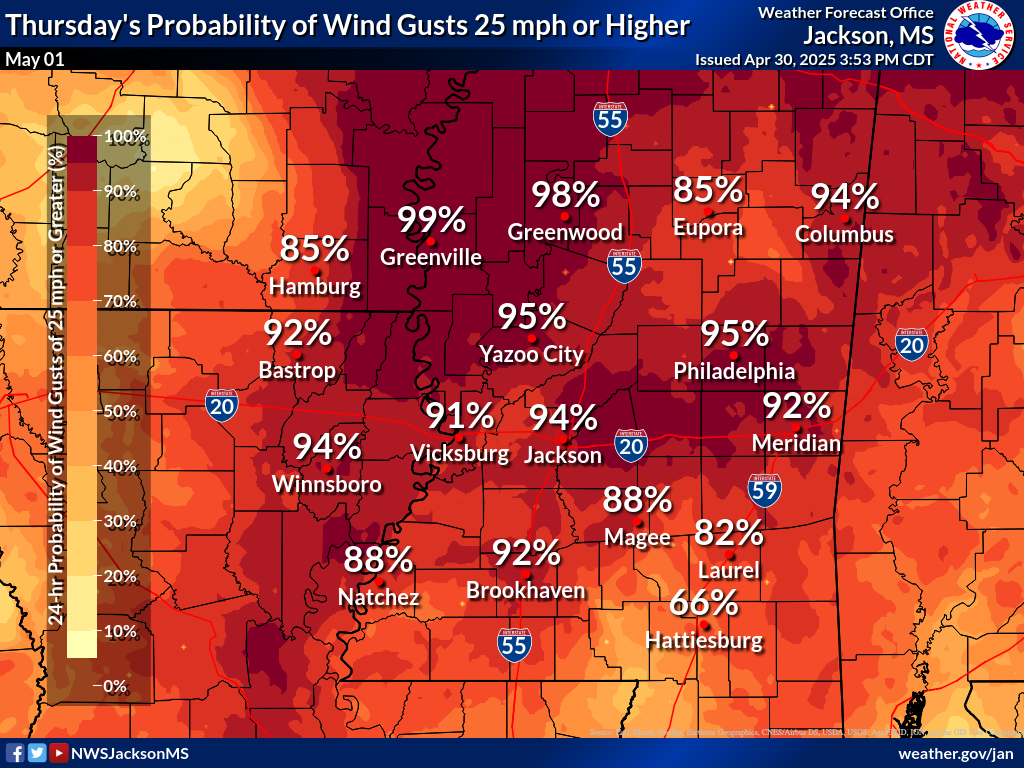
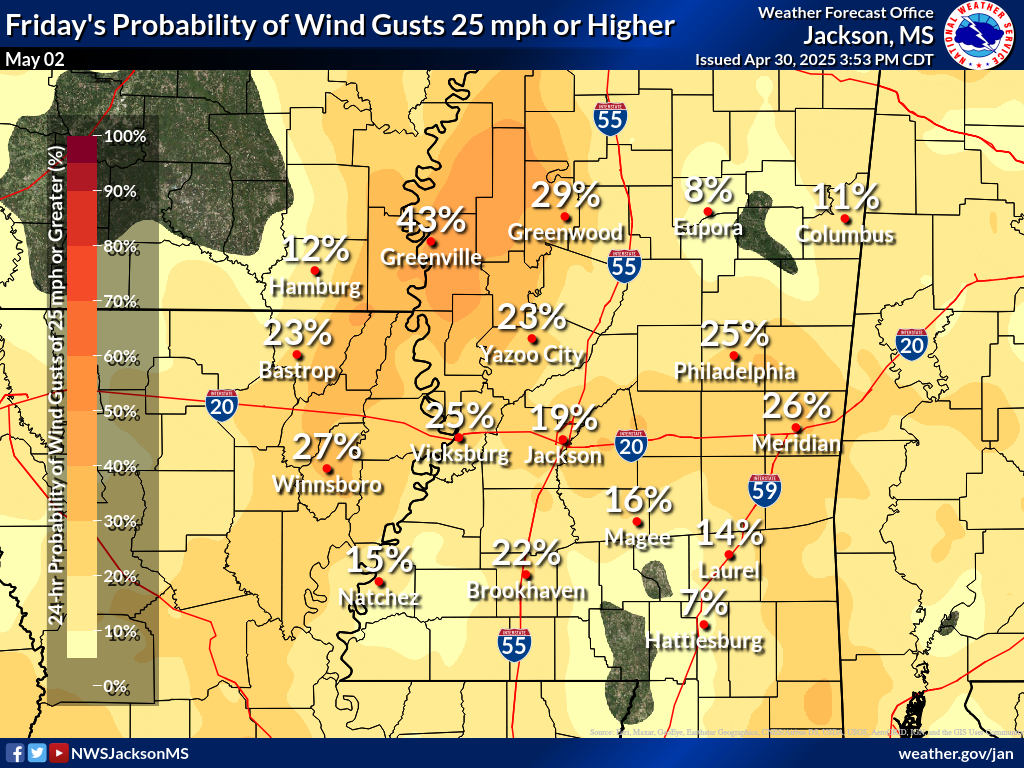
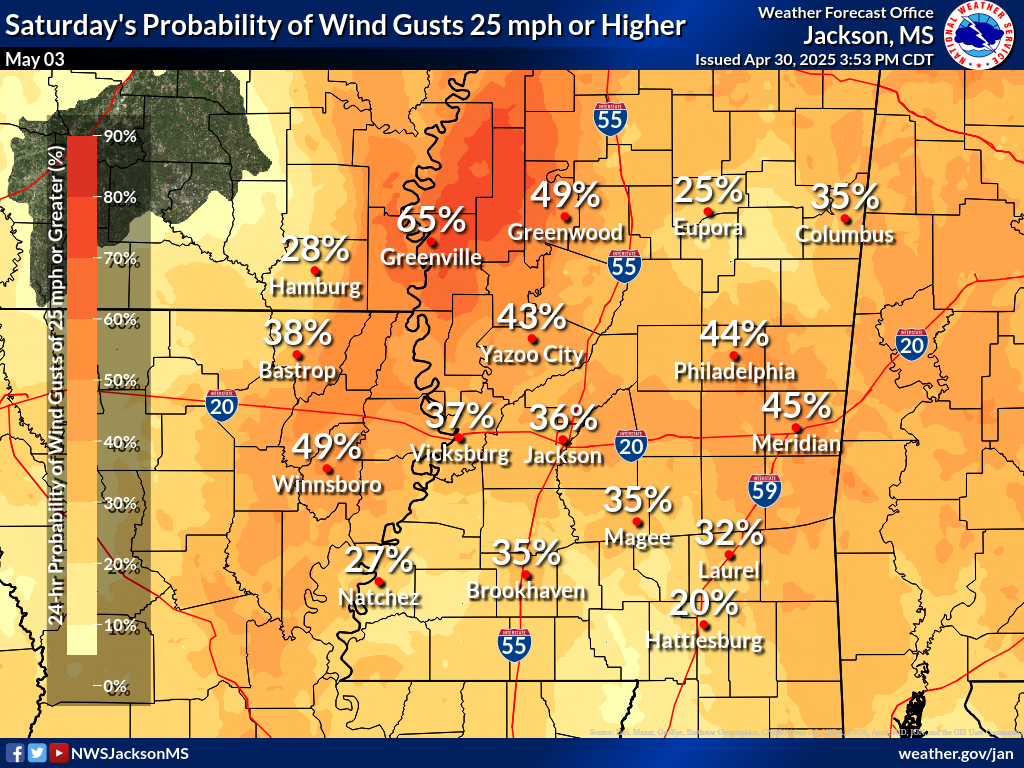
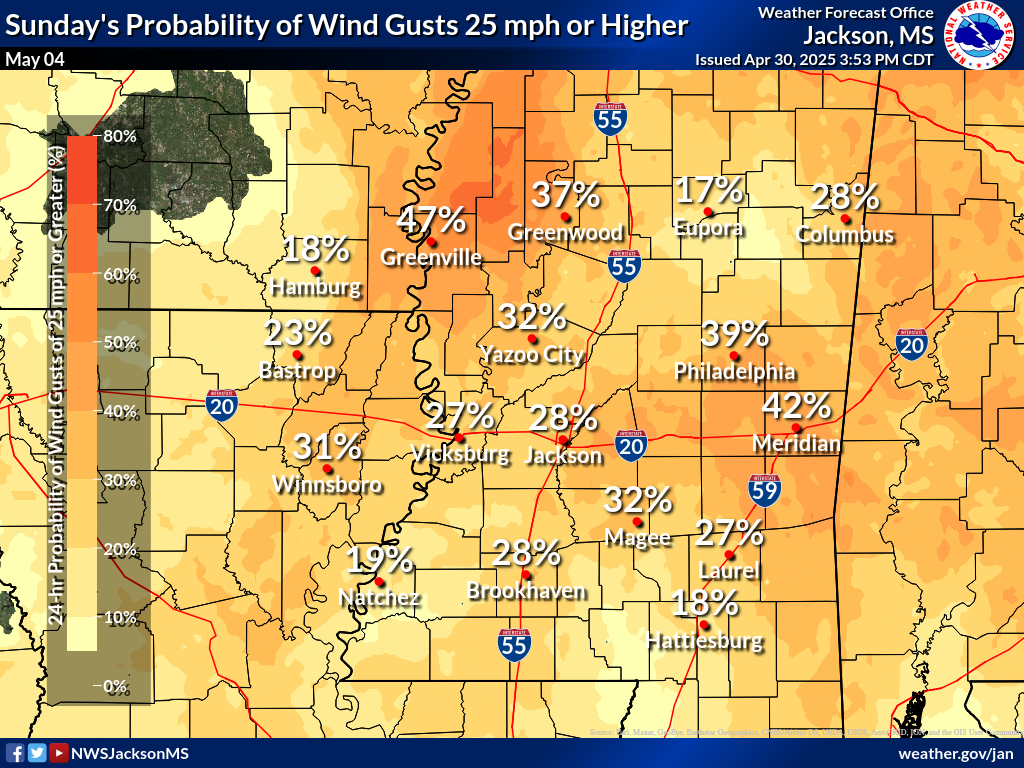
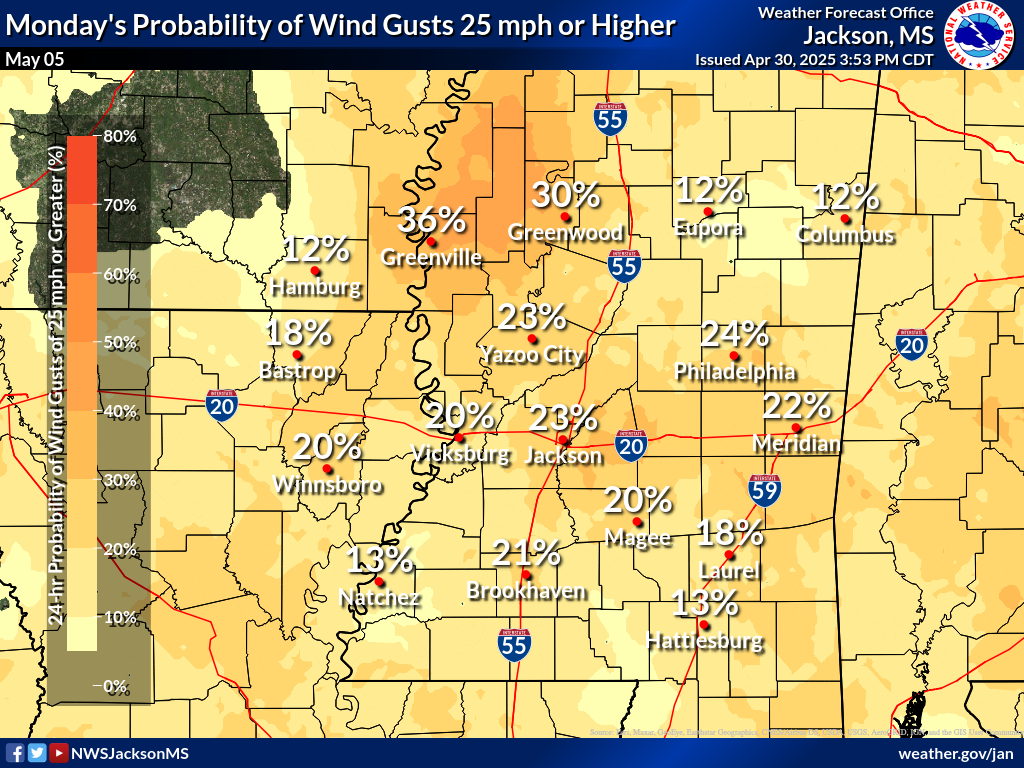
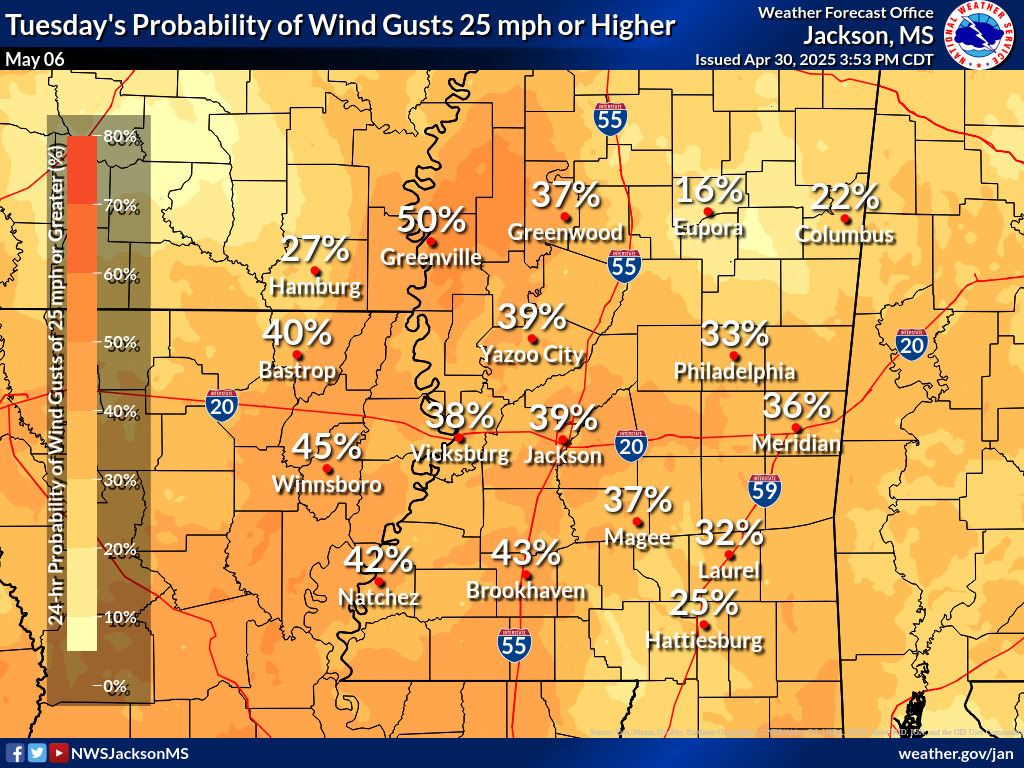
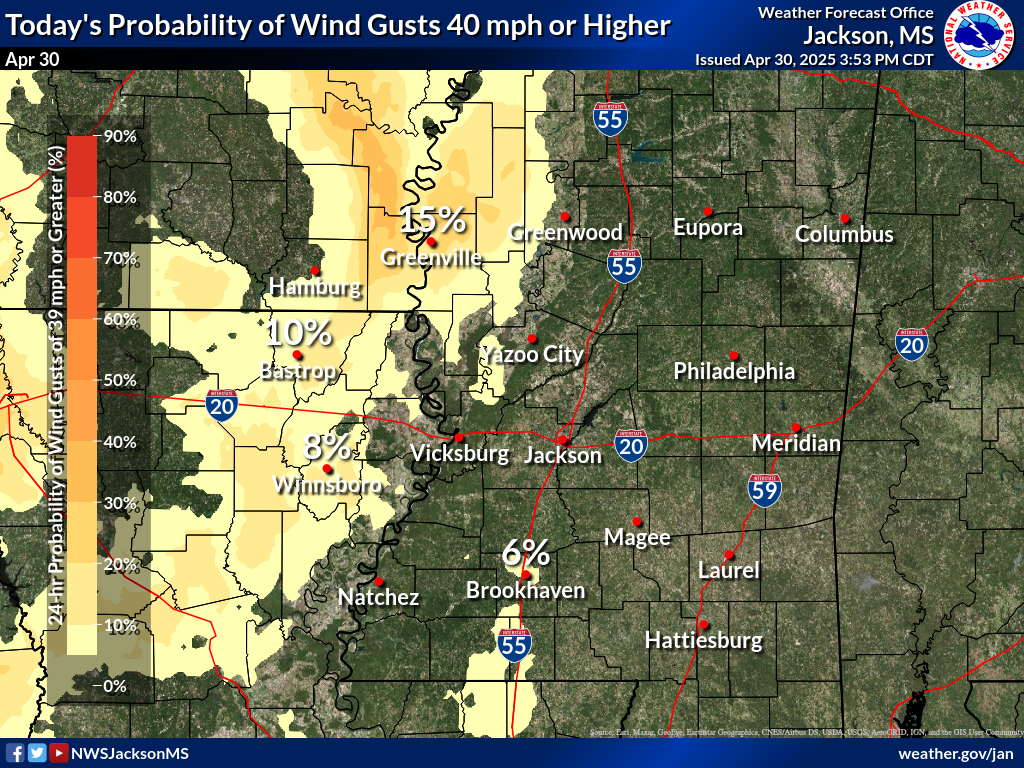
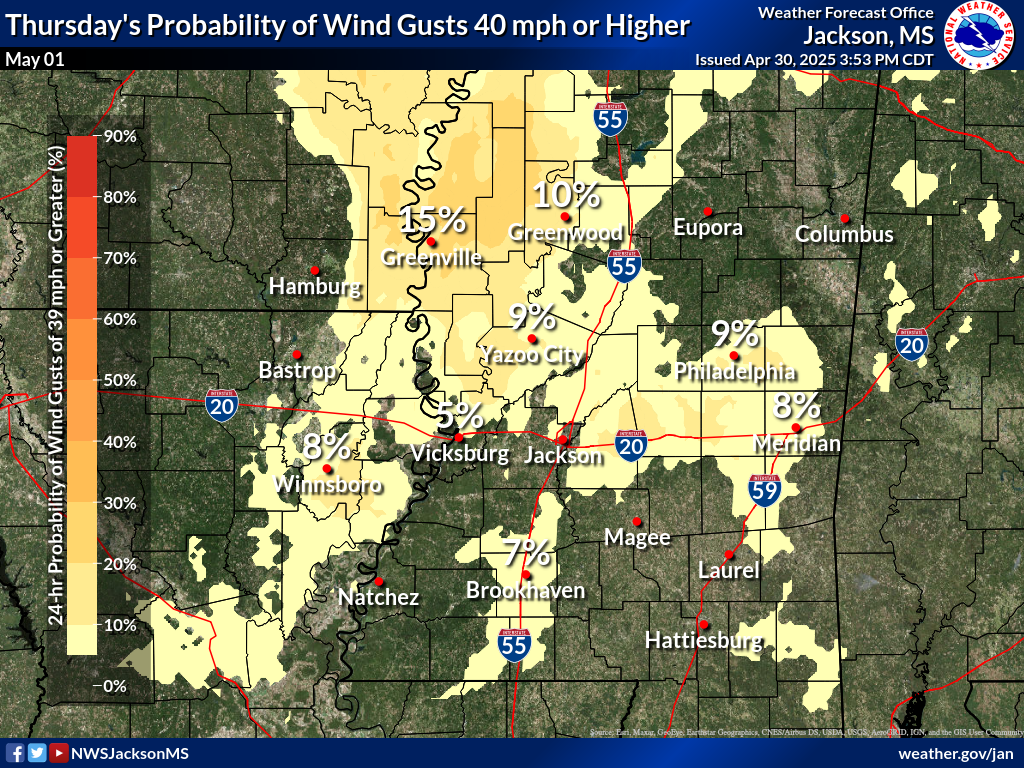
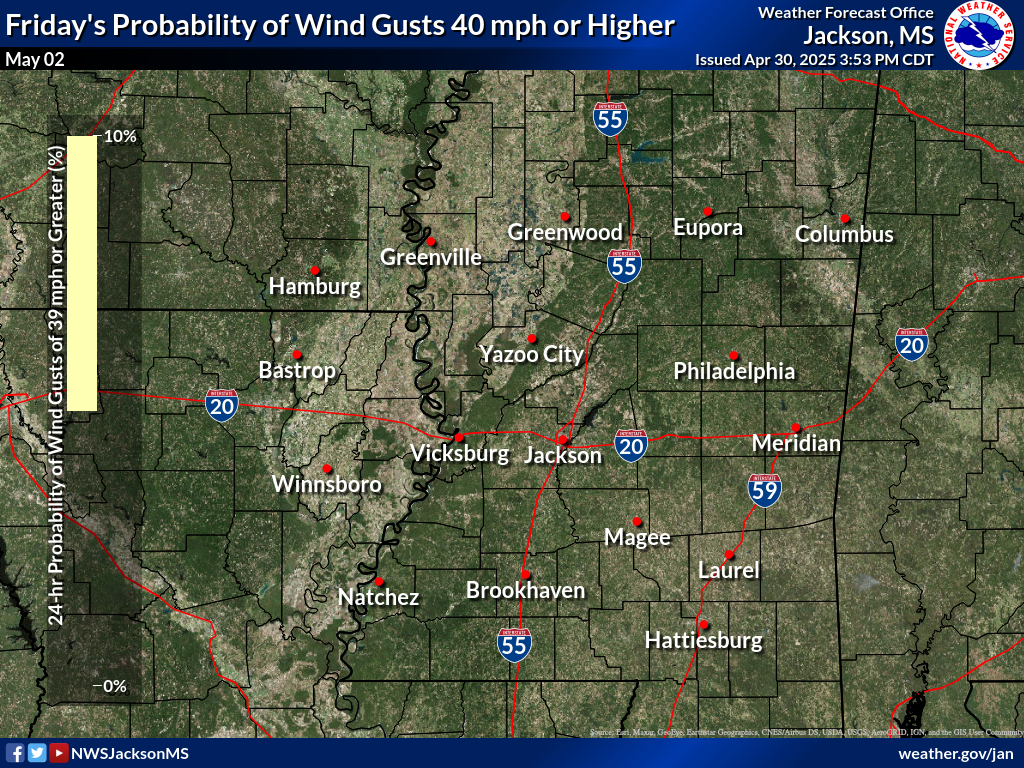
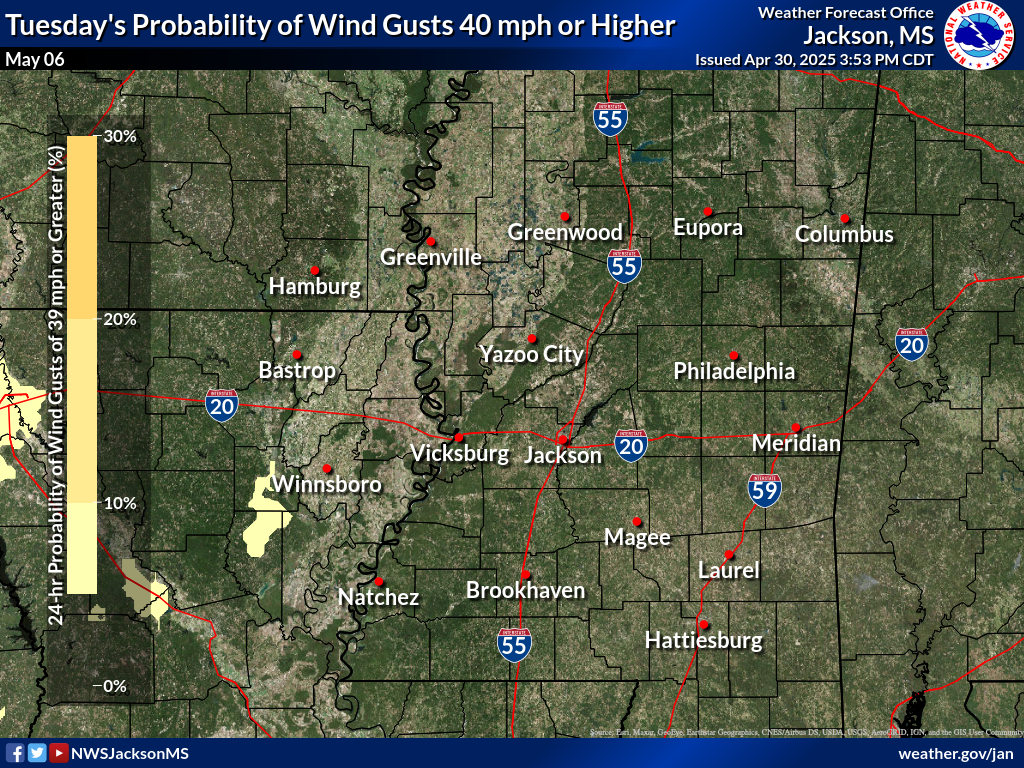
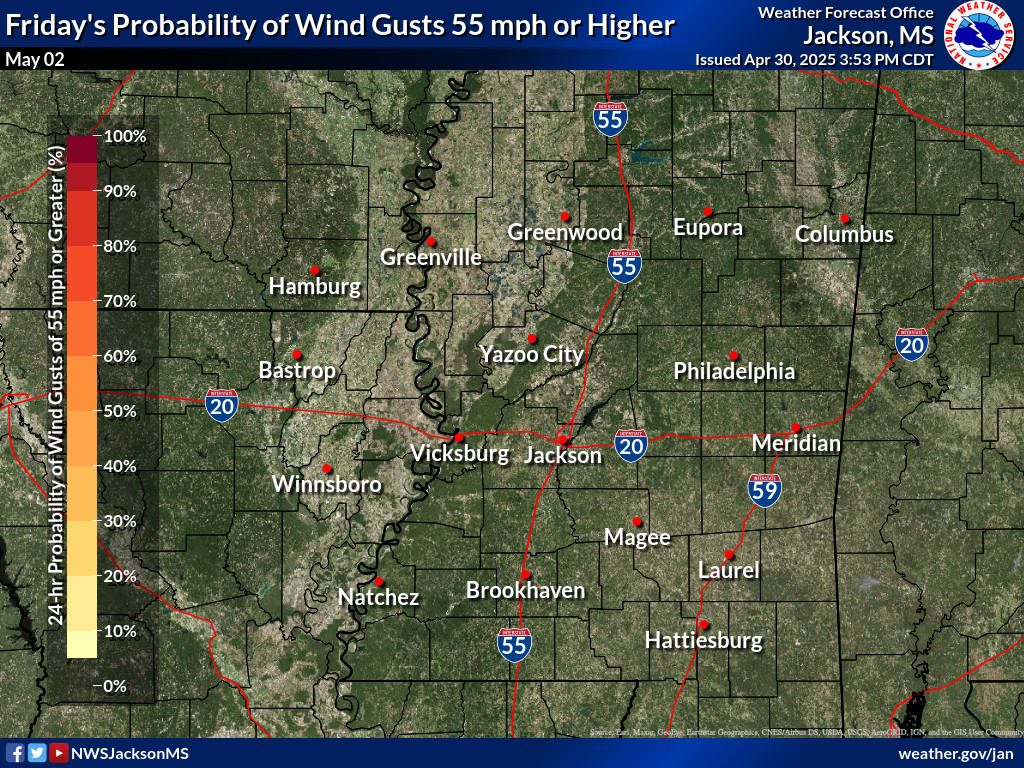
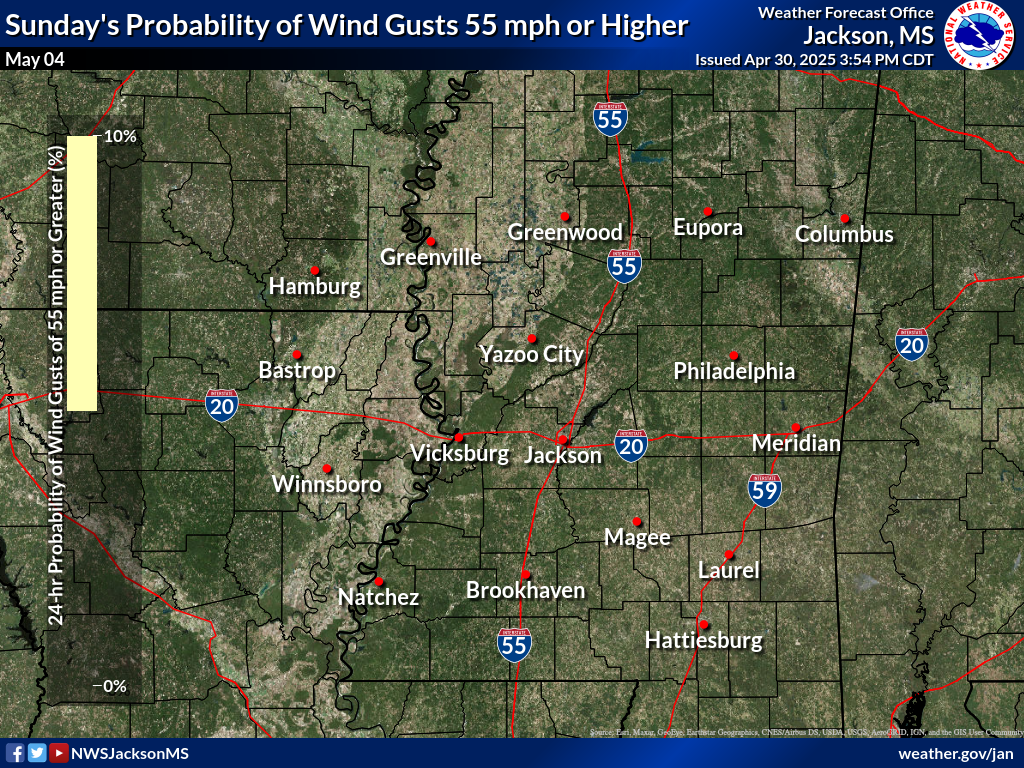
For each weather variable, there is an "Expected", "Highest", and "Lowest" forecast. The "Highest" and "Lowest" graphics represent the range of possibilities for the specified time frame. The "Expected" forecast represents the forecast made by NWS Jackson meteorologists and represents the most likely outcome. For example, if the if the Highest High Temperature at a location is 49, the Lowest High Temperature is 44, and the Expected High Temperature is 47, that means the high temperature will almost certainly be between 44 and 49, and the most likely high temperature will be 47. When the range between "Highest" and "Lowest" is small, forecast confidence is relatively high, and when the range is large, forecast confidence is lower.
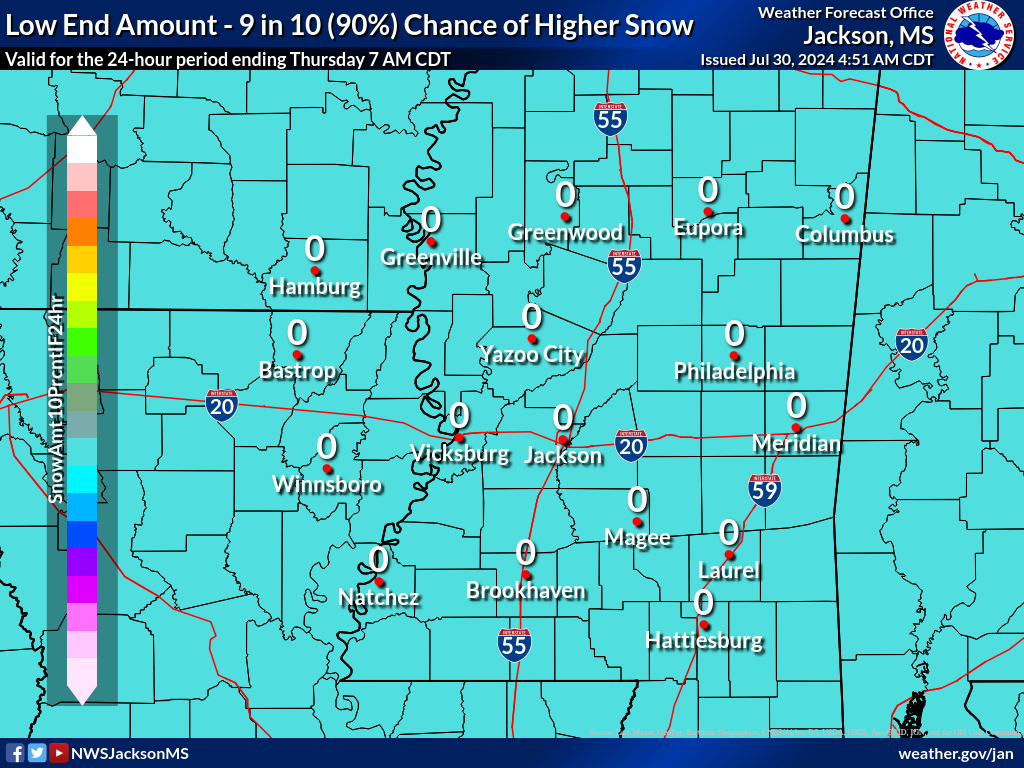
The "Lowest" forecast is derived from the NBM 10th percentile forecast, for which there is a 90% chance the actual value will end up being higher at that location. The "Highest" is derived from the NBM 90th percentile, for which there is a 90% chance the actual value will end up being lower at that location.


 Follow us on YouTube