El Niño and La Niña
An El Niño and La Niña are temporary changes in the climate of the Pacific Ocean. They can be seen in measurements of the sea surface temperature in the region around the equator. Although the changes in sea temperatures may seem small, they can have huge effects on the world's climate.
El Niño was originally recognized by fishermen off the coast of South America as the appearance of unusually warm water in the Pacific Ocean, occurring near the beginning of the year. El Niño means The Little Boy or Christ Child in Spanish. This name was used for the tendency of the phenomenon to arrive around Christmas.
La Niña is essentially the opposite of El Niño. The name La Niña ("the girl child") was coined to represent the opposite of El Niño ("the boy child"). The terms El Viejo and anti-El Niño are also used.
What is the El Niño/Southern Oscillation (ENSO)?
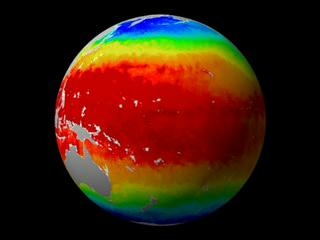
Maps of water temperatures during El Niño and La Niña episodes
Why are El Niño and La Niña typically strongest during the winter and early spring?
How do El Niño and La Niña affect weather patterns in the United States?
How do El Niño and La Niña affect weather in the Lower Mississippi River Valley?
How do El Niño and La Niña affect the Atlantic hurricane season?
How do El Niño and La Niña affect tornado activity in the Southeast United States?
In normal, non-El Niño conditions, the trade winds blow towards the west across the tropical Pacific. Warmer water near the surface of the ocean, heated by the sun, is blown to the west by the trade winds. Warmer water "piles up" in the west Pacific (the sea surface is about one and one half feet higher at Indonesia than at Ecuador) as cooler water rises from deep in the ocean in the east Pacific to replace the water that was moved away by the winds. The sea surface temperature is about 8 degrees C higher in the west, with cooler temperatures in the east Pacific due to upwelling of colder water from deep in the ocean. Rainfall develops much more frequently in rising air over warm water so normal rainfall amounts are higher over the west Pacific and the east Pacific area is relatively dry.
During El Niño, the trade winds relax in the Pacific. This leads to warmer water temperatures in the eastern and, especially, central Pacific because upwelling is reduced. As the pool of warmer water moves eastward, the areas of best rainfall development also move to the east, with associated flooding in Peru and drought in Indonesia and Australia. The eastward displacement of this heat source (the warmest water) results in large changes in the global atmospheric circulation, which in turn forces changes in weather in regions far removed from the tropical Pacific.
El Niño episodes typically occur every 3 to 5 years. However, this interval has varied from 2 to 7 years. They typically last 9 to 18 months. El Niño episodes tend to develop from March to June and reach peak intensity during the December to April period, weakening from May to July. Prolonged El Niño episodes have lasted 2 years and even as long as 3 to 4 years. Every El Niño is somewhat different in magnitude and in duration.
La Niña, also called El Viejo, is essentially the opposite of El Niño. La Niña exists when cooler than usual ocean temperatures occur in the eastern Pacific. La Niña occurs almost as often as El Niño, as the two are stages of the same larger phenomenon.
Stronger than usual trade winds, which blow from east to west across the Pacific Ocean, define La Niña. As warmer water near the surface of the ocean is blown to the west, cooler water rises from deep in the ocean in the east Pacific to replace water that was moved away. The colder water cools the overlying air which hampers the formation of clouds and tropical thunderstorms in central and eastern areas of the Pacific Ocean. This suppression of rain-producing clouds leads to dry conditions from near the International Date Line east to South America.
La Niña is characterized by unusually cold ocean temperatures in the equatorial Pacific, as compared to El Niño, which is characterized by unusually warm ocean temperatures in the equatorial Pacific.
La Niña episodes typically occur every 3 to 5 years. However, this interval has varied from 2 to 7 years. La Niña episodes typically last 1 to 3 years. They tend to develop from March to June and reach peak intensity during the December to April period, weakening from May to July.
What is the El Niño/Southern Oscillation (ENSO)?
El Niño and La Niña are abnormal episodes of warming or cooling of surface ocean waters in the eastern tropical Pacific. The fluctuations in ocean temperatures during El Niño and La Niña are accompanied by even larger-scale fluctuations in air pressure between the western and eastern tropical Pacific. The Southern Oscillation is the see-saw pattern of reversing surface air pressure between the eastern and western tropical Pacific. When the surface pressure is high in the eastern tropical Pacific it is low in the western tropical Pacific, and vice-versa. Because the ocean warming and pressure reversals are, for the most part, simultaneous, scientists call this phenomenon the El Niño/Southern Oscillation, or ENSO for short.
When the waters of the eastern Pacific are abnormally warm (an El Niño event) sea level pressure drops in the eastern Pacific and rises in the west. The reduction in the pressure gradient is accompanied by a weakening of the low-latitude easterly trades. These pressure departures are reversed during La Niña, which features below-average air pressure over Indonesia and the western tropical Pacific and above-average air pressure over the eastern Pacific.
The Southern Oscillation Index (SOI) is designed to measure the strength and phase of the Southern Oscillation. The SOI is calculated using departures from normal in the surface air pressure difference between Tahiti, French Polynesia and Darwin, Australia. These stations are used because of their long data records.
During El Niño episodes the SOI has a large negative value due to lower-than-average air pressure at Tahiti and higher-than-average pressure at Darwin.
During La Niña episodes the SOI has a positive value due to higher-than-average air pressure at Tahiti and lower-than-average pressure at Darwin.
ENSO-neutral refers to periods when neither El Niño nor La Niña is present. These periods often coincide with the transition between El Niño and La Niña events. During ENSO-neutral periods the ocean temperatures, tropical rainfall patterns, and atmospheric winds over the equatorial Pacific Ocean are near the long-term average.
Maps of water temperatures during El Niño and La Niña episodes
In December 1993, the sea surface temperatures and the winds were near normal, with warm water in the western Pacific Ocean (in red on the top panel of the December 1993 plot), and cool water, called the "cold tongue" in the eastern Pacific Ocean (in green and blue on the top panel of the December 1993 plot). The winds in the western Pacific are very weak (see the arrows pointing in the direction the wind is blowing towards), and the winds in the eastern Pacific are blowing towards the west (towards Indonesia). The bottom panel of the December 1993 plot shows anomalies (the way the sea surface temperature and wind differ from a normal December). In this plot, the anomalies are very small (yellow/green), indicating a normal December.
December 1997 was near the peak of a strong El Niño year. In December 1997, the warm water (red in the top panel of the December 1997 plot) has spread from the western Pacific Ocean towards the east (in the direction of South America), the "cold tongue" (green color in the top panel of the December 1997 plot) has weakened, and the winds in the western Pacific, usually weak and towards the west, are blowing strongly towards the east, pushing the warm water eastward.
December 1998 was a strong La Niña (cold) event. The cold tongue (blue) is cooler than usual by about 3° C. The cold La Niña events sometimes (but not always) follow El Niño events.

Why are El Niño and La Niña typically strongest during the winter and early spring?
El Niño and La Niña are typically strongest during the period from December to April because the equatorial Pacific sea-surface temperatures are normally warmest at this time of the year. A slight warming of the waters due to El Niño can result in a major redistribution of tropical convective rainfall, whereas a slight cooling due to La Niña can restrict the tropical convection to Indonesia.
How do El Niño and La Niña affect weather patterns in the United States?
It is important to note that the impacts of ENSO vary depending on the strength of the particular El Niño or La Niña episode.
During winter, El Niño episodes (top map below) feature a strong jet stream and storm track across the southern part of the United States, and less storminess and milder-than-average conditions across the North. This results in an exceptionally stormy winter and increased precipitation across California and the southern U.S. and less stormy conditions across the northern part of the country. Also, there is an enhanced flow of marine air into western North America, along with a reduced northerly flow of cold air from Canada to the United States. These conditions result in a milder than normal winter across the northern states.
It is believed that El Niño may have contributed to the 1993 Mississippi floods and the 1995 California floods. It is also believed that El Niño contributes to a smaller chance of hurricanes in the North Atlantic, sparing Atlantic and Gulf Coast states from the associated storm damage.
La Niña episodes (bottom map below) feature a more northward placement of jet stream flow over the United States and Canada, with colder and stormier than average conditions across the North, and warmer and less stormy conditions across the South. Large portions of central North America experience increased storminess, increased precipitation, and an increased frequency of significant cold-air outbreaks, while the southern states experiences less storminess and precipitation.
Globally, El Niño tends to result in higher than average temps, while La Nina tends to result in lower than average temps.
It is important to note that not all El Niño and La Niña episodes are the same, nor does the atmosphere always react in the same exact way from one El Niño to another. Equatorial Pacific sea surface temperature anomalies do not always directly correlate with typical ENSO conditions, particularly if other environmental indices (such as the Pacific Decadal Oscillation) offset these conditions.
How do El Niño and La Niña affect weather in the Lower Mississippi River Valley?
Again, it is important to note that the impacts of ENSO vary depending on the strength of the particular El Niño or La Niña episode. The North Atlantic Oscillation (NAO), which is forecast on much shorter time scales, generally has a more direct impact on local weather conditions in the colder months than ENSO, as the NAO can counteract typically expected ENSO conditions in some cases.
El Niño episodes generally mean wetter and cooler weather during the winter and spring for the Deep South. During El Niño events, the jet stream is shifted southward and an unusually deep trough builds over the central United States. One significant effect associated with this pattern is cooler than average temperatures over the southeast United States. This pattern also increases the transport of moisture from the Gulf of America, which results in wetter than normal conditions over the Gulf Coast states.
During La Niña cycles, the jet lifts farther north across the Great Lakes. As a result, the Deep South experiences drier and warmer conditions than would normally be expected.
The connections between El Niño/La Niña events and tornado development are not clear cut but preliminary research indicates that La Niña corresponds to an especially active phase for tornadoes over the Deep South with a relatively high frequency of cold-season outbreaks of F2 or stronger tornadoes.
El Niño events generally suppress Atlantic hurricane activity with fewer hurricanes than normal in the Atlantic basin during the peak of Atlantic hurricane season, often sparing the Gulf Coast states from hurricanes and their associated destruction. La Niña tends to increase the number of hurricanes that develop and allows stronger hurricanes to form.
(These maps show the percent increase of an extreme cold or warm season or extreme dry or wet season over what would be expected normally.)
JANUARY-MARCH APRIL-JUNE
JULY-SEPTEMBER OCTOBER-DECEMBER
Likelihood of an extreme cold or warm season during an El Niño event
JANUARY-MARCH APRIL-JUNE

JULY-SEPTEMBER OCTOBER-DECEMBER
Likelihood of an extreme wet or dry season during a La Niña event
JANUARY-MARCH APRIL-JUNE
JULY-SEPTEMBER OCTOBER-DECEMBER
Likelihood of an extreme cold or warm season during a La Niña event
JANUARY-MARCH APRIL-JUNE
JULY-SEPTEMBER OCTOBER-DECEMBER
REGIONAL SEASONAL PRECIPITATION AND TEMPERATURE VARIATIONS
How do El Niño and La Niña affect the Atlantic hurricane season?
The change in winds with height is referred to as vertical wind shear. Hurricane formation requires that winds be fairly uniform throughout the atmosphere. In other words, hurricanes cannot form if the vertical wind shear is too high.
El Niño produces stronger westerly wind at upper levels of the atmosphere across the tropical Atlantic than in normal non-El Niño seasons. This increases the total vertical wind shear, basically shearing the tops from developing storms before a healthy circulation can form. El Niño events generally suppress Atlantic hurricane activity so fewer hurricanes than normal form in the Atlantic during August to October, the peak of Atlantic hurricane season.
During La Niña, westerly winds high in the atmosphere weaken. This results in an expanded area of low vertical wind shear, allowing more Atlantic hurricanes to develop during La Niña events. La Niña increases the number of hurricanes that develop and allows stronger hurricanes to form.
The chances for the continental U.S. and the Caribbean Islands to experience a hurricane increase substantially during La Niña and decrease during El Niño.
El Niño and La Niña also influence where Atlantic hurricanes form. During La Niña, more hurricanes form in the deep Tropics from weather disturbances that originate over North Africa. These systems have a much greater likelihood of becoming major hurricanes, and of eventually reaching the U.S. and the Caribbean Islands.
The incidence of hurricanes is higher during the neutral phase (when neither El Niño nor La Niña are in effect) than during El Niño. Although hurricanes occur more often during La Niña episodes, significant tropical weather events have occurred during the neutral phase. For example, the record shattering 2005 hurricane season that included Katrina and Rita occurred during the neutral phase. Hurricane Andrew, the most destructive United States hurricane of record, made landfall along the Gulf coast during a neutral phase of the El Niño/Southern Oscillation in 1992.
How do El Niño and La Niña affect tornado activity in the Southeast United States?
The connections between El Niño/La Niña events and tornado development over the Deep South are not clear cut. However, preliminary research indicates a relationship between ENSO and the occurrence of strong to violent tornado outbreaks over the Southeast United States. In the case of F2 and greater tornadoes, more appear to occur during La Niña months. La Niña seasons are normally associated with warmer than average temperatures in the South, producing a sharper frontal zone between warmer air and the normally cold arctic air to the north. During this time, Deep South weather is more unstable, setting the stage for more tornadoes. A study of the top 15 tornadic outbreaks (at least 40 tornadoes) showed that only one outbreak occurred during an El Niño event. Six occurred during a La Niña event, while the remaining eight occurred during neutral ENSO years.
Click here for the current El Niño status and forecast from the National Weather Service Climate Prediction Center.
Click here for the monthly El Niño/Southern Oscillation (ENSO) Diagnostic Discussion from the National Weather Service Climate Prediction Center.

