|
Weather Review - June 26, 2009 |
 |
|
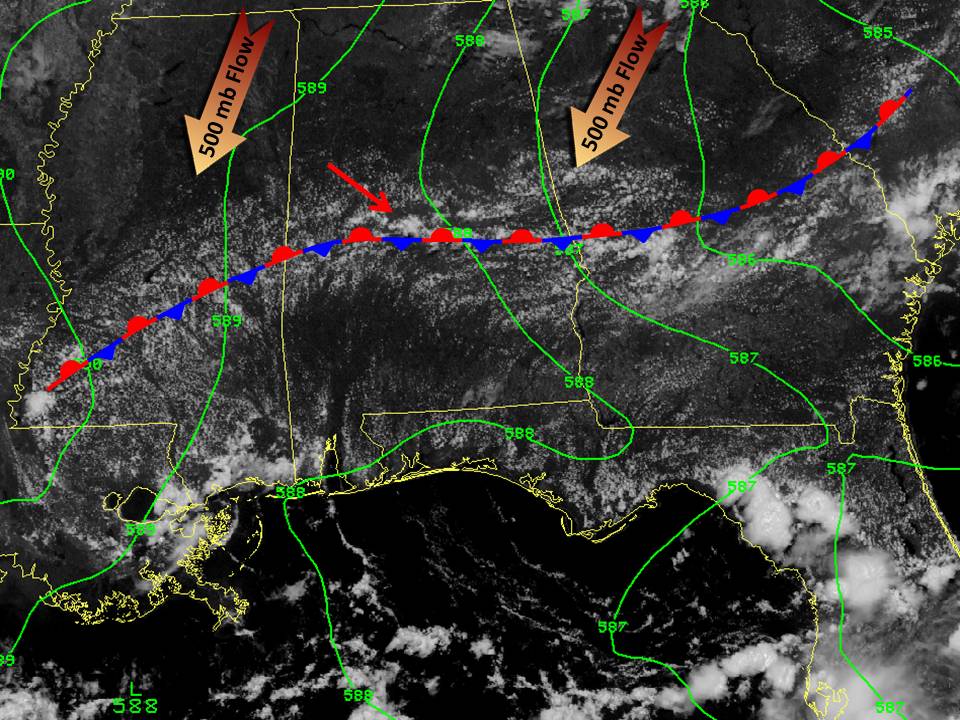
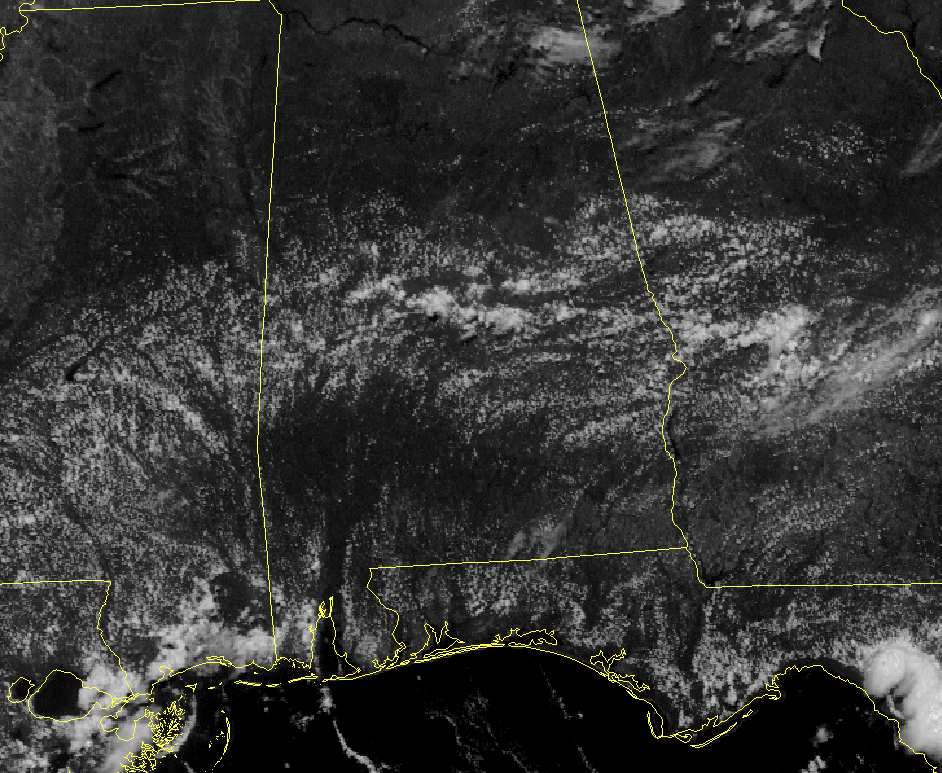
The above image is a visible satellite captured at 1215 pm CDT. As evident by the clouds through south central Mississippi, central Alabama and central Georgia, there is a weak boundary which has been the focus for convection over the last couple of days. The green lines are isobars of geopotential height at 500 millibars (mb). These lines depict what is commonly referred to as 'upper level flow' and average a height of about 20,000 feet. This day's upper level flow is out of the north-northeast. There are two main features being highlighted today. First, the convection that is beginning around the time of the top image. A thunderstorm, pointed out by the red arrow, is forming over extreme western Chilton County. At the time of initiation, winds at approximately 200 mb, or 35,000 feet, were blowing at 66 mph (58 knots). Once the storm reached the 200 mb level, these winds 'ripped off' the top of the storm and blew it downwind. You can follow the top of the storm in the animation below as it moves to the south-southwest towards the coast. The animation is from 1215 pm until 245 pm CDT. Today's second feature is the rings that are created within the cloud field after the storms dissipate. These rings are caused by outflow winds or winds that are forced to the ground as a storm dissipates. These winds spread out in all directions and can become the focus for further convection later in the day. |
 |


 Follow us on YouTube