|
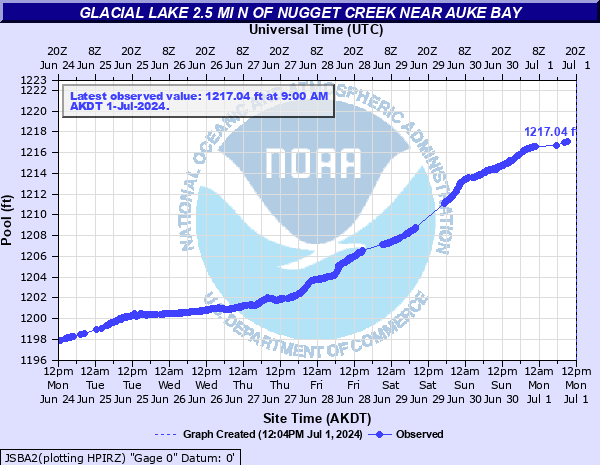
Suicide Basin is a side basin of the Mendenhall Glacier above Juneau, Alaska. Since 2011, Suicide Basin has released glacier lake outburst floods that cause inundation along Mendenhall Lake and River annually with a record major flood event taking place on August 6, 2024. The latest release took place on October 20, 2024. Monitoring Equipment Status: The USGS monitoring equipment is up and running. We will get one image from each of the 2 cameras per day. The USGS laser sensor data is active. There can be jumps or drops in the data from large ice bergs movement within the laser field of view. Current Basin Status: Saturday June 28, 2025. The laser water level elevation within the basin is currently reporting around 1186 feet. For reference the level in 2024 and 2023 on the 28th was reporting 1207 feet and 1293 feet respectively. Currently levels are more than 100 feet below 2023 levels for the same date. Water levels have risen about 37 feet in the last 10 days. The elevation of the overflow channel at the top of the ice dam is 1371 feet, that would put the current levels roughly 185 feet below this spillway. If the rate of rise in the basin remains around 4 feet per/day, this would result in a full basin in 46 days, around August 13th. The inflow rate into the basin can change through the summer due to periods of above normal temperatures along the ice field and rain events. These differences in water levels from 2024 and 2023 to current levels are due to the cold spring/early summer time temperatures. Freezing levels remained 3000 to 4000 feet through the spring and early summer time but are now around 7000 feet. These high freezing levels will continue to melt of snow and ice on the icefield and the water input into the basin. Check back for more updates on and how the conditions within the basin are changing. We are releasing some educational videos about these outburst floods, how to find data, terminology and other information. Look for those videos on NWS Juneau's YouTube channel, here, as we release them to the public.
|
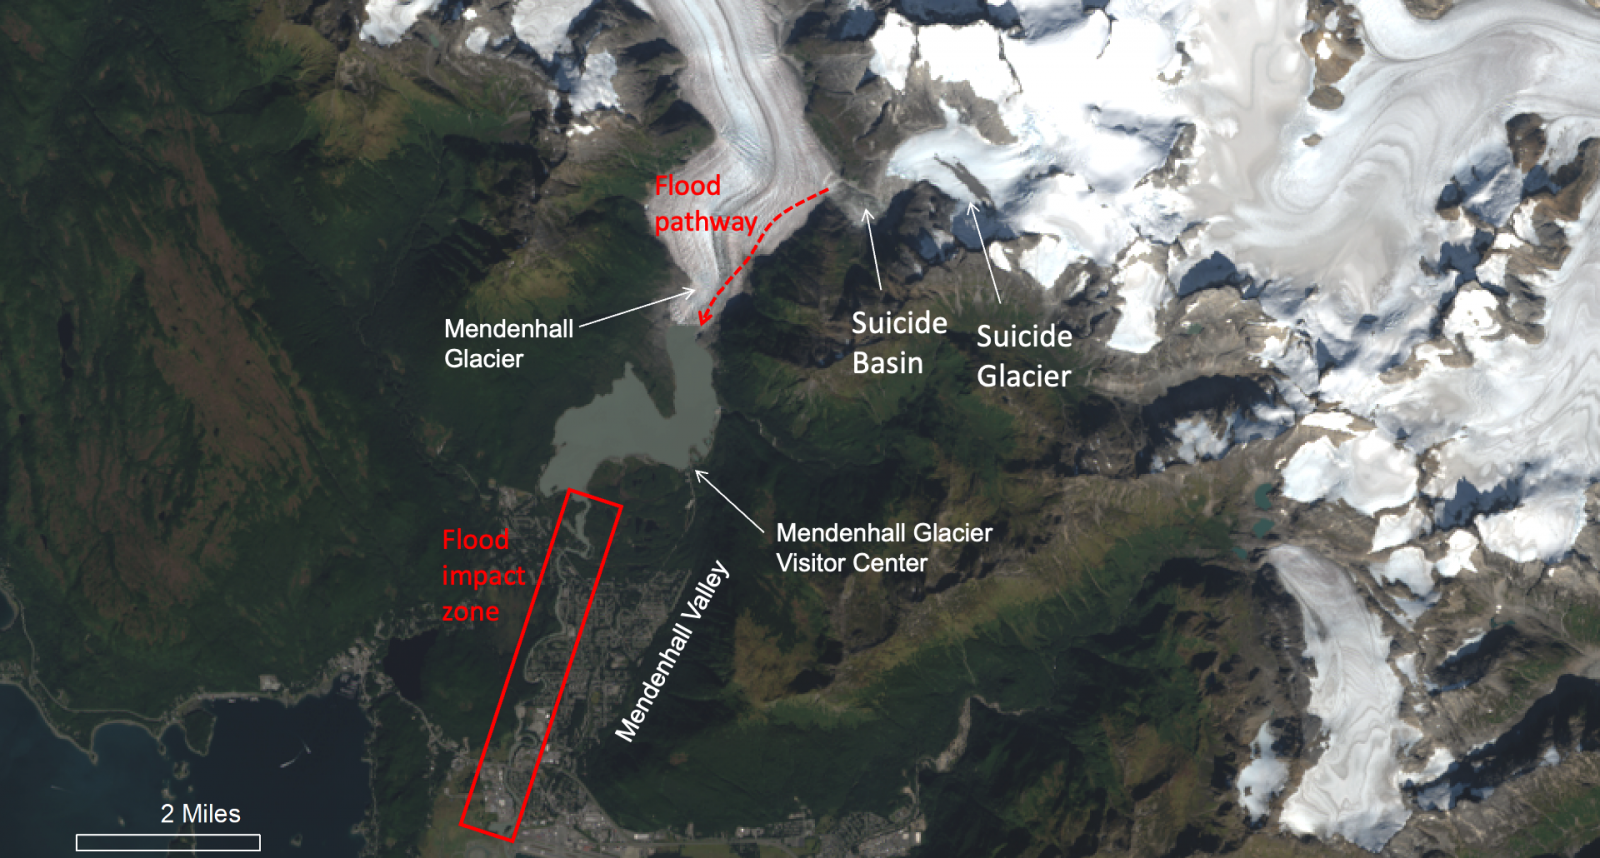
Visit the Juneau Glacial Flood Dashboard to learn more about Suicide Basin and flood impacts including: inundation maps, forecast data basics, history, and other FAQ! |
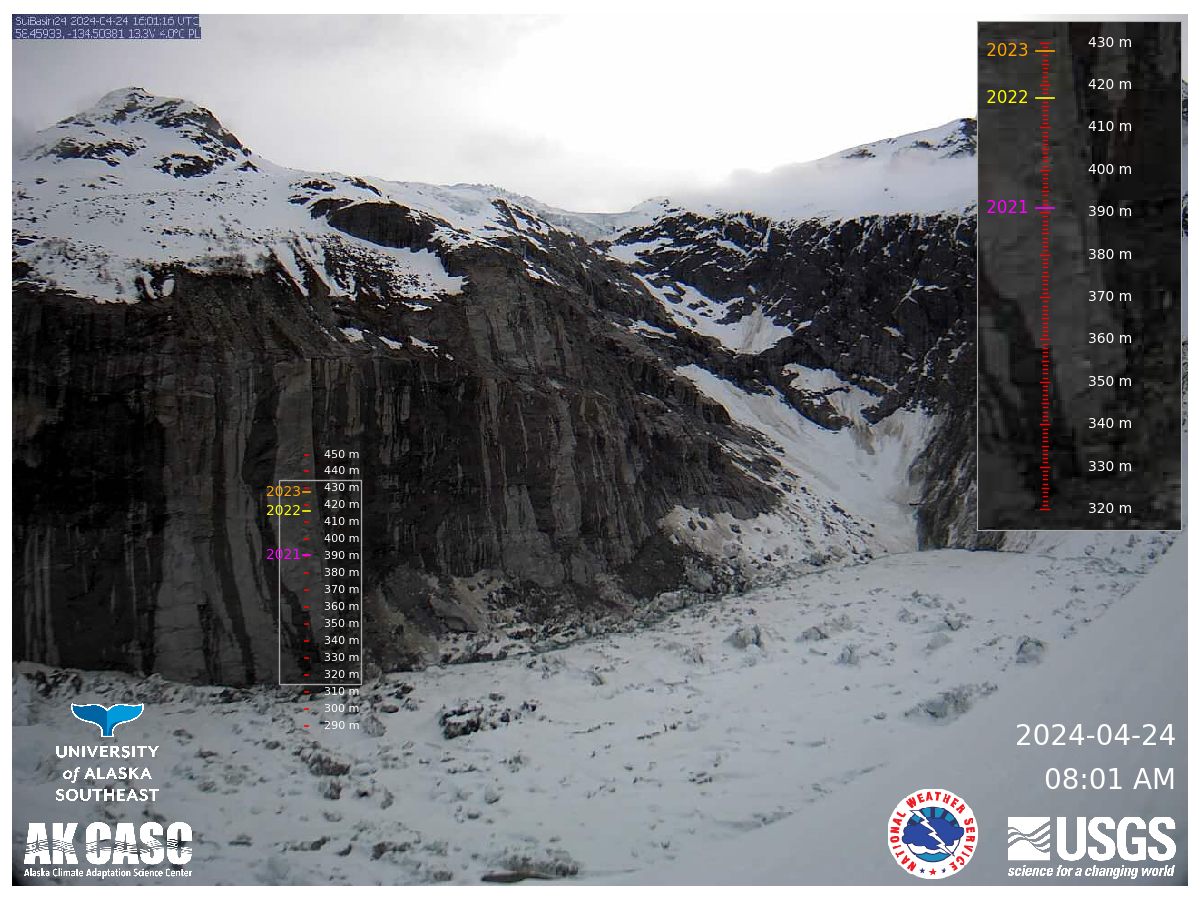
Latest Basin Image - ScalesMost recent image from the basin, updated at daily to sub-daily intervals (see time-stamp bottom right). The camera is placed at the basin entrance and faces northeast, into the basin. Click on image to enlarge and read basin levels. Click on the links below the image to see a full-season viewer or recent timelapse.
|
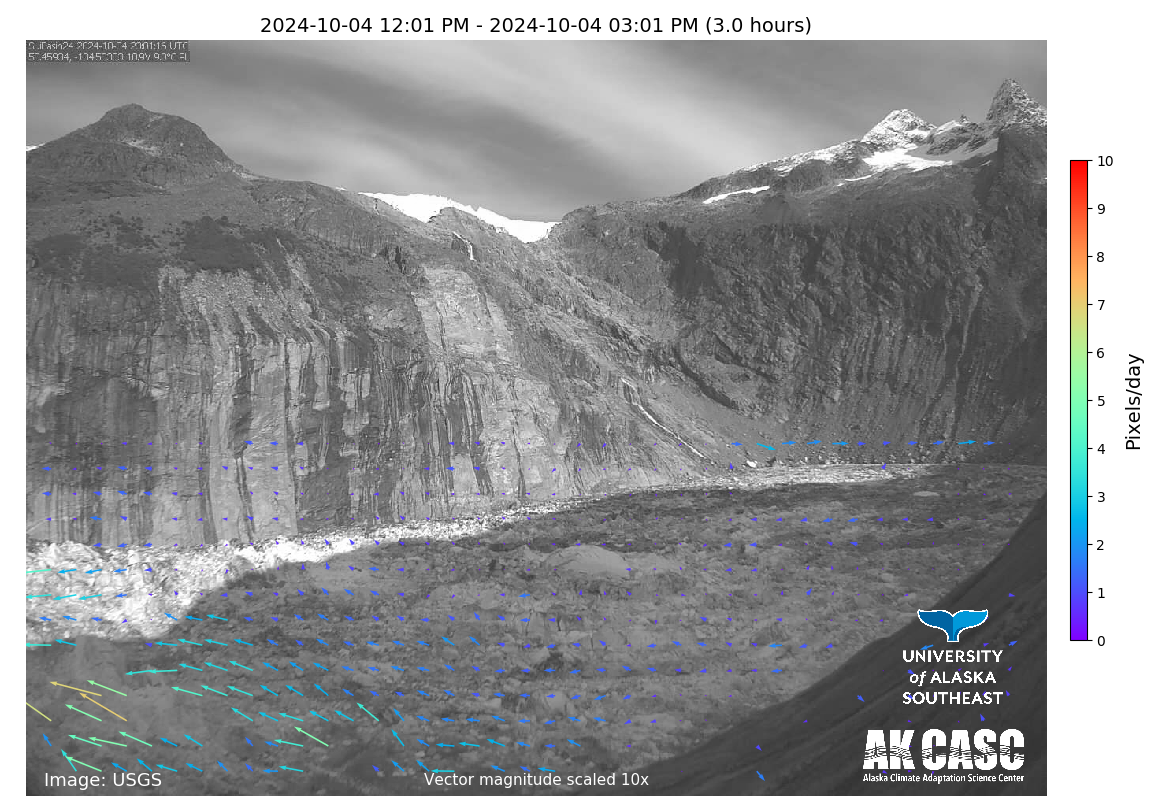
Latest Basin Image - VectorsMost recent image from the basin (same as on the left) with vectors indicating ice motion direction and magnitude. Click on image to enlarge. Click on the links below the image to see a full-season viewer or recent timelapse.
|
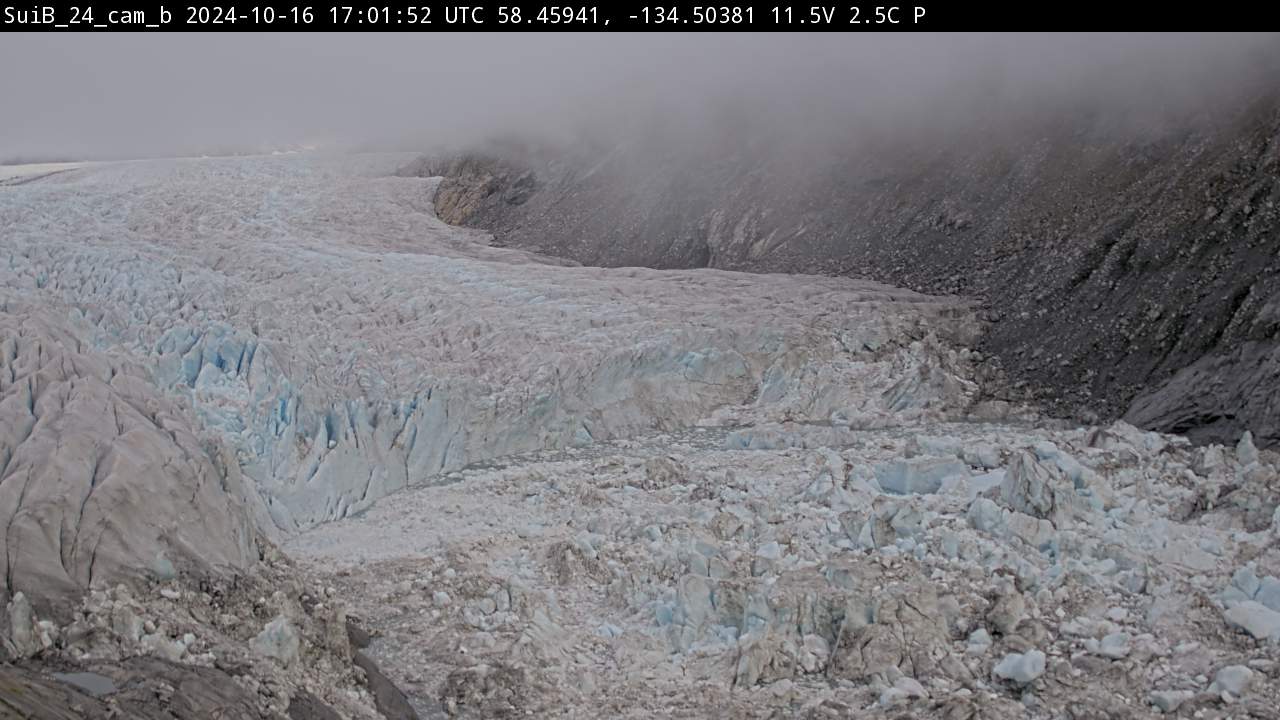
Latest Basin Image - Front of BasinMost recent image from the camera taking images with a view of the front of the basin. This image will be updated at daily to sub-daily intervals. Click on the image to enlarge. Click on the links below the image to see a full-season viewer or recent timelapse.
|
Suicide Basin Level (Pool Height)Graph showing the current (blue) pool height of Suicide Basin. Click on the image for more details (NWPS). At this time, values are from the USGS laser detection system.
|
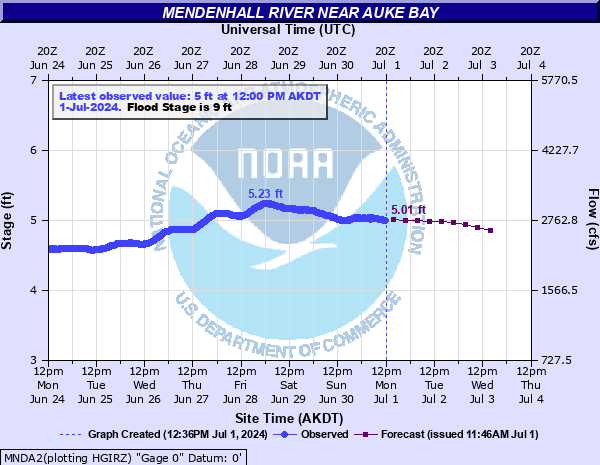
Mendenhall Lake Stage LevelGraph showing the current (blue) and predicted (purple) stage level at Mendenhall Lake. Stage levels are annotated on the left y-axis on the graph. The graph also shows the Mendenhall River discharge (right y-axis), which is derived from the Mendenhall Lake stage level via rating curve. Click on the image for more details (NWPS).
|
Mendenhall River Stage Level @ Backloop BridgeGraph showing the current (blue) stage level of the Mendenhall River at the Backloop Bridge. Stage levels are annotated on the left y-axis on the graph. Click on the image for more details (NWPS).
|
Mendenhall River Stage Level @ Pedestrian BridgeGraph showing the current (blue) stage level of the Mendenhall River at the Pedestrian Bridge. Stage levels are annotated on the left y-axis on the graph. Click on the image for more details (NWPS).
|
Mendenhall River Stage Level @ Brotherhood BridgeGraph showing the current (blue) stage level of the Mendenhall River at the Brotherhood Bridge. Stage levels are annotated on the left y-axis on the graph. Click on the image for more details (NWPS).
|
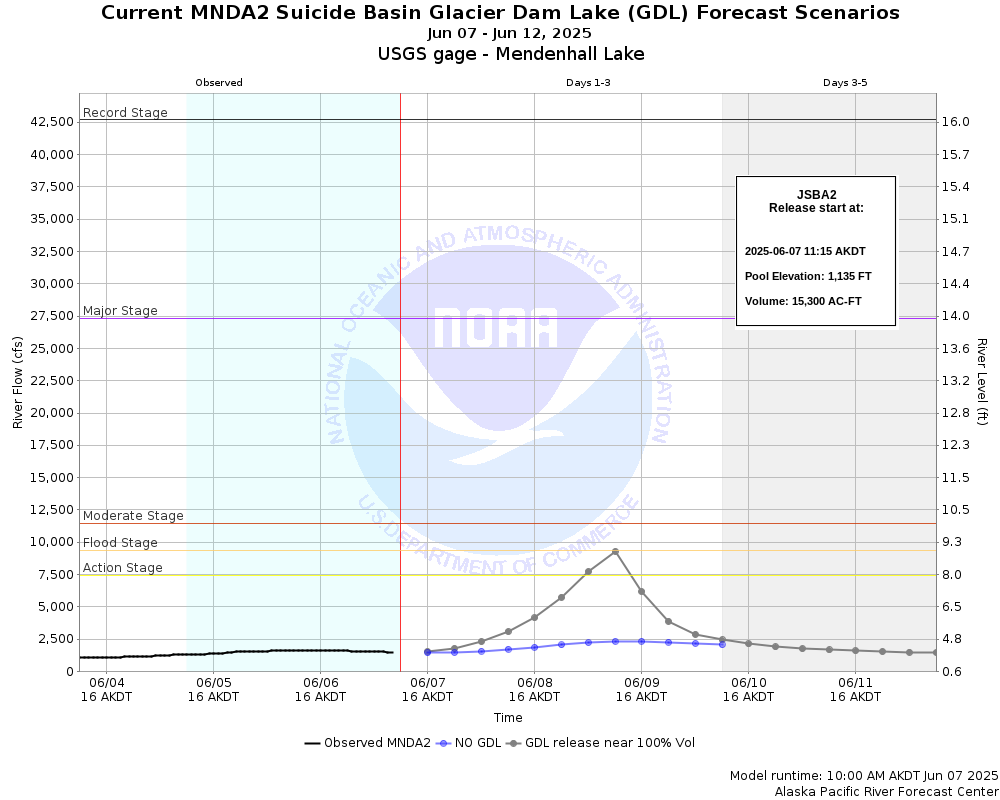
Mendenhall Lake Forecast ScenariosGraph showing a modeled near 100% release forecast (gray) and the current no-release forecast (blue). This image is updated once daily in the afternoon starting in late May / early June.
 |
 |
||
|
|
|
|


