National Weather Service United States Department of Commerce


Tropical Storm Cindy's Impact on Central Alabama
  June 19-24, 2017

 
Overview Tornadoes Rainfall Totals Satellite/Surface/Upper Air Other Links
 

Overview

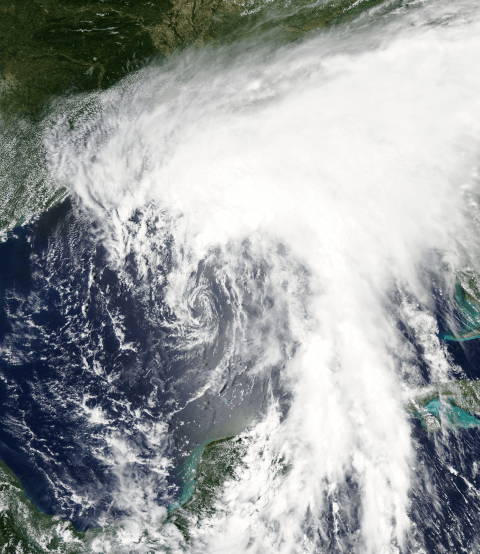
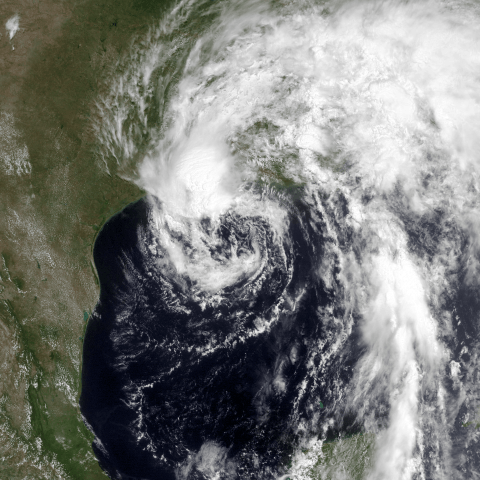
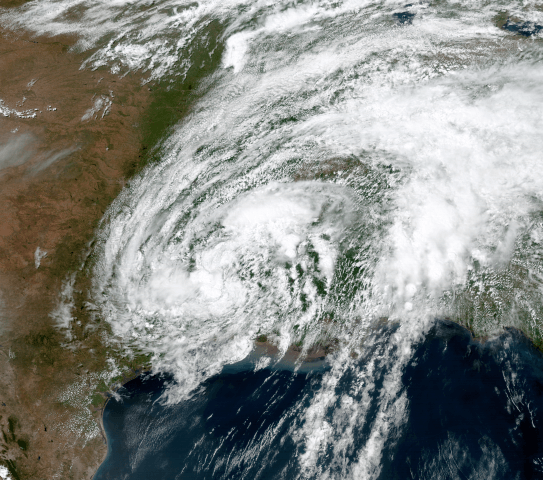
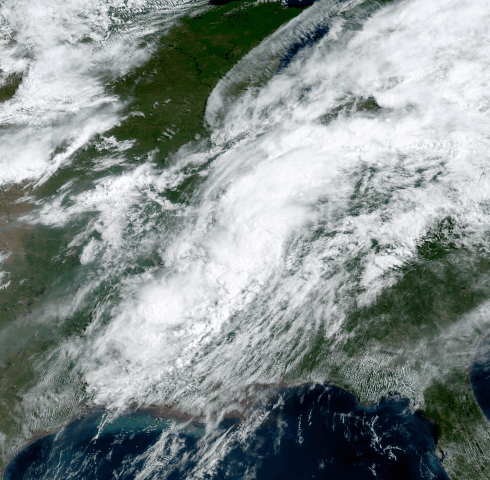
The National Hurricane Center identified an area of interest for possible tropical development back on June 13th. The area of interest was in the western Caribbean, off the coast of Mexico and Belize. By June 19th, statements were initiated for Potential Tropical Cyclone Three in the south central Gulf of Mexico. Tropical Storm Cindy formed the afternoon of  June 20th, 360 miles southeast of Galveston, Texas. Tropical Storm Cindy eventually made landfall on the Louisiana Coast very close to the Texas and Louisiana State Line. Cindy moved north and northeast across Louisiana, Arkansas, Tennessee, and Kentucky before losing its tropical characteristics. Cindy became Post Tropical Cyclone Cindy over central Kentucky on June 23rd.

Very heavy rainfall accompanied Cindy, but was located in two distinct areas. One area was very close to the center over Texas and Louisiana. The second was much larger and several hundreds miles to the east. This rain area was produced by a long southerly fetch of tropical air and a convergent band from Cindy remaining or rotating over the same locations several days.  This area was generally southeast Louisiana, Eastern Mississippi, Alabama, the Florida Panhandle, and parts of Georgia. Maximum rainfall amounts exceeded 10.5 inches in several places most notably in an area bounded by New Orleans (LA), to Birmingham (AL), to Destin (FL). A few locations in Hale County reportedly received over 11 inches but could not be substantiated.  Numerous locations experienced Flash Flooding from this torrential rainfall. Numerous area rivers went into flood, but at most of the locations, only minor flooding was experienced.  The wind remained relatively in check and did not produce significant damage. Due to the rather long and strong southerly wind fetch, many areas experienced coastal flooding and deadly riptides.

Central Alabama had two confirmed tornadoes associated with Cindy. Additionally, tornadoes were reported in Florida, Mississippi, Kentucky and other locations in Alabama. Below are links the write ups for the tornadoes and other additional data from the remnants of Tropical Storm Cindy.


Tornadoes

Location/Clickable Detailed Summary Link
Damage Rating/Estimated Maximum Wind Speeds
Injuries/Fatalities
Damage Path Length/Width
Starting Point/Time
Ending Point/Time
Fairfield Tornado
(Jefferson County)
EF-1
110 mph
4 Injuries
8.3 miles
255 yards

4 NNE Bessemer 33.4282/-86.9397
1221 pm

4 WSW Mitchell 33.5317/-86.8670
1238 pm
Anita Tornado
(Shelby County)
EF-0
70 mph
None
0.27 miles
50 yards

3 NE Marvel
33.1834/-86.9721
242 pm

3 NE Marvel
33.1861/-86.9697
243 pm
 

Rainfall Totals

Preliminary Snowfall Totals


Satellite/Surface/Upper Air

Satellite Images

GOES-16 VIS Loop on Jun 19th

GOES-16 VIS Loop on Jun 21st

GOES-16 IR Loop on Jun 21st

**NOTE: The GOES-16 data above are preliminary, non-operational data.**
 
Satellite Image

VIS Image on Jun 20th at 2 PM

Satellite Image

VIS Image on Jun 21st at 12 PM

Satellite Image

VIS Image on Jun 22nd at 230 PM

Satellite Image

VIS Image on Jun 23rd at 10 AM

Surface Charts

Surface Chart

7 AM Jun 19th

Surface Chart

7 AM Jun 20th

Surface Chart

7 AM Jun 21st

Surface Analysis

7 AM Jun 22nd

Surface Analysis

7 AM Jun 23rd

Surface Chart

7 AM Jun 24th

KBMX Upper Air Soundings

KBMX Sounding

7 PM Jun 20th

KBMX Sounding

7 AM Jun 21st

KBMX Sounding

7 PM Jun 21st

KBMX Sounding

7 AM Jun 22nd

KBMX Sounding

7 PM Jun 22nd

KBMX Sounding

7 AM Jun 23rd

KBMX Sounding

7 AM Jun 24th


Upper Air Charts

250mb Chart

250mb Chart at 7 AM Jun 19th

500mb Chart

500mb Chart at 7 AM Jun 19th

850mb Chart

850mb Chart at 7 AM Jun 19th

250mb Chart

250mb Chart at 7 AM Jun 20th

500mb Chart

500mb Chart at 7 AM Jun 20th

850mb Chart

850mb Chart at 7 AM Jun 20th

250mb Chart

250mb Chart at 7 AM Jun 21st

500mb Chart

500mb Chart at 7 AM Jun 21st

850mb Chart

850mb Chart at 7 AM Jun 21st

250mb Chart

250mb Chart at 7 AM Jun 22nd

500mb Chart

500mb Chart at 7 AM Jun 22nd

850mb Chart

850mb Chart at 7 AM Jun22nd

250mb Chart

250mb Chart at 7 AM Jun 23rd

500mb Chart

500mb Chart at 7 AM Jun 23rd

850mb Chart

850mb Chart at 7 AM Jun 23rd

250mb Chart

250mb Chart at 7 AM Jun 24th

500mb Chart

500mb Chart at 7 AM Jun 24th

850mb Chart

850mb Chart at 7 AM Jun 24th


Other Links