| Climate/Almanac Data - August Normals - August Records |
| |
| AUGUST |
| |
|
Site
(Click site name for report)
|
Avg
Temp |
Normal |
Dept
From
Norm |
Precip
Total |
Normal |
Dept
From
Norm |
| Burlington |
69.8° (7) |
75.1° |
-5.3° |
4.56" |
4.27" |
+0.29" |
| Cedar Rapids |
67.2° (6) |
71.0° |
-3.8° |
1.60" |
4.48" |
-2.88" |
| Davenport |
67.4° |
71.2° |
-3.8° |
0.62" |
4.62" |
-4.00" |
| Dubuque |
66.0° (6) |
70.0° |
-4.0° |
3.23" |
4.40" |
-1.17" |
| Iowa City |
70.2° |
72.7° |
-2.5° |
1.12" |
4.50" |
-3.38" |
| Moline |
69.7° |
73.5° |
-3.8° |
0.68" (7T) |
4.52" |
-3.84" |
The ranking is listed in parentheses (__) when within the "Top 10".
|
| |
| August 2017 was about 2.5 to near 5 degrees below normal. |
| Precipitation totals for August 2017 ranged from about normal at Burlington to about 4 inches below normal in the QC. |
| Please see August Records for monthly record information. |
| |
| |
| The climate maps below are courtesy of the Midwest Regional Climate Center. |
| These maps become available around 10am on the first of the month. |
| |
Average
Temperature |
Average
Temperature
Departure from Mean |
Accumulated
Precipitation |
Accumulated
Precipitation
Percent of Mean |
 |
 |
 |
 |
|
| |
| |
| |
| |
| |
| |
| Climate/Almanac Data - Summer Normals - Summer Records |
| |
Summer
(Jun-Aug) |
| |
|
Site
(Click site name for report courtesy of the
Iowa Environmental Mesonet.)
|
Avg
Temp |
Normal |
Dept
From
Norm |
Precip
Total |
Normal |
Dept
From
Norm |
| Burlington |
73.3° |
75.1° |
-1.8° |
11.18" |
12.99" |
-1.81" |
| Cedar Rapids |
70.5° |
71.2° |
-0.7° |
7.64" |
13.86" |
-6.22" |
| Davenport |
71.0° |
71.6° |
-0.6° |
12.99" |
13.01" |
-0.02" |
| Dubuque |
69.0° |
70.1° |
-1.1° |
13.71" |
13.11" |
+0.60" |
| Iowa City |
73.5° |
73.0° |
0.5° |
11.81" |
14.06" |
-2.25" |
| Moline |
72.8° |
73.5° |
-0.7° |
11.77" |
13.30" |
-1.53" |
|
|
The ranking is listed in parentheses (__) when within the "Top 10".
|
| |
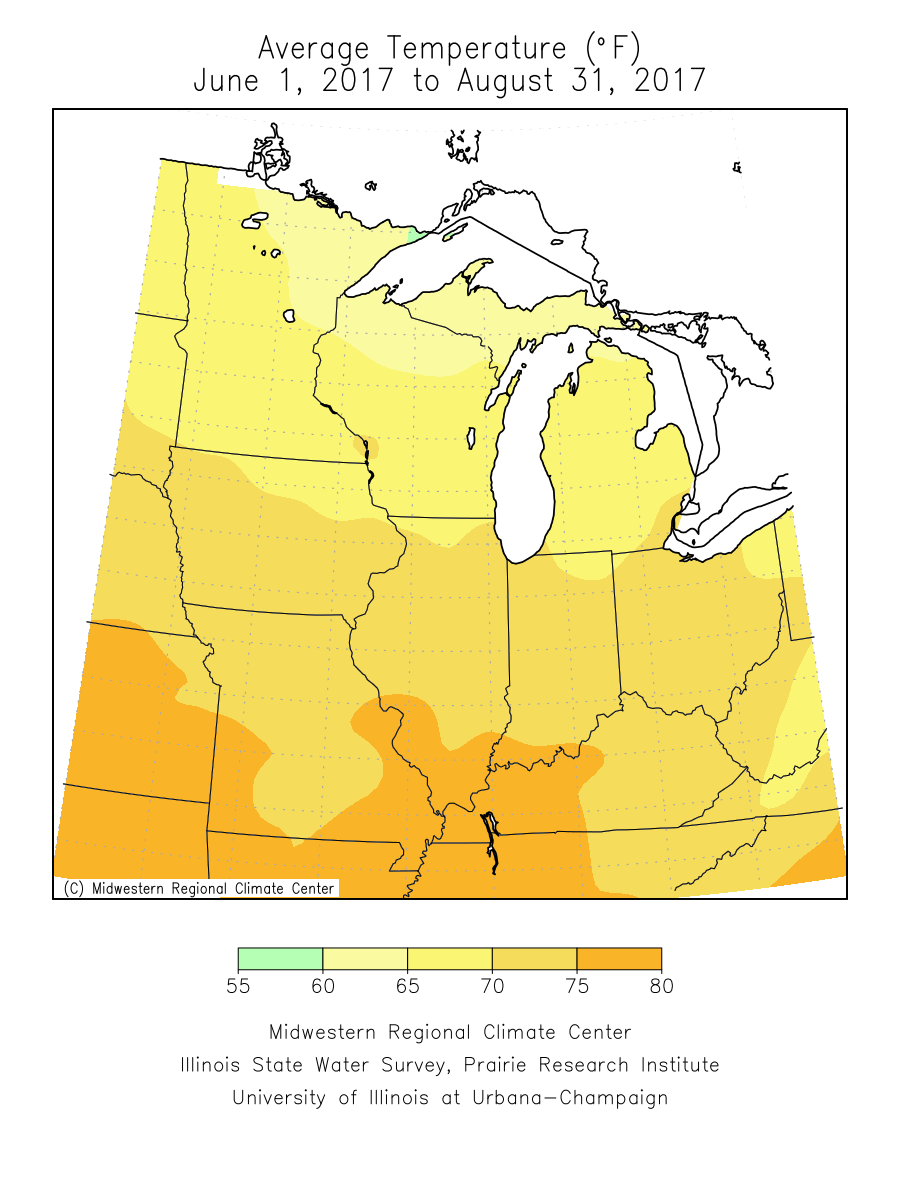
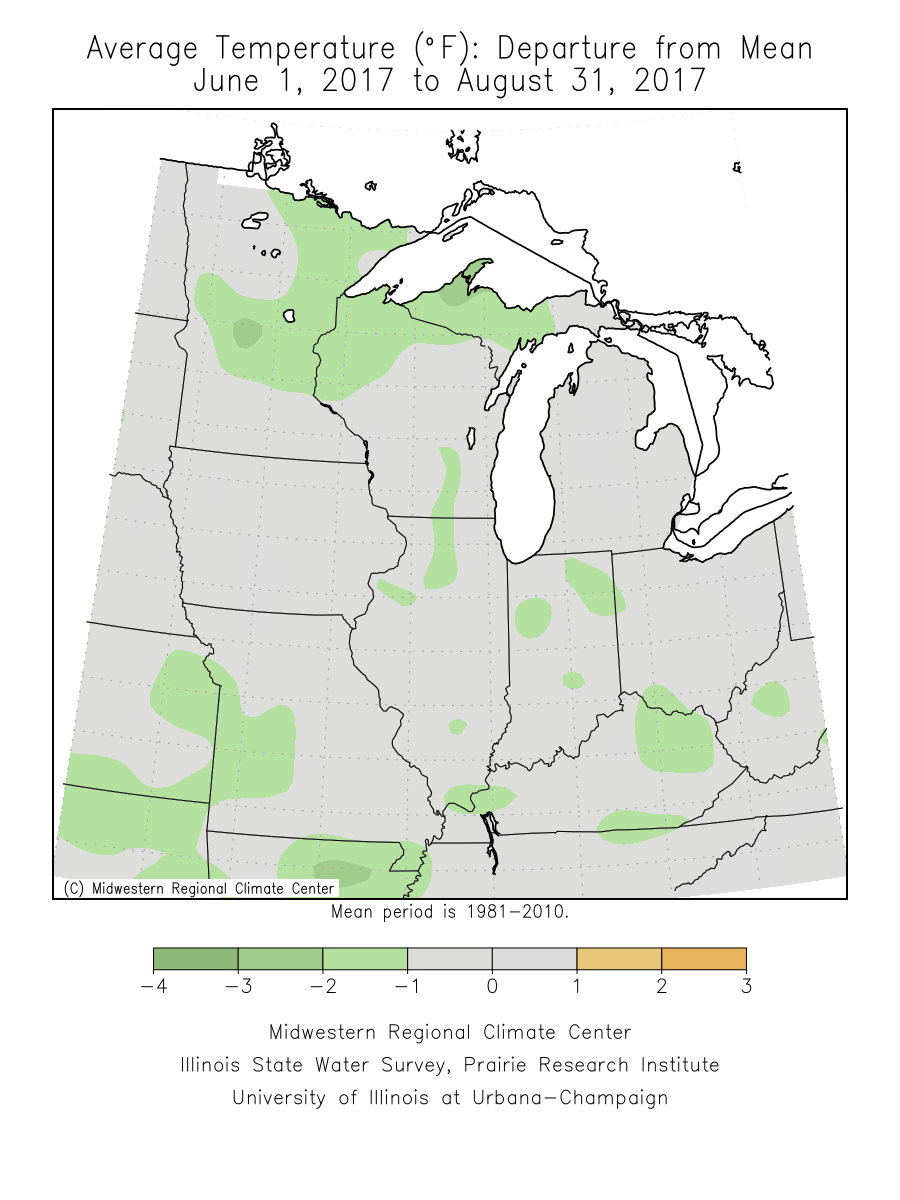
| Summer 2017 temperatures were near to slightly below normal. |
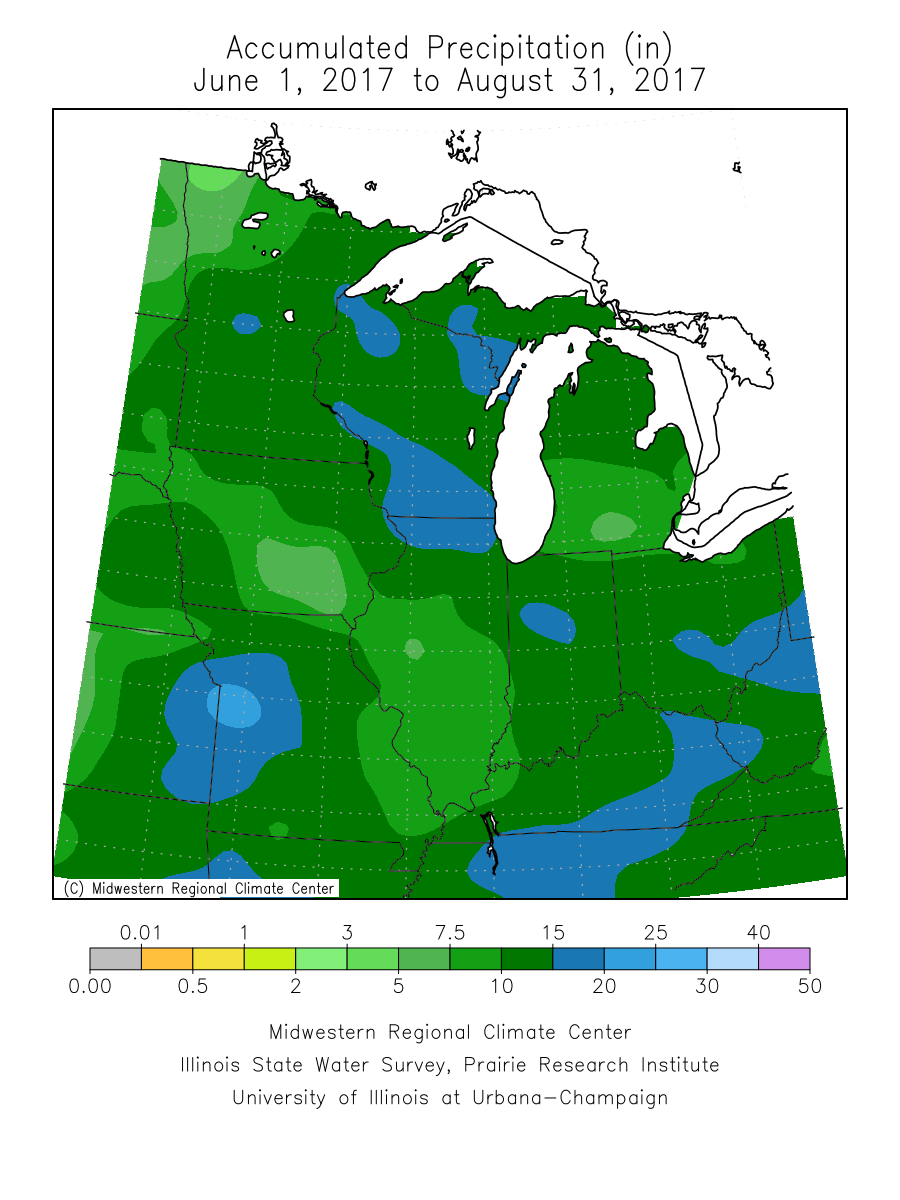
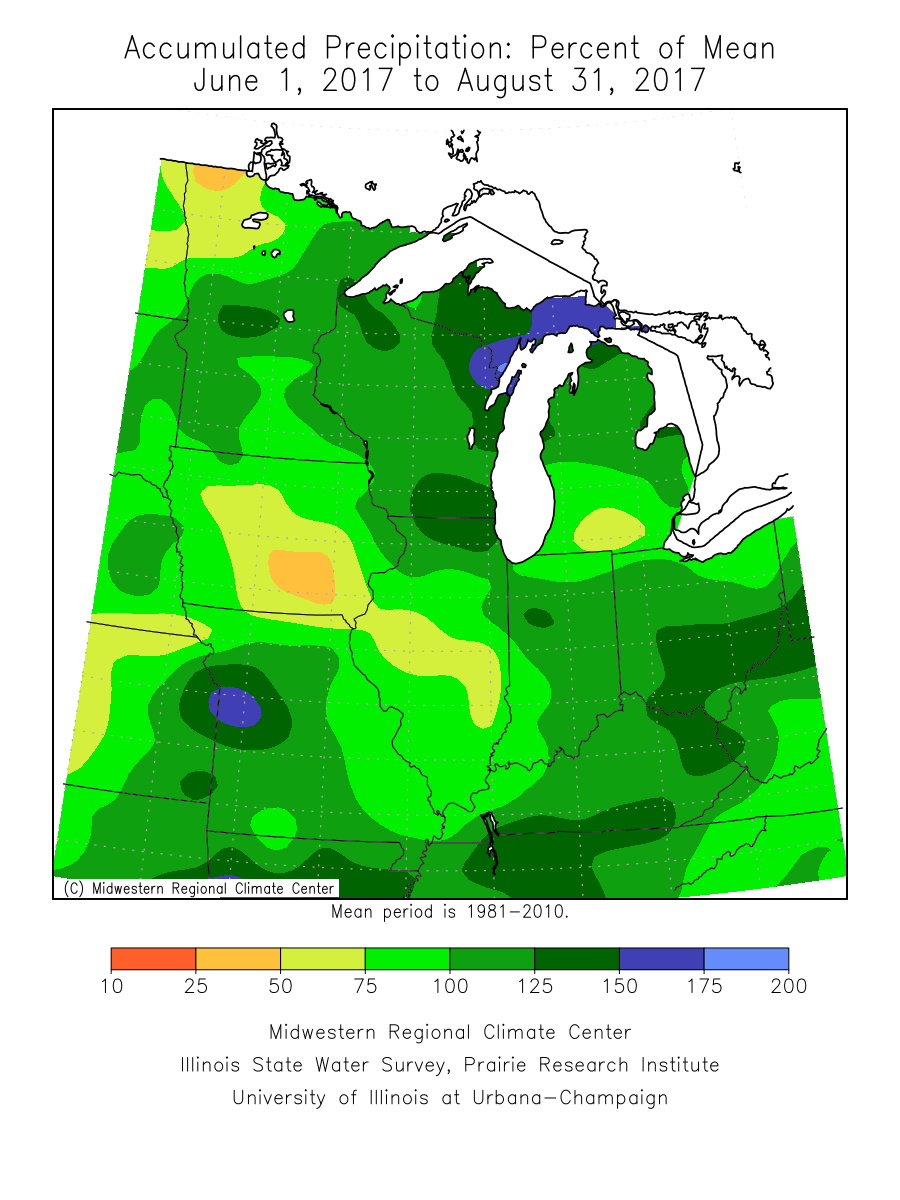
| Precipitation totals for Summer 2017 were near normal at Davenport & Dubuque to over 6 inches below normal at Cedar Rapids. |
| Please see Summer Records for seasonal record information. |
| |
| |
| The climate maps below are courtesy of the Midwest Regional Climate Center. |
| |
Average
Temperature |
Average
Temperature
Departure from Mean |
Accumulated
Precipitation |
Accumulated
Precipitation
Percent of Mean |
 |
 |
 |
 |
|
| |
| |
| |
| A LOOK AHEAD |
| |
| Climate Prediction Center |
| |
September
Temperature Outlook |
September
Precipitation Outlook |
September - November
Temperature Outlook |
September - November
Precipitation Outlook |
 |
 |
 |
 |
|
| |
| |
| |
| |
| |
|
|


 Follow us on YouTube