Assessment of Hourly Fog and Ceiling Climatology Across Central, South-central, and Southeast Kansas
Kenneth R. Cook, Matthew Harding, Alan Winter, and Chris Weibe
National Weather Service, Wichita Kansas
April 5th, 2010
1.0 Introduction
Fog is a challenge to forecasters, the aviation community, and commuters alike. It is responsible for some of the largest car pileups in the nation. A National Transportation Safety Board study conducted in 1995-2000 cited weather as being a factor in 3 out of every 10 fatal aircraft accidents (Pearson, 2002). Data from the same study further indicated that 63% of all weather-related aircraft disasters happened in low ceilings and fog (Pearson, 2002; Cox, 2007). It has also been well chronicled how dense fog and low ceilings can significantly interrupt air traffic, resulting in detrimental costs to the aviation industry.
The objective of this study was to find trends in the occurrence of fog and associated visibility and ceiling height for each site. The goal here was to improve the forecaster's:
The authors do acknowledge that much of this information is known, mostly anecdotally. However, this study will produce specific data to be applied in the forecast process.
2.0 Methodology
Hourly observation data for the 30 year period ending in June 2006 were examined. To get a good cross section of the area studied, as well as research a majority of the TAF sites, the Russell (Krsl), Wichita, (Kict), and Chanute (Kcnu) observation stations were used. For this study, the observations used were narrowed and examined using the following approach:
3.0 Results and Discussion
Surface observations containing fog were analyzed to ascertain climatological impacts at the Krsl, Kict, and Kcnu airports. The results of the data are shown below.
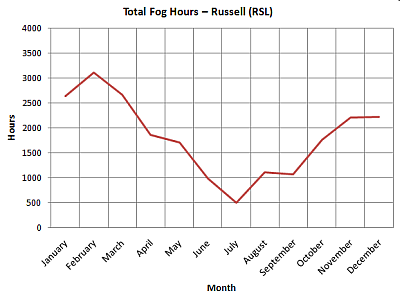
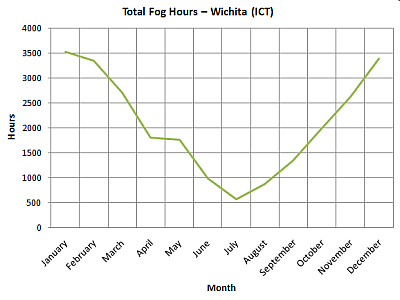
- Total Fog Hours -Below is a distribution of all the fog hours by month. The minimal fog hour month for all three sites was June, with the maximum being February in Russell, and January in Wichita and Chanute. |
||
 |
 |
 |
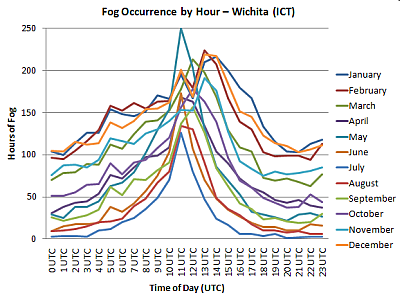
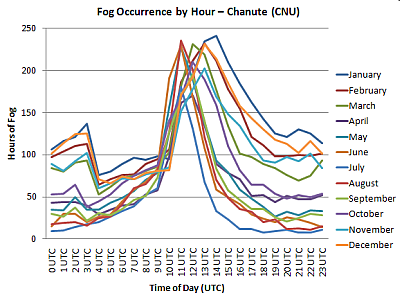
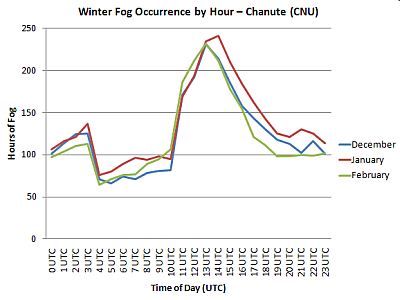
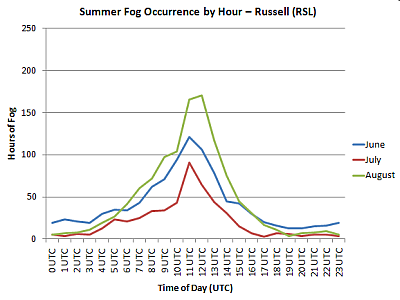
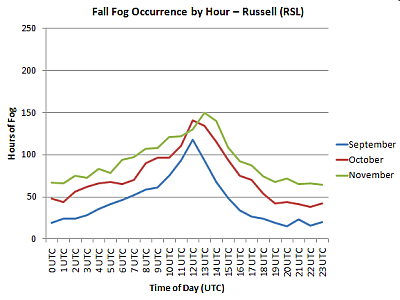
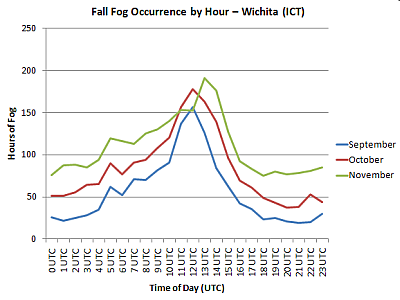
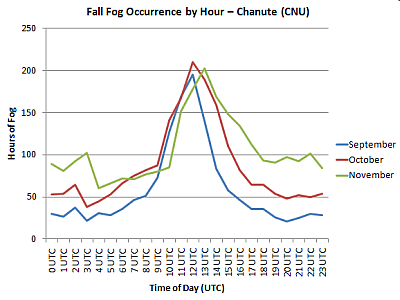
- Hourly Fog Occurrence -Below are the comparisons of fog by the hour for each month. As one would expect, the greatest number of fog hours is during the dawn hours. Moreover, the time of year does play a role in the distribution of hours, with steeper curves in the warm season months. One notable difference is seen at Chanute. There is a marked decrease in fog hours between 4 UTC and 10 UTC during the cool season months to where it nearly parallels the warm season months. The other two sites show an increase of fog hours during these times. This is an area for further study. |
||
 |
 |
 |
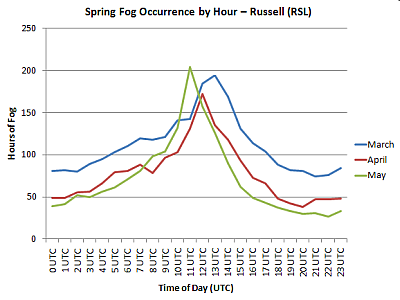
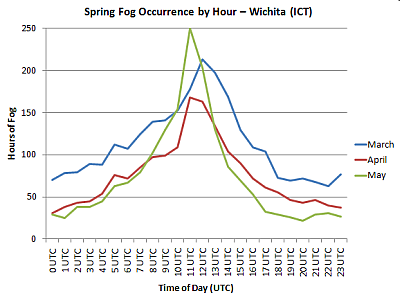
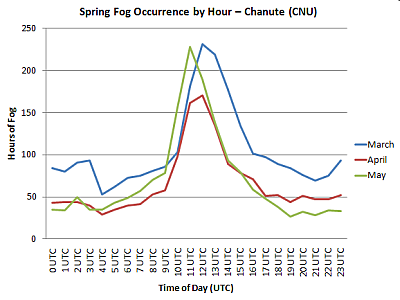
- Hourly Fog Distribution by Season -The following are hourly comparisons of fog observations, grouped by season for each station. Note the significant differences between each season, especially between winter and the other seasons. This is from an increase in fog during the non-morning hours where radiation fog is typical maximized. This is likely due to the increase of advection fog events during this time of year as well as the decrease in mixing during the winter season, allowing fog to persist longer during the day (Cox, 2007). Additionally, there is a significant difference between Chanute and the other stations. The hourly fog drops significantly right after sundown in all months at cnu (more minimal in the summer). This is likely due to micro-climate effects that are unknown at this time. |
||
 |
 |
 |
 |
 |
 |
 |
 |
 |
 |
 |
 |
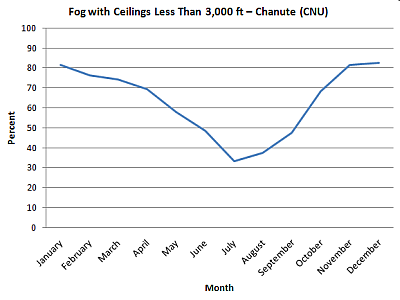
- Ceilings Less Than 3,000 ft in Fog Observations -For this analysis, the goal was to determine how often a ceiling was observed that would affect aviation when fog occurred. The data shows a marked drop in the percentage of ceilings with fog during the summer months. |
||
 |
 |
 |
|
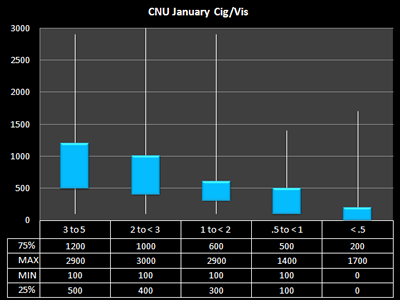
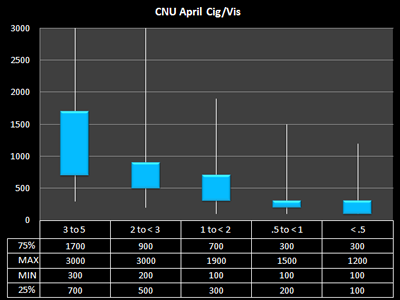
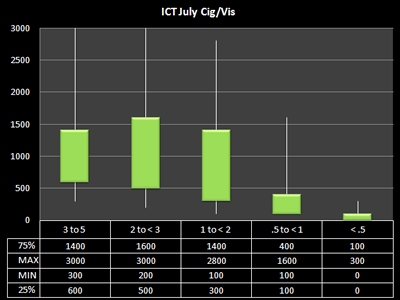
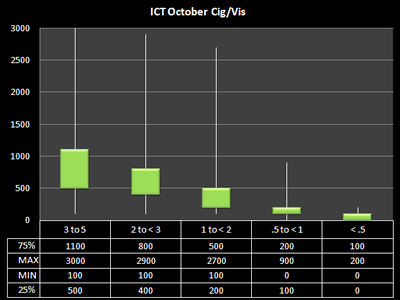
- Data Summary, Using This Operationally - These graphs can be used when forecasting ceilings and visibilities from fog. There are only 4 months shown here, but each represents their specific season of the year fairly well. To create the analysis used for this portion of the project, the station observations were placed into visibility categories, then analyzed for ceiling heights. The maximum and minimum as well as the quartiles are plotted and listed. To properly use this, forecasters should find the expected visibility and then find the probable ceiling height. Note: forecasting a ceiling height* during the summer season should be assessed carefully given the climatological minimum of ceiling during these months. *Ceiling height defined as one that affects aviation traffic and is one that is less than 3,000 ft. |
||
 |
 |
 |
 |
 |
 |
 |
 |
 |
 |
 |
 |
4.0 References
Pearson, D. C. 2002: “VFR Flight Not Recommended” A Study of Weather-Related Fatal Aviation Accidents. Technical Attachment SR SSD 2002-18. Available on the web at:
https://www.srh.noaa.gov/topics/attach/html/ssd02-18.htm.
Cox, R. E. 2007: "Applying Fog Forecasting Techniques Using AWIPS and the Internet". NWA Electronic Journal of Operational Meteorology 2007-FTT1. Available on the web at:
https://www.nwas.org/ej/2007-FTT1/


 Follow us on YouTube