Assessment of Hourly Ceiling and Visibility During Thunderstorms Across Central, South-central, and Southeast Kansas
L. David Williams, Mary-Beth Schreck, Kenneth R. Cook
National Weather Service, Wichita Kansas
March 26th, 2010
1.0 Introduction
Forecasting visibiities and ceiling heights for thunderstorms is a great challenge given the variability of conditions that can influence these forecasts. How heavy the rainfall is, the height of the thunderstorm's base, how much boiundary layer moisture there is, are just a few of the many that exist and influence these conditions.
The purpose of this study was to look at observational data from past events and build a climatological database, thereby providing forecasters a better understanding as to what the typical ceiling heights, if they occur, and what the visibilities are observed in a thunderstorms and how plausible their proposed forecast really is.
2.0 Methodology
Data were examined for the 30 year period ending June 2006. Observation sites that were used include KRSL, KSLN, KICT, KCNU, 4 of the 5 TAF sites (airport terminal forecasts) the National Weather Service in Wichita is responsible for. KHUT was obmitted due to an incomplete dataset. Only observations from these locations that contained thunderstorms were used for this study. Further, due to the number of cases, the months of April, May, June, July, and August were studied.
The data were stratified by station, by month,. Then, the data were seperated further using the following visibility categories:
| Visibility |
| > 5 SM |
| 3 - 5 SM |
| 2 - <3 SM |
| 1 - <2 SM |
| .5 - <1 SM |
| <0.5 SM |
From these data, the percentage of time a ceiling was observed (this being a ceiling below 3000 feet, which corresponds with MVFR or lower conditions which are of interest to the aviation community) was calculated. Additional statistics were calculated and will be explained further.
3.0 Results and Discussion
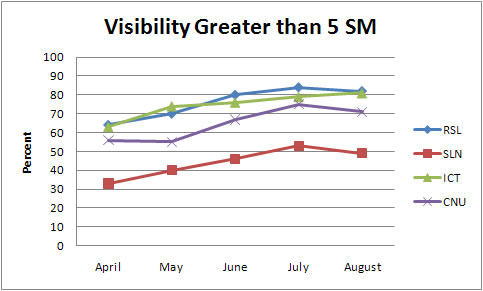
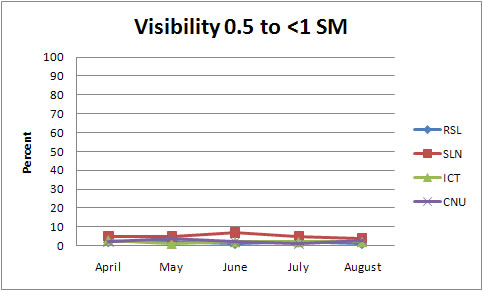
Calculations showed that visibilities increased/improved at all stations into the summer, leveling off. For example, at Wichita's Mid Continent, the percentage of observations that contained a visibility of greater than 5 statute miles was 63% in April, rising to 81% in August. This kind of transition was seen throughout the stations studied. These images below illustrate the change in visibilities:
*Note: Links to images that contain the monthly data are included in Appendix A.
 |
 |
 |
 |
 |
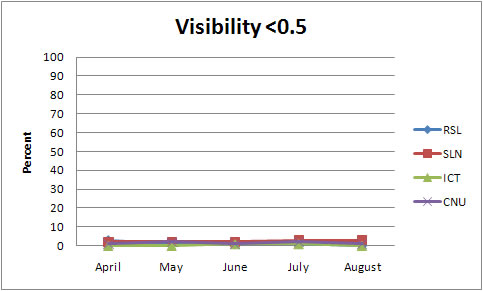 |
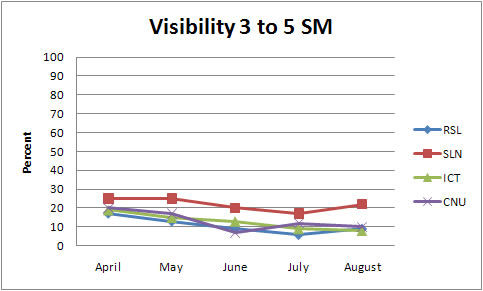
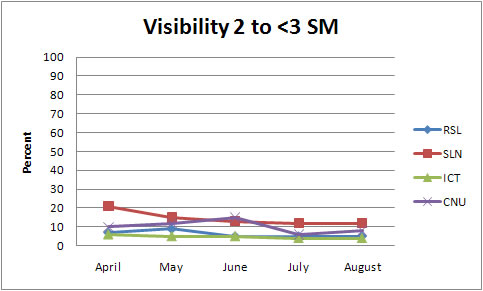
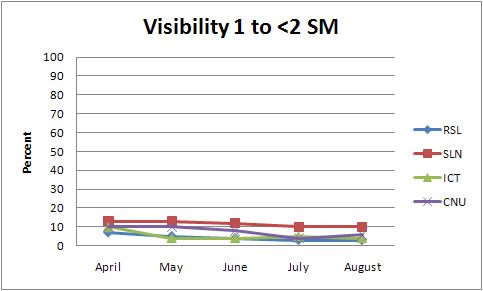
| Figure 1. Graphs of observation percentage for each visibility category occurring for each station by month. | |
This illustrates that when forecasting thunderstorms in the TAF, it is unlikely to observe a visibility of less than 5 statute miles, and certainly less than 3 statute miles on the hour. Moreover, it is an extremely low probability to observe a visibility of less than one mile at any station.
A further analysis of the data showed the probability of 3000 feet or lower ceilings being observed during a thunderstorm for each station.
 |
| Figure 2. Percent of thunderstorm observations containing a ceiling by station by month. |
The results, seen here in figure 2, suggest the likelihood of observing a ceiling below 3000 ft decreases into the summer months, with a high probability of no ceilings that impact aviation pretty high by mid-summer.
In summary, the effects that thunderstorms have on airport operations, specifically ceiling and visibility, decrease into the summer months. By mid-summer,. it is unlikely to observe visibilities less than 5 statute miles or a ceiling less than 3000 feet on the hour at any of the observation points studied. One final note, Salina (KSLN) consistently had the most pessimistic observations regading visibility and ceiling heights. This is perhaps a motivation for further study to explain why this is the case.
Appendix A:
| April | May | June | July | August |


 Follow us on YouTube