Mesoscale Modeling Project at NWS Melbourne, Florida
|
Local Mesoscale Model Note: these analyses are experimental and may not be available at all times. Data ingest and quality control improvements are currently underway. |
 BACKGROUND
Applied Meteorology Unit (AMU) entities, comprised of personnel from the Melbourne, FL National Weather Service (NWS) Weather Forecast Office (WFO MLB) AMU, the NWS Spaceflight Meteorology Group (SMG) in Houston, TX, and ENSCO, Inc.), implemented a Local Data Integration System (LDIS) at WFO Melbourne and SMG Houston between late 2000 and early 2001. This effort was undertaken to integrate the various data sets in proximity to the Kennedy Space Center (KSC) and east-central Florida, and to generate products that may enhance short-range (less than 6-hr) forecasts. LDIS analyses allow forecasters to quickly examine many disparate data sets within a single framework, to assist in assessing local weather changes in a high temporal and geographic resolution.
Efforts during 2003 and 2004 built upon the earlier LDIS work to configure a mesoscale prognostic model, using LDIS analyses to improve the model initialization. WFO MLB forecasters now routinely examine real time LDIS analyses and mesoscale prognostics upon the Advanced Weather Interactive Processing System (AWIPS), the primary NWS meteorological data integration system. With the porting of output to AWIPS, direct comparisons can now be made between the externally generated analyses and forecasts (ADAS and ARPS) and the AWIPS platform packages (Local Analysis and Prediction System; LAPS, and the Rapid Update Cycle; RUC).
In addition, the analysis and forecast fields are also available for populating initial forecast fields within the AWIPS Graphical Forecast Editor (GFE). LDIS analyses and forecast output can be viewed outside of AWIPS via a series of images uploaded to the World Wide Web (WWW).
LDIS CONFIGURATION AT WFO MELBOURNE
The current configuration at WFO MLB runs on an HP 785/C3000 and uses the Advanced Regional Prediction System (ARPS) Data Analysis System (ADAS) to generate analyses. The ADAS code was obtained from the Center for Analysis and Prediction of Storms (CAPS) in Norman, Oklahoma. ADAS produces analyses on a single grid with 4-km horizontal spacing. The domain for the 4-km grid is shown in Fig. 1. The analysis cycle is run every 15 minutes, with the start of the cycle occurring 14 minutes after the valid time to allow retrieval of the various data sets from remote servers, and to account for inherent latencies of data. On average, output is available beginning 22 minutes after the actual valid time.
REAL TIME DATA INGEST
Certain data sets available to the Melbourne forecasters are unique when compared to what is available at other NWS offices due to the relatively dense network of instrumentation supporting the U.S. space program in the vicinity of Cape Canaveral. Data from the KSC meso-network (Fig. 2) include: 44 wind towers, five 915-MHz boundary-layer Doppler radar wind profilers, and a 50-MHz radar wind profiler. Additionally, surface observations are obtained from a network of rural agricultural sites via the University of Florida Automated Weather Network, as well as supplemental surface data from Automatic Position Reporting System Citizen Weather sites which are collected and redistributed by the NOAA Forecast Systems Laboratory (FSL). Real time Aircraft Communications Addressing and Reporting System data is ingested to improve analyses aloft, also courtesy of FSL. These later three data sets will be discussed in more detail below. Additional data which are available for ingest into the LDIS include GOES-8 1-km visible and 4-km infrared satellite imagery, METAR surface reports, and Melbourne WSR-88D Level-II reflectivity and radial velocity fields. The local data sets which are currently ingested into ADAS are summarized below in Table 1.
ADAS uses 40-km Rapid Update Cycle (RUC) model forecasts for background fields to the 4-km analyses. The RUC 1-3 hr forecasts are linearly interpolated in time every 15 minutes to provide a background field for the analyses.
Surface observations, KSC meso-network tower winds, profiler data, as well as visible and infrared satellite imagery are collected for assimilation into the ADAS every 15 minutes. These data files originate from the NASA/NWS Spaceflight Meteorology Group (SMG) Meteorological Interactive Data Display System (MIDDS) at the Johnson Space Center in Houston, Texas. At present, the data are routed to the Melbourne WFO via a server at the NWS Southern Region Headquarters in Ft. Worth, Texas, using multiple-scheduled FTP sessions. This indirect communication process is mandated by NASA security concerns.
|
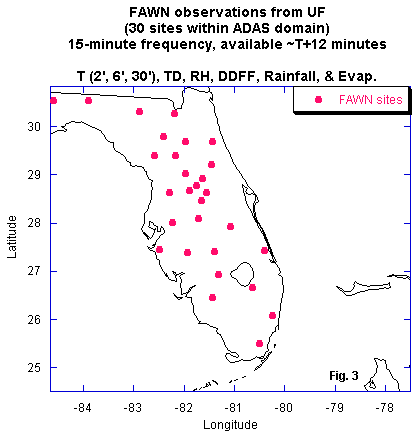
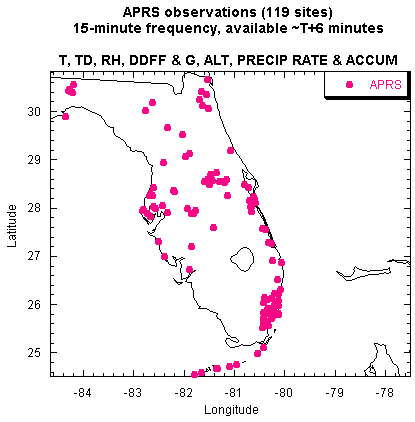
Surface observations are also obtained from 30 rural sites via the University of Florida Automated Weather Network (FAWN; see Fig. 3) every 15-minutes. These sites can provide significant improvements to the background analysis fields by adding temperature, moisture, and wind measurements from areas removed from the traditional network of airport METAR sites. Another source of surface observations which are ingested into the analyses include Automatic Position Reporting System (APRS; see Fig. 4) sites. These data are obtained from individuals who operate neighborhood weather stations and distribute their observations via Amateur (ham) packet radio and the internet. Once the APRS site configures their station for transmission of the data to the internet and "registers" with FSL, a data file is updated every 15 minutes for redistribution over the internet for external use, such as ingest into the MLB ADAS.
 |
 |
While a significant volume of the data ingest to ADAS originates near the surface, observations from aloft are obtained as well. With the expansion and improved distribution of the Aircraft Communications Addressing and Reporting System (ACARS) over recent years, this data set has become increasingly useful. ACARS data files (winds and temperatures) are currently retrieved every 15-minutes from FSL through the UCAResearch Unidata Local Data Manager (LDM), which is run on a local workstation. The quantity and altitude of observations vary significantly throughout the day. Typically, a multitude of observations are available from around sunrise to late in the evening, with several hundred data points ingested each analysis cycle. Conversely, a relative minima of data availability occurs during the early morning hours. Fig. 5 provides an example of a one hour period of wind observations encompassing the area of the ADAS domain.
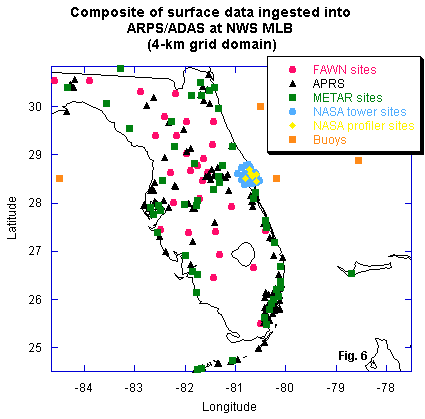
By combining all available surface data sets from across the Florida peninsula, an impressive data array is obtained for model initialization. Fig. 6 (below) depicts the current availability of combined data sites within 4-km grid domain. Of particular interest is the especially dense NASA tower/profiler network and the highly beneficial FAWN observations from rural interior peninsula locations. Observations from all the data sets shown below are obtained with a frequency of 15-minutes or less, with the exception of the METARs. ADAS currently ingests only routine (for top of the hour analyses) and 'special' (when certain criteria are met) METARs. Efforts continue to acquire an avenue for the ingest of METAR data on a 15-minute interval as well.
 An illustration of the data flow paths to and from the WFO MLB LDIS is provided in Fig. 7. High resolution Level-II Melbourne WSR-88D data are incorporated into the ADAS analyses via two independent workstations. One workstation collects the Level-II base data from the Radar Data Acquisition unit and re-distributes it through a local Base Data Distribution Server (BDDS), designed by the National Severe Storms Laboratory. A second workstation retrieves data from the BDDS through the LDM, using software developed under the Collaborative Radar Acquisition Field Test (CRAFT). CRAFT allows for the real-time compression and transmission of WSR-88D base data across the Internet. The file system containing the Level-II data ingested by LDM is mounted so that the workstation running ADAS can access and re-map the radar data to each analysis grid. Satellite files and NASA mesonet data are retrieved from SMG via a server at SRH. ACARS and APRS data files are obtained from FSL through the SRH frame relay. FAWN data files are obtained from a UF server via FTP and the RUC 1-3 hour forecasts for background initialization are obtained from the NWS Telecommunications Gateway server. ADAS analyses are converted to NetCDF format for ingest into the AWIPS Local Data Acquisition and Dissemination (LDAD) and displayed upon AWIPS workstations. External distribution to the WWW in Graphics Interchange Format (GIF) takes place upon another workstation.
MESOSCALE PROGNOSTICS
During the first half of 2003, WFO MLB acquired and configured a 10-node, 20-processor Linux cluster to run the numerical weather prediction model ARPS (Advanced Regional Prediction System). The current hardware provides for the generation of a 0 to 9 hour forecast with a processing and graphic generation time of 3.5 h. The 9-hour forecast length was chosen to maximize the frequency of forecast updates with fresh ADAS observational analyses under the current hardware constraints. Four ARPS runs are initialized each day at 03, 09, 15 and 21 UTC. The ARPS output is on the same 177 by 177 domain and 4-km horizontal resolution as ADAS. The model contains 45 vertical levels and current post-processing strategies produce a temporal resolution of 30 min. Model output is post processed as forecast increments are finished, providing guidance to the forecaster as timely as possible.
The MLB ARPS uses the 3-12 hour, 40-km RUC forecast as its background field and lateral boundary conditions. At the start of each model run, an Intermittent Data Assimilation (IDA) cycle is completed. The IDA cycle incorporates observational data into the ARPS model by alternating between ADAS analyses that initialize very short range ARPS forecasts over a specified time interval (Case 2003). The IDA is typically run over a one hour pre-forecast period, but can be adjusted to any length of time. An IDA strategy has been instituted to start the ARPS forecast model with as much mesoscale detail as possible. At the start of the IDA, the RUC 2-h forecast is used as the first guess field for the initial ADAS. This first ADAS analysis is then used to initialize a short 15 min ARPS forecast interval. Following this 15 min forecast interval, a second ADAS analysis is generated with a complete set of new observational data and uses the ARPS 15 min forecast as its first guess field. This process of generating new ADAS analyses and then 15 min ARPS forecasts continues through the entire IDA cycle. The last ADAS analysis is used to initialize ARPS as it begins the 9-hour forecast.
Since July 2003, ARPS has been run routinely at WFO Melbourne, in an experimental mode. Selected forecast fields are created and posted to a WWW page, with a temporal resolution of 30 min. By early 2004, prognostic output began to be ported routinely to AWIPS as it become available, with a time resolution of 1-hour. Forecast fields are also available for 'first-guess' populating of AWIPS GFE forecast grids.
|
Updates:
FUTURE INITIATIVES 
The configuration of ADAS and the routine generation of real-time analyses were completed at the Melbourne NWS office during the spring of 2001. A post-configuration AMU task conducted during 2002 and 2003 involved familiarizing the entire operational staff with using the integrated data analysis package to support various forecast programs. During this time, analysis fields continued to be examined in an operational environment, and optimization of the ADAS configuration package was performed to improve reliability and operational usefulness. In addition, GEMPAK and GARP scripts were customized further to offer greater display functionality. These efforts prepared forecasters for assimilating current conditions following an organized process, as opposed to viewing disparate data sets and integrating them manually to form a mental picture of the atmosphere.
During the next year, integrating WSR-88D Level-II data from surrounding sites, initially Miami, then Jacksonville and Tampa (and perhaps Tallahassee and Key West) will be pursued to help provide additional low-level velocity and reflectivity data within ADAS domain. Additional data sets will be evaluated for potential inclusion into the ADAS analyses (e.g. intermediate METARs, GPS IPW, WFO Miami Handar sites, CMANs, USF Comps data, forestry RAWS data, FDOT RWIS sites, and observations from the new Seminole county mesonet). Increased bandwidth is also sought to allow receipt of improved resolution background fields (e.g. transition to the 20-km RUC, from the 40-km RUC).
In addition, a new LINUX workstation has been procured, to allow expansion of the ADAS/ARPS grid domains to cover the entire state of Florida, currently planned for mid 2004. In addition, a second new workstation will allow for faster generation of analyses and forecasts for the WWW, and for an expansion of the graphical product suite (e.g. current and forecast conditions, meteograms, etc.). Also, the version of ARPS being run at WFO Melbourne will be transitioned to the most recent version of the software. One advantage of the latest ARPS software is more efficient code which should allow forecasts to complete in less time, and therefore become even more operationally useful. Finally, both ADAS and ARPS output will be examined closely and compared to ground-truth, and efforts will be made to modify adaptable parameters to further improve accuracy.
For questions, comments, and feedback concerning the Mesoscale Modeling Project at NWS Melbourne, please email Matt Volkmer or Dave Sharp.

