| The NWS Melbourne IMPACT Meteorology Unit (IMU) seeks to develop innovative products and applications for the improvement of high-impact weather forecasts and warnings within East Central Florida – ultimately, acting to save lives and protect property. The transition of such efforts into the operational forecast process achieves many benefits, including improved forecaster efficiency and enhanced communication of daily weather hazard threats to proactively enable decision-makers for individual and emergency planning, response, and recovery. |
|
 |
Impact Weather Graphicast
NWS Melbourne meteorologist provide a tabbed web-based Graphicast and outlook text for short term weather impacts over the next 3 to 9 hours. Graphicasts will be routinely available on the front page of Melbourne website, typically in one of the first two tabs.
|
 |
Weather Conditions - Current
Locally generated analyses depict, in high detail, the current state of the atmosphere across Florida every 15 minutes. The graphics incorporate data from a large number of official and nonofficial sources, including airport and NASA observations, as well as information from school and private citizen weather stations. All available data is assimilated within a model-initialized atmosphere to provide a comprehensive view of the current weather conditions.
|
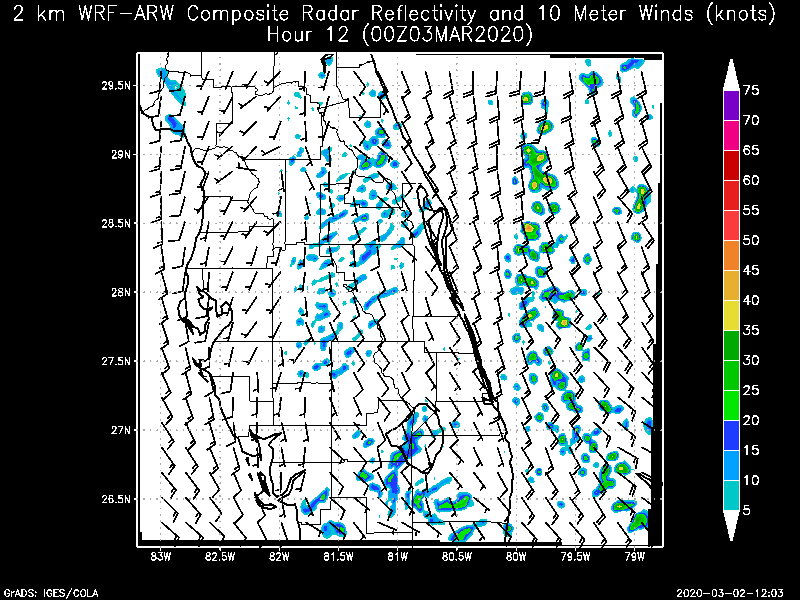 |
High Resolution Model Forecasts
Forecasters synthesize the National Blend of Models (NBM) and high resolution model guidance to arrive at the final 'official' forecast. The following link has has high resolution models from the HREF system hosted by the Storm Prediction Center.
|
 |
Weather Hazards - Today/Tonight
Several times each day, forecasters provide a graphical assessment of the threat potential for more than a dozen possible hazards which can impact East Central Florida. The graphical hazards cover the 'today and tonight' period and depict weather threats on a 5-level scale from "no threat" to an "extreme threat" and they illustrate the geographic extent of the threat areas.
|
 |
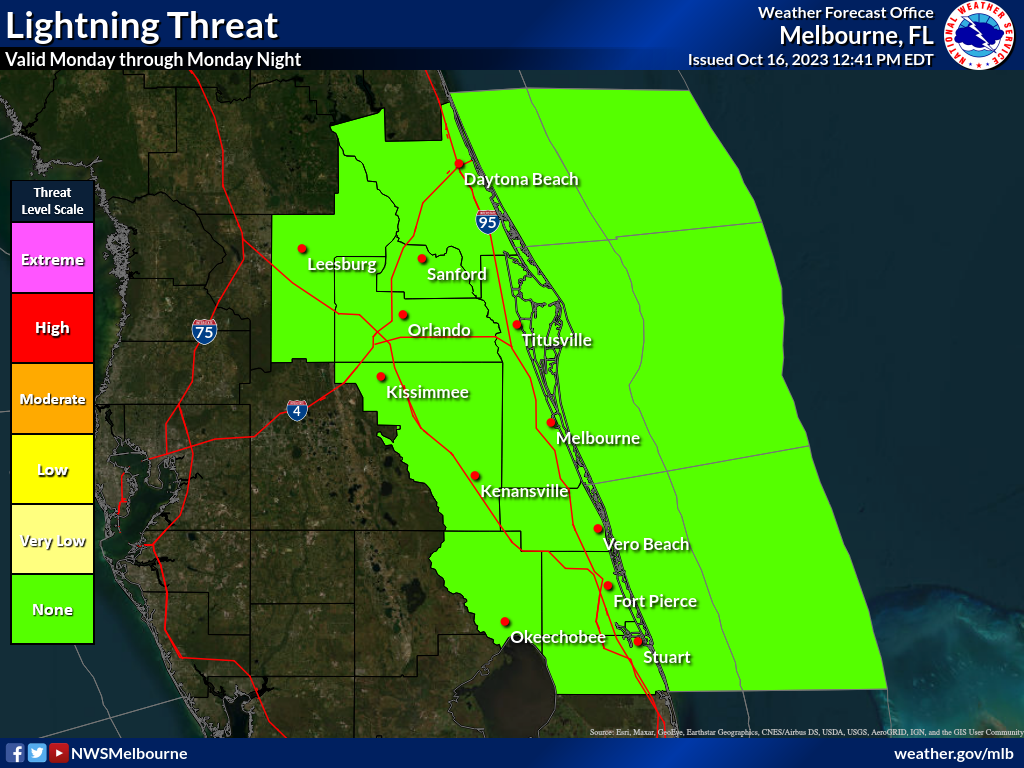
Lightning Threat
Over 10 years of lightning data are used to produce a climatology (history) of ground strike density and frequency, based on different prevailing wind patterns. These data are used by forecasters as an initial indication of lightning storm occurrence, then they are manually adjusted after taking into account other variables, as well as interjecting forecaster expertise.
|
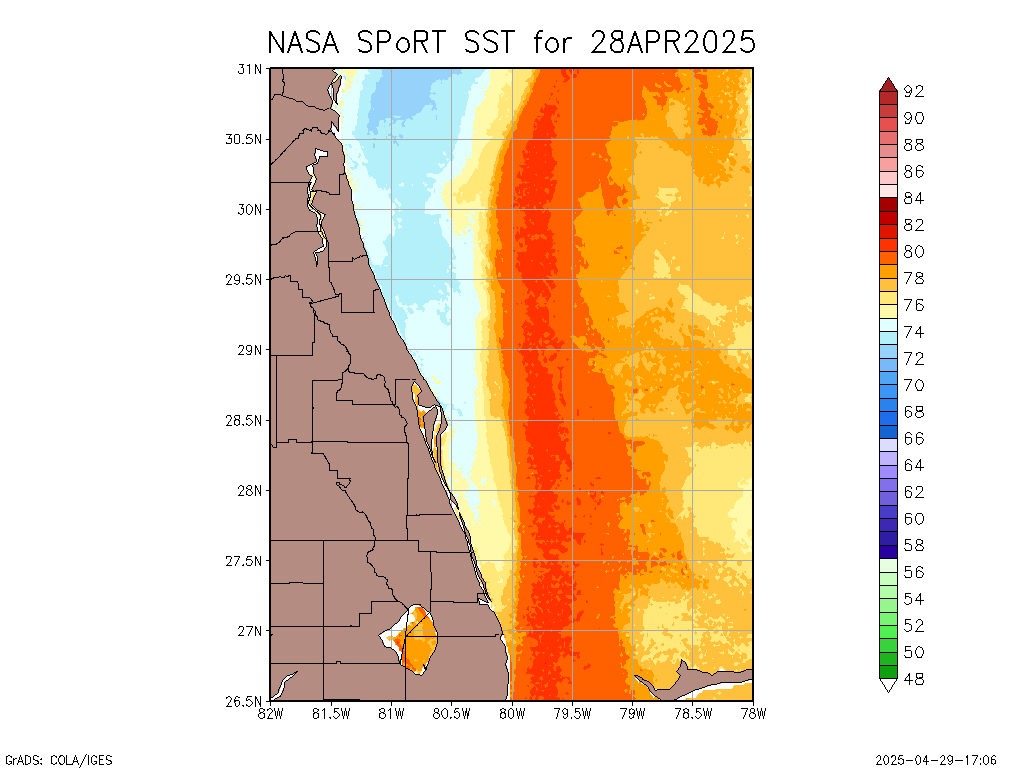 |
MODIS SST Composite
This is a locally generated multiday composite of the MODIS SST composite product from NASA SPoRT. The data is very high resolution at 1 km and gathered by the MODIS instruments on the Terra and Aqua polar orbiting satellites. The National Weather Service in Melbourne uses this data operationally to discern the approximate location of the west wall of the gulf stream in the East Central Florida Atlantic Coastal Waters Forecast.
|
| |
|
|
Turning Science into Service
|
Disclaimer: These products and images will not be available at all times, may be terminated at any time, and timely delivery is not guaranteed. Before using information obtained from these products, special attention should be given to the date & time of the data and products being displayed. Consult official NWS products obtained through an official dissemination system.
|
|