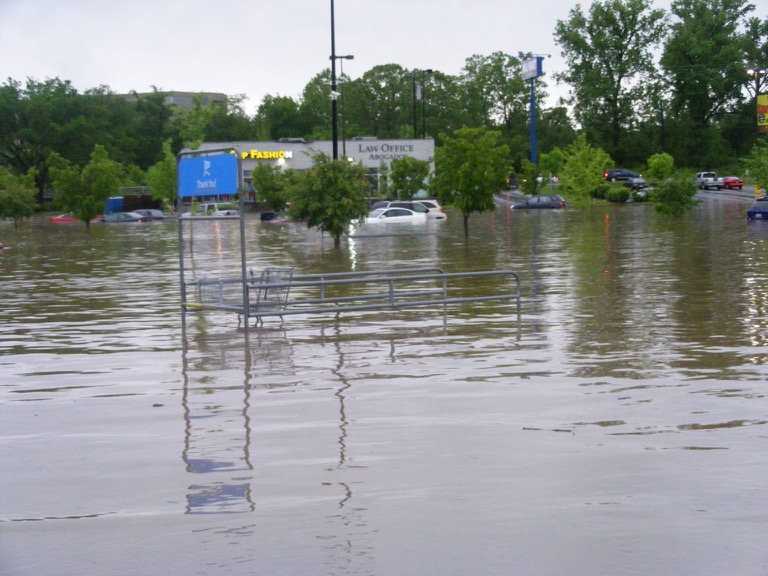
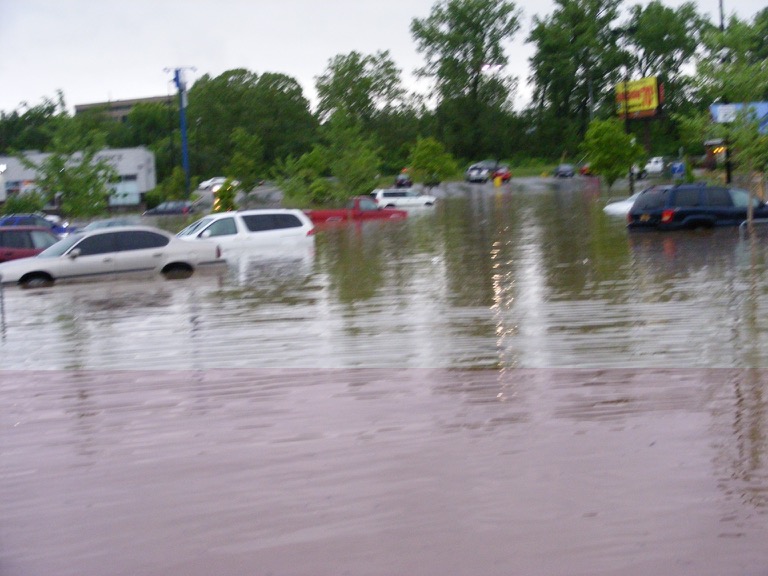
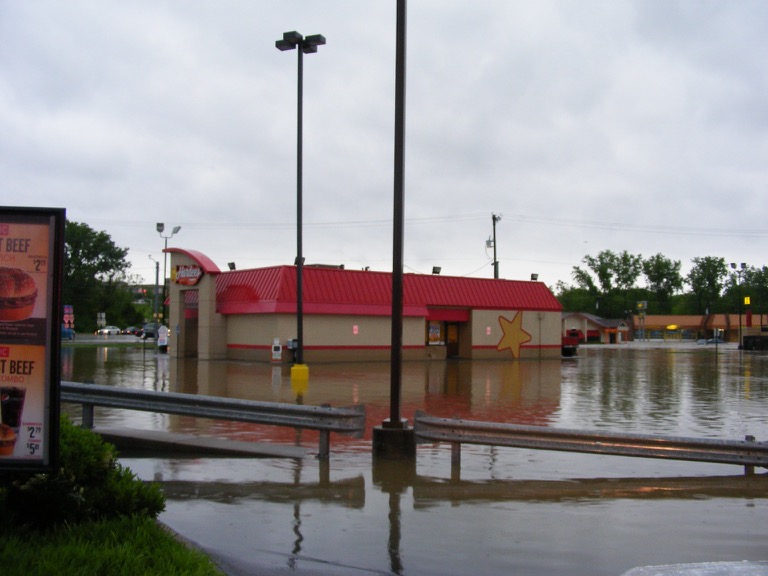
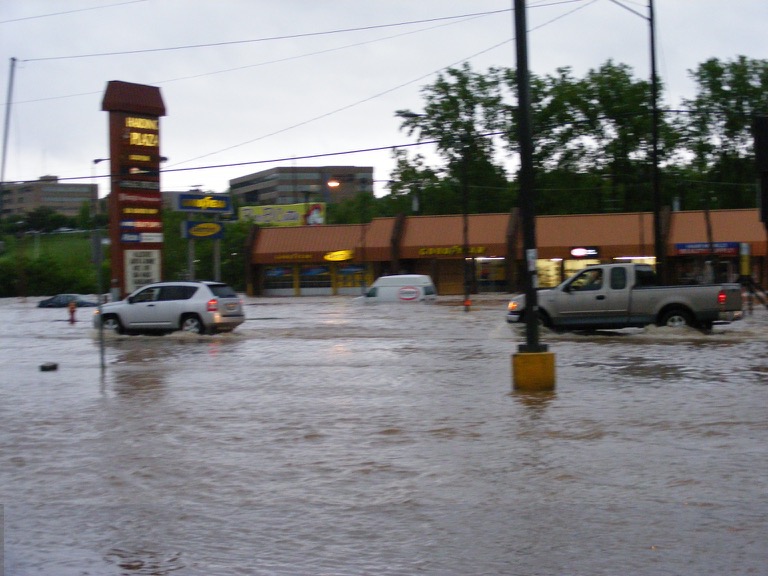
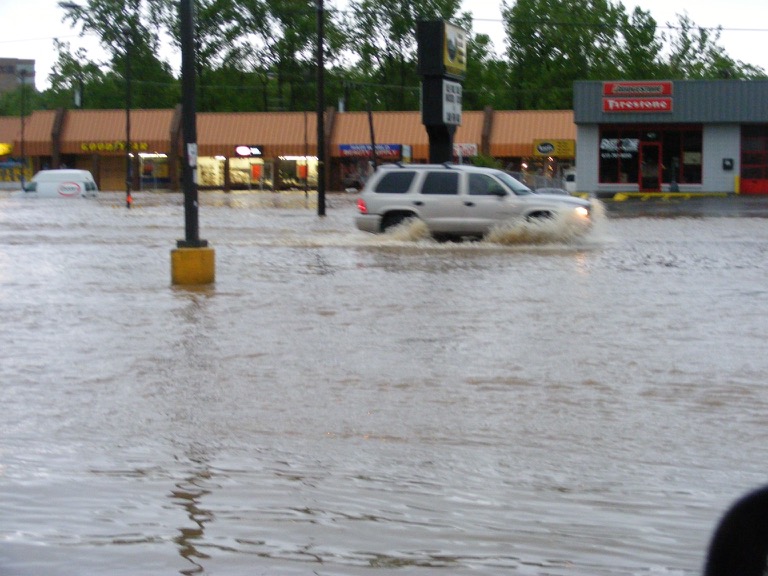
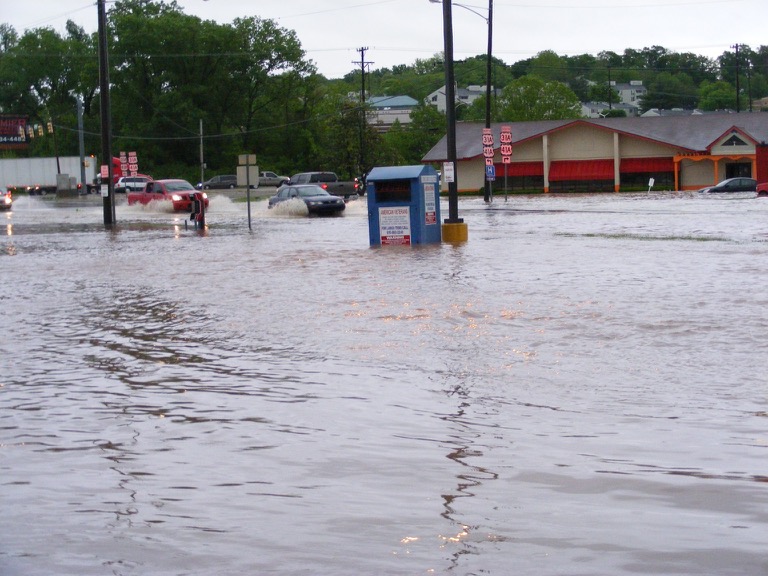
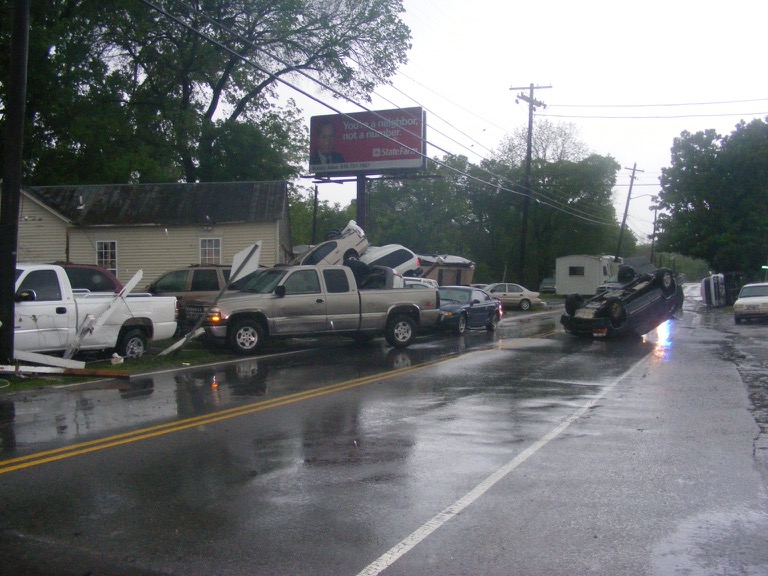
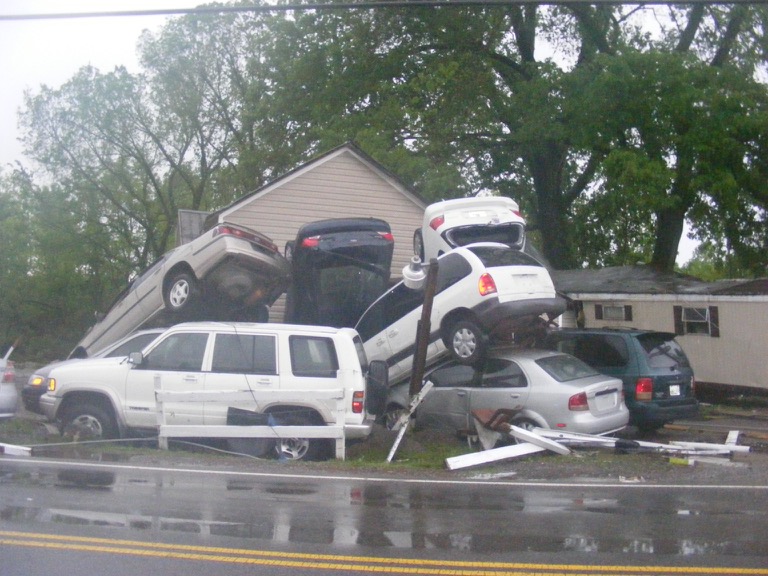
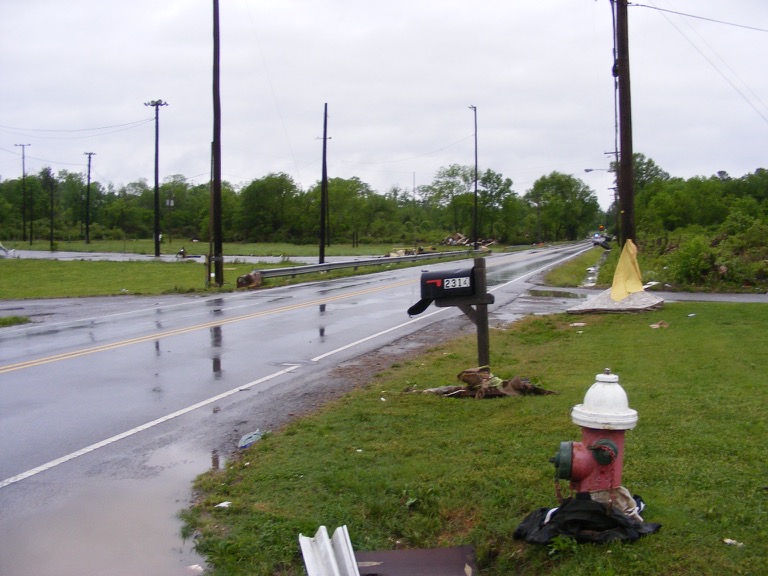
The torrential rains and catastrophic flooding of May 1-3, 2010, will be remembered for many years by Middle Tennesseans. Back-to-back record breaking rains fell on Saturday, May 1, and again on Sunday, May 2, causing widespread flash flooding and river flooding across much of the mid state. The storm killed 18 people in Middle Tennessee and at least 27 in all of Tennessee and Kentucky. Property damage estimates are hard to develop and vary widely, but they totaled into the billions of dollars and helped prompt a Presidential Disaster Declaration for many counties in West and Middle Tennessee. To worsen matters, the region had several rounds of severe thunderstorms, some of which caused extensive wind damage and tornadoes.
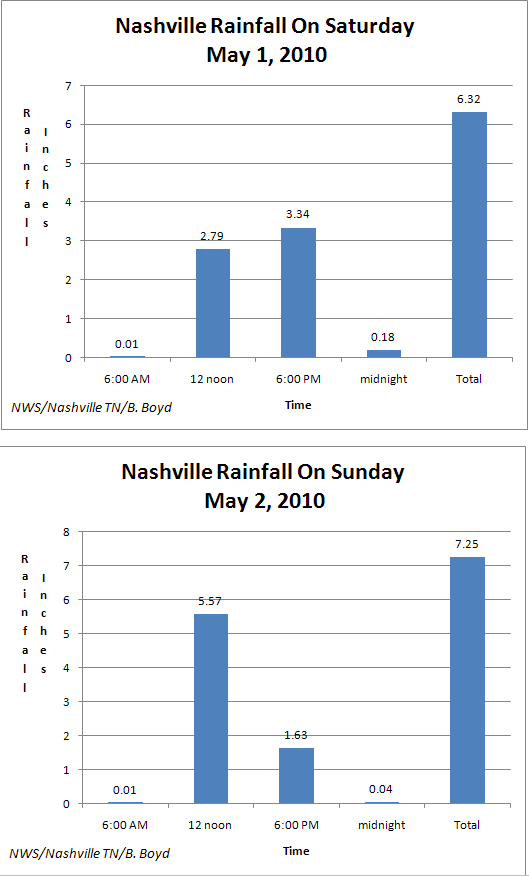
Nashville experienced its all-time rainiest day AND third-rainiest day on back-to-back days. The National Weather Service in Nashville has rainfall data back to the early 1870s – that’s over 50,000 days of observations. Rainfall of 6.32 inches on Saturday, May 1, at Nashville International Airport was the second highest amount ever measured in a day. That ranking lasted for just one day because the rain that fell on Sunday, May 2, (7.25 inches) established a new record amount of precipitation. The total of 13.57 inches absolutely demolished the previous two-day record of 6.68 inches.
Several weather factors caused this complex disaster. The main culprit was a very slow-moving low pressure system at upper levels of the atmosphere. Also, a front stalled just west of Tennessee and we had a plume of unusually rich moisture from the tropics that took dead aim on Tennessee. A long-lived outflow boundary caused by the initial round of heavy rains on Saturday morning helped focus additional heavy rains later in the weekend.
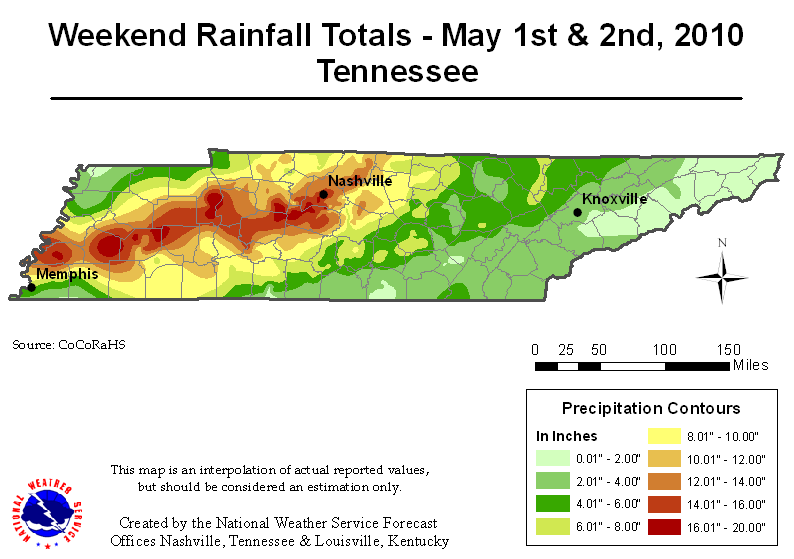
Rainfall records were shattered on May 1st and May 2nd, 2010 due to the copious amounts of rain that fell across Middle Tennessee.
In Nashville, a new 24-hour rainfall record was established when 9.09 inches of rain fell on May 1st and May 2nd
The old record was 6.68 inches set previously on September 13th and 14th 1979 during the remnants of Hurricane Frederic
A new two day rainfall record was established when 13.57 inches fell on May 1st and May 2nd
This shattered the previous record of 6.68 inches set on September 13th and 14th 1979
A new calendar day rainfall record was set when 7.25 inches of rain fell on May 2nd
The previous record was 6.60 inches set on September 13th 1979
This also established a new record for the most rainfall for any calendar day in Nashville's history
A new 12 hour rainfall record was also set when 7.20 inches fell on May 2nd
The previous record was 6.37 inches set on September 13th 1979
A new 6 hour rainfall record was also set when 5.57 inches fell
Previous record was 5.17 inches on September 13th 1979
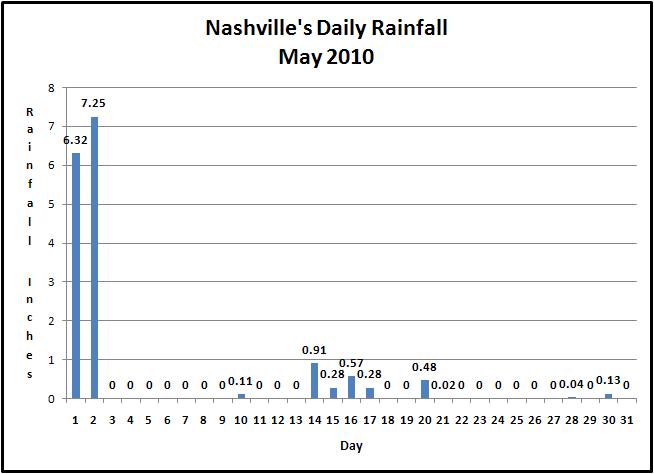
May 2010 will rank as the wettest may on record
Previously, May 1983 was the wettest with 11.04 inches
A Public Information Statement was issued on May 2, 2010 regarding the record rainfall totals:
PUBLIC INFORMATION STATEMENT NATIONAL WEATHER SERVICE NASHVILLE TN 717 PM CDT SUN MAY 2 2010 ...PUBLIC INFORMATION STATEMENT... AS OF 700 PM, NASHVILLE INTERNATIONAL AIRPORT HAS MEASURED 7.21 INCHES TODAY. THIS BREAKS THE RECORD FOR MOST RAIN IN A SINGLE CALENDAR DAY IN THE CITY`S HISTORY. THE PREVIOUS RECORD WAS 6.60 INCHES SET ON SEPTEMBER 13, 1979. THE TWO-DAY RAINFALL TOTAL NOW STANDS AT 13.53 INCHES. THIS MORE THAN DOUBLES THE PREVIOUS TWO-DAY RECORD OF 6.68 INCHES SET ON SEPTEMBER 13-14, 1979. YESTERDAY`S RAINFALL TOTAL OF 6.32 INCHES NOW RANKS AS THE 3RD GREATEST ONE-DAY RAINFALL TOTAL IN NASHVILLE`S HISTORY. TWO OTHER RAINFALL RECORDS THAT WERE SET DURING THE 1979 EVENT WERE ALSO BROKEN TODAY. THE CITY SAW ITS GREATEST RAINFALL IN A SIX- HOUR PERIOD, 5.57 INCHES. AND THE RECORD FOR MOST RAINFALL IN 12 HOURS ALSO FELL, WITH 7.20 INCHES. MAY, 2010 NOW RANKS AS THE WETTEST MAY EVER, SURPASSING MAY, 1983, WHEN 11.04 INCHES WERE MEASURED. AND MAY, 2010 ALREADY RANKS AS THE FIFTH WETTEST MONTH OVERALL. $$ ROSE |
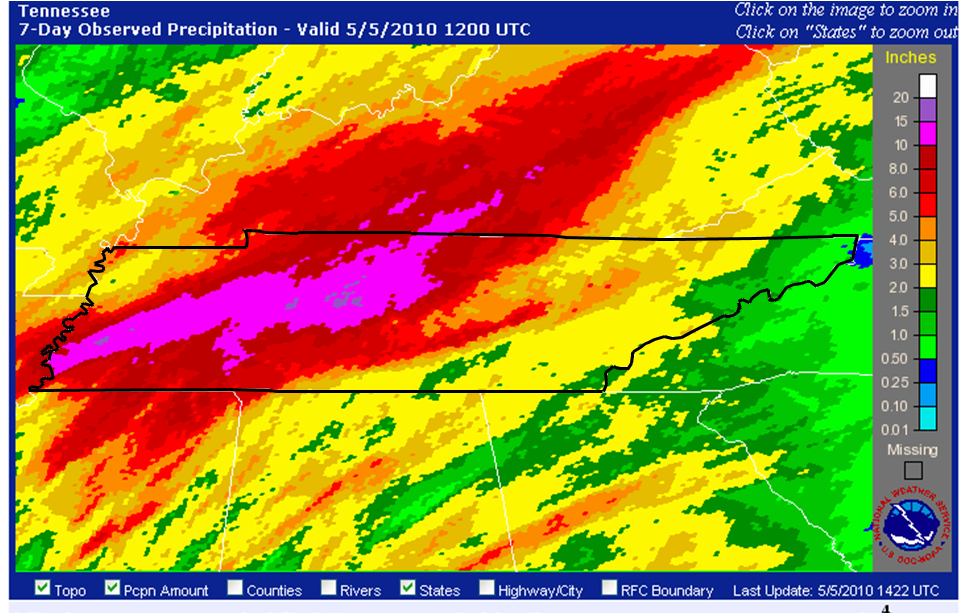
Gage Adjusted Radar Rainfall Estimates:
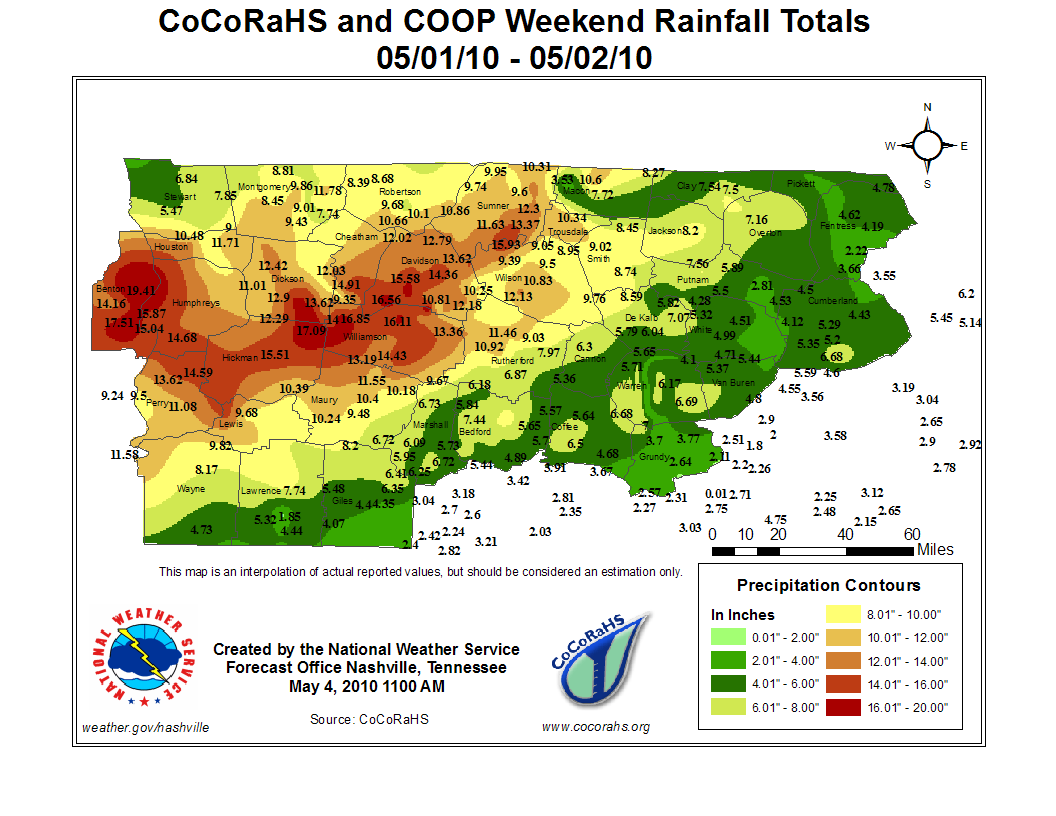
| 12 Highest Rainfall Totals - COOP and CoCoRaHS Observers | |
| Location | Total Two Day Rainfall |
| Camden 4.5 NE | 19.41" |
| Fairview 3.8 SW | 18.04" |
| Fairview 2.9 SW | 17.71" |
| Belle Meade 1.4 NNE | 17.67" |
| Mt Moriah Birdsong Marina | 17.51" |
| Brownsville 1.0 SE | 17.5" |
| Jackson 4.9 NW | 17.36" |
| Brentwood 2.5 NE | 17.15" |
| Bon Aqua 3.0 ESE | 17.09" |
| Brentwood 2.8 NE | 17.07" |
| Belle Meade 1.2 ESE | 17.02" |
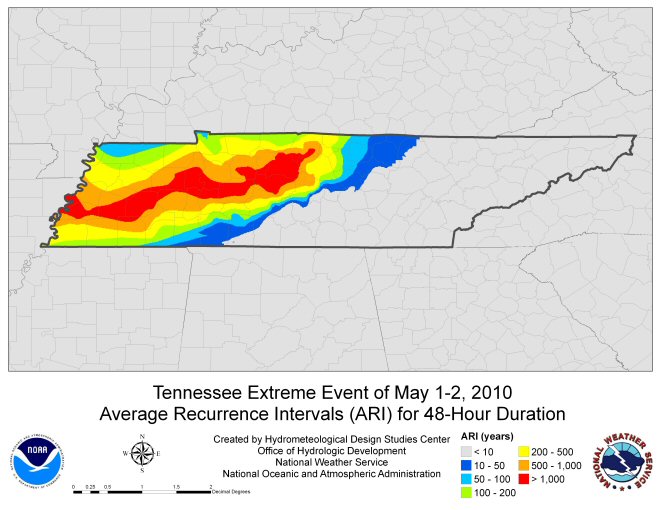
What is a 100 year flood? A 100 year flood is an event that statistically has a 1% chance of occurring in any given year. A 500 year flood has a 0.2% chance of occurring and a 1,000 year flood has a 0.1% chance of occurring.
The map below relates to amount of rainfall that fell to the chances of that amount of rain actually occurring.

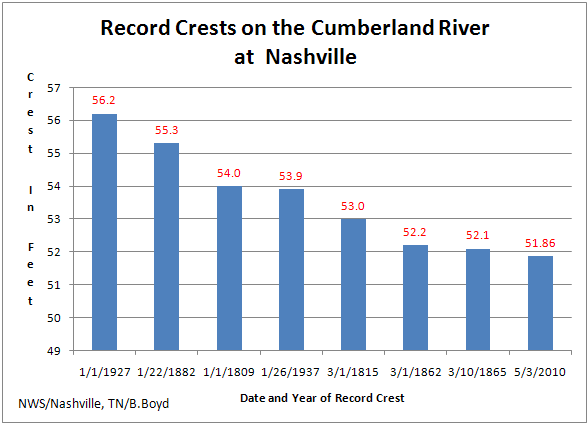
A flood event that sets a new record crest is something rarely seen, especially when records date back 50 to 100 years. The Cumberland River at Nashville caused tremendous damage when it rose to 52.55 feet (crested May 3), but still fell well short of the highest crest on record - 56.20 feet. This record crest was set back in 1927, before dams controlled the flow of the Cumberland and its tributaries. It has been speculated that if there was no control of the river, the water level in the May Flood would have come close to 56 feet in downtown Nashville. A record crest of 62.58 feet was set on the Cumberland River at Clarksville, which is just over 5 feet higher than the previous record crest of 57.10 feet set in the 1979 Flood. The Cumberland River at Clarksville rose not just from the water coming down the main-stem portion of the river, but also from the significant inflows from two major tributaries – the Red River and Harpeth River.
The Red River set a new record crest of 49.48 feet at the gauge near Port Royal, and the Harpeth River reached record levels at three locations on the river. The gauge at Franklin crested at 35.32 feet, which is just a few inches above the previous record of 35.14 feet set in 1948. Downstream at the gauges near Bellevue and Kingston Springs, the river level was so high it ended up washing the gauges away. High water marks show the river level at Bellevue reached 33.32 feet, which is almost 9 feet higher than the previous record of 24.34 feet set in 1948. Kingston Springs also saw an extreme river level surveyed with high water marks indicating a crest at 46 feet, which is about 14 feet higher than the previous record set in 1946. Gauge data for the Harpeth River at Bellevue and Kingston Springs dates back to the early 1920s, which really shows the magnitude of this event.
In the Nashville Metro area, many of the creeks and streams surpassed levels not seen since the 1979 Flood. Browns Creek at the State Fairgrounds crested at 13.44 feet which is 5 feet higher than the previous record set in 1993, and Whites Creek in Bordeaux crested at 25.82 feet, which is over 6 feet higher than the previous record set in 2002. The Mill Creek at Woodbine gauge set a new record crest of 21.37 feet and the Antioch gauge set a record crest of 26.10 feet. The previous record for Woodbine was 20.63 feet and the previous record for Antioch was 23.78 feet, both set in 1979. Richland Creek crested at 19.99 feet, which is almost 5 feet higher than the 1979 Flood level of 15.13 feet.
Elsewhere in Middle Tennessee, record levels were set on portions of the Duck River and Buffalo River. The Duck River near Hurricane Mills washed away the gauge and a crest of 34.21 feet was surveyed from high water marks (previous record 30.70 feet set in 1948). Upstream at Centerville, a record crest of 47.50 feet was set which is almost 10 feet higher than the 1948 crest of 37.58 feet. The Duck River at Columbia did not set a record crest, but did reach its 7th highest level on record with 44.91 feet. The Buffalo River near Lobelville crested at 26.00 feet, which is just above the previous record of 25.23 feet set in 1991, but is a flow of almost 17,000 cubic feet per second more. Upstream of Lobelville near Flat Woods, TN the Buffalo River crested at 32.69 feet which is just half of a foot higher than the previous record set in 1991. Records for the gauge at Flat Woods date back to 1921.
| Record or Near Record River Flood Levels Across Middle Tennessee | ||||
| Location | Record | Old Record | Date of Old Record | Flood Stage |
| Cumberland at Clarksville | *62.58' | 57.1' | March 14, 1975 | 46' |
| Cumberland at Nashville | *52.55' | 47.6' | March 15, 1975 | 40' |
| Red River near Port Royal | 49.48' | 48.3' | March 13, 1973 | 30' |
| Duck River at Centerville | 47.5' | 37.6' | February 14, 1948 | 22' |
| Harpeth River near Kingston Springs | 38' | 33.2' | January 7, 1946 | 20' |
| Duck River near Hurricane Mills | 33' | 30.7' | February 14, 1948 | 24' |
| Harpeth River at Bellevue | 33' | 24.3' | February 13, 1948 | 20' |
| Buffalo River near Lobelville | 25.7' | 25.2' | May 28, 1991 | 14' |
| Harpeth River at Franklin | **35.1' | 35.2' | February 13, 1968 | 30' |
| * HIGHEST SINCE FLOOD CONTROL INSTALLED IN 1950s & 1960s | ||||
| ** NEAR RECORD | ||||
A frontal boundary setup across Western and Middle Tennessee late Friday night (April 30), and remained through the weekend. A persistent southerly flow fed moisture into the area and precipitable water values rose to almost 2 inches, based on data from KOHX upper air soundings. As a series of shortwaves moved through, a band of showers and thunderstorms developed and remained nearly stationary for much of the day on Saturday, May 1st and Sunday, May 2nd, resulting in widespread record flooding across much of Middle Tennessee. Some of these thunderstorms became severe also, resulting in thunderstorm wind damage and six confirmed tornadoes across Middle Tennessee.
| # | Counties | Rating | Time (CST) | Length (miles) | Width (yards) | Fatalities | Injuries |
| 1 | Lawrence | EF0 | 1523 | 3.1 | 100 | 0 | 0 |
| 2 | Perry/Hickman | EF1/EF2 | 0345 | 16.1 | 600 | 0 | 1 |
| 3 | Hickman | EF2 | 0417 | 3.9 | 250 | 0 | 0 |
| 4 | Davidson | EF1 | 0507 | 3.6 | 300 | 0 | 0 |
| 5 | Sumner | EF1 | 0517 | 5.1 | 400 | 0 | 0 |
| 6 | Hickman | EF0 | 0545 | 2.7 | 50 | 0 | 0 |
| EF0 Lawrence County Tornado (#1) | |||||||
| An EF-0 tornado with maximum winds around 80 mph touched down near Loretto. The most significant damage extended from Brenda Avenue east-northeast to a residence off of Glendale Road. A couple dozen trees were uprooted and a few softwood trees were snapped. One home suffered some minor roof damage. | |||||||
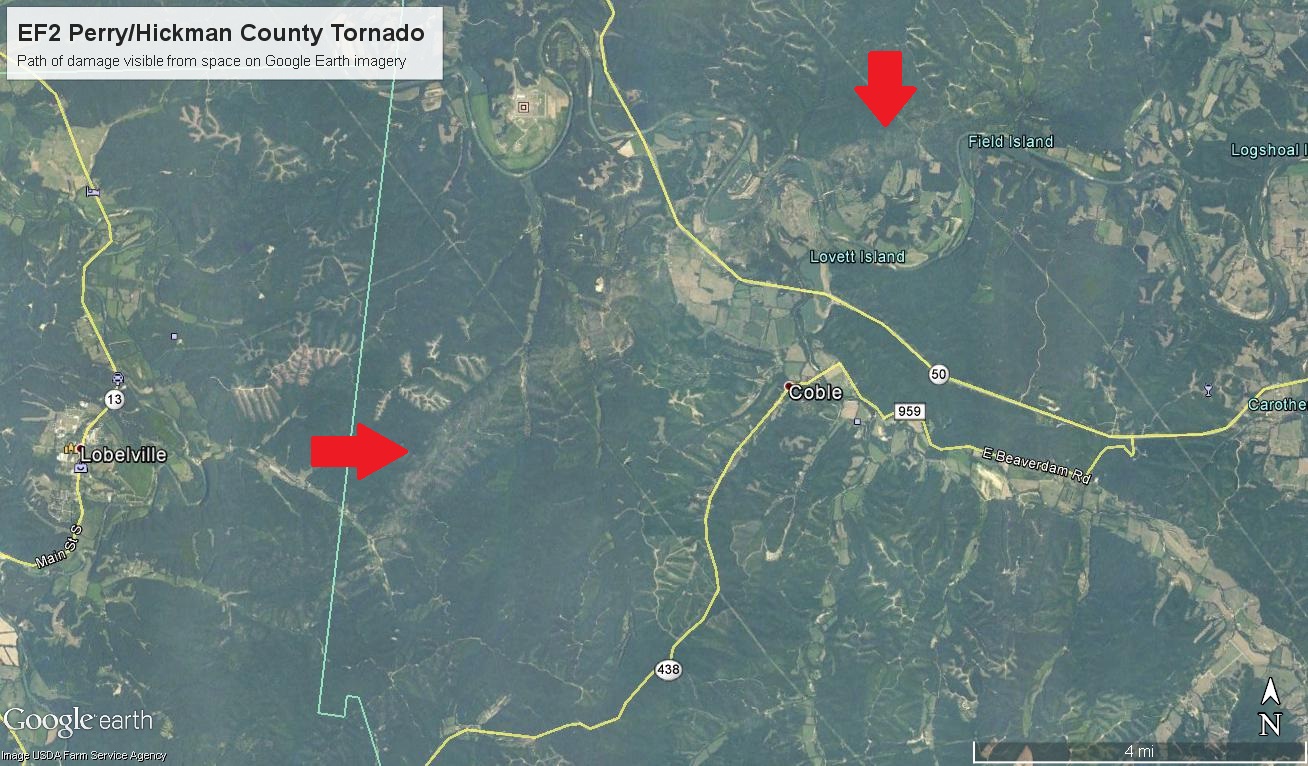
| EF2 Perry/Hickman County Tornado (#2) | |||||||
| A tornado touched down 2 miles southwest of Beardstown then moved northeast across eastern Perry County into Hickman County. Hundreds of trees were snapped and uprooted. A couple of outbuildings were destroyed and a home suffered some minor roof damage. Maximum wind speeds in the tornado were estimated to be in the EF1 range around 90 mph in Perry County. In Hickman County, thousands of hardwood trees were snapped and uprooted along the tornado's 9.15 mile track. Some trees were reduced down to stubs. The tornado was strongest as it crossed highway 50. A brick home suffered considerable structural damage and a woman was injured. Several barns were completely destroyed. The tornado was nearly 1/3 of a mile wide at this point. The last evidence of damage was near the intersection of Dodd Hollow and Piney Roads where a few trees were snapped. Maximum wind speeds in the tornado were estimated to be around 125 mph. | |||||||
 |
|||||||
| EF2 Hickman County Tornado (#3) | |||||||
| The same supercell thunderstorm that spawned the earlier EF2 tornado in western Hickman County produced another EF2 tornado that touched down 1 mile east-southeast of Graham Station. Hundreds of hardwood trees were snapped, several barns were destroyed, and a brick home suffered significant roof damage along the tornado's 3.9 mile track. The last evidence of damage was along Keys Branch Road. Maximum wind speeds in the tornado were estimated to be around 110 mph. | |||||||
| EF1 Davidson County Tornado (#4) | |||||||
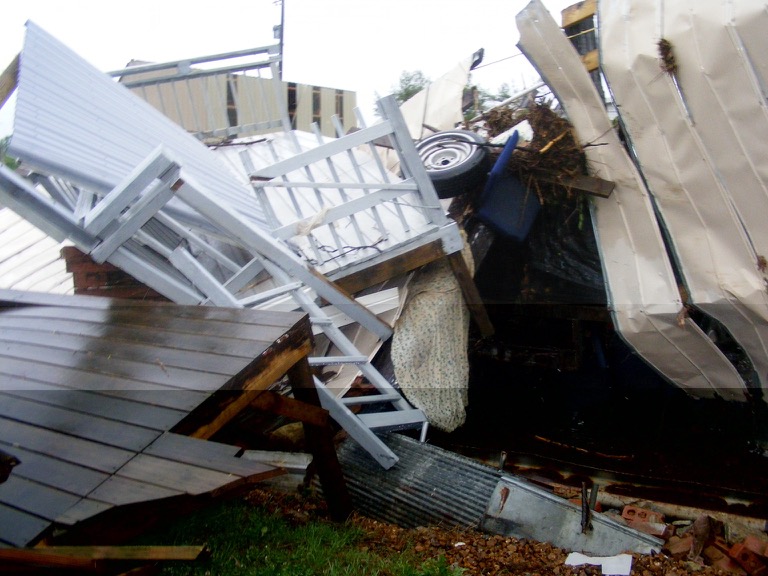
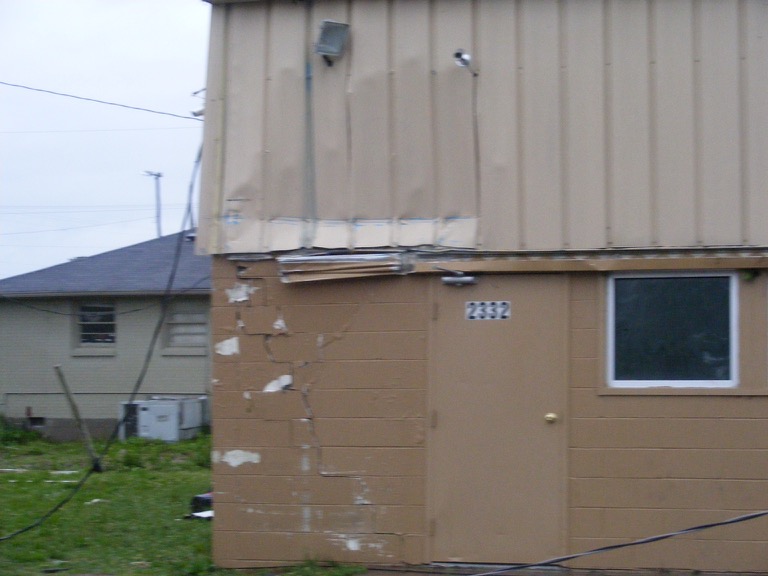
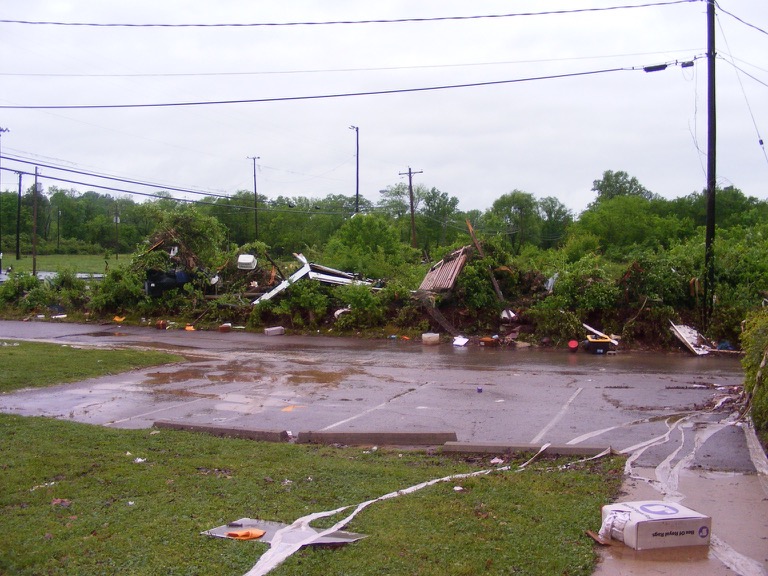
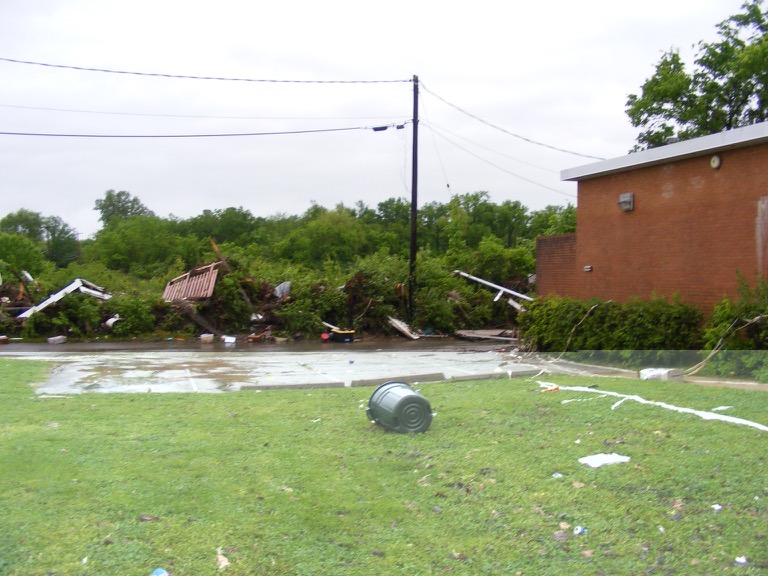
| The same supercell thunderstorm that spawned the earlier tornadoes in Perry and Hickman counties produced two more tornadoes in Davidson and Sumner counties. The initial touchdown of this EF1 tornado was near the intersection of South Dickerson Pike and Old Dickerson Pike in northeast Davidson county. Trees were snapped, trailers suffered roof and underpinning damage, and an old building had its roof removed. Damage continued to the northeast for over 3.5 miles, and consisted of minor roof uplifting along with hundreds of snapped trees. The tornado crossed Rivergate Parkway at the Rivergate Mall. It blew over power poles and business signs. Several large projectiles impacted the Mall's facade, leaving craters as high as 30 feet off the ground. The last evidence of damage was to business signs just east of Rivergate Mall on Gallatin Pike. Maximum wind speeds in the tornado were estimated to be around 105 mph. | |||||||
| EF1 Sumner County Tornado (#5) | |||||||
| After the previous tornado east of Rivergate Mall lifted, another EF1 tornado touched down several miles further northeast into Sumner County near the intersection of Forest Retreat Road and Hunts Lane, just north of Highway 386. Damage consisted of hundreds of snapped hardwood trees and minor roof damage was then continuous to the northeast for 5 miles. The most significant damage, high end EF1, occurred on Kimber Lane just off highway 258. An older home was picked up partially off its foundation and suffered significant roof damage. The last evidence of damage was near the intersection of Latimer Circle and Long Hollow Pike. Maximum wind speeds in the tornado were estimated to be around 105 mph. | |||||||
| EF1 Hickman County Tornado (#6) | |||||||
| A short lived EF1 Tornado, with maximum winds of 100 MPH, touchdown in Hickman County three tenths of a mile north of the intersection of Ben Fly Road and Beech Valley Road. Path length was 2.73 miles, with a width of 50 yards. Numerous hard wood trees were uprooted and snapped. | |||||||
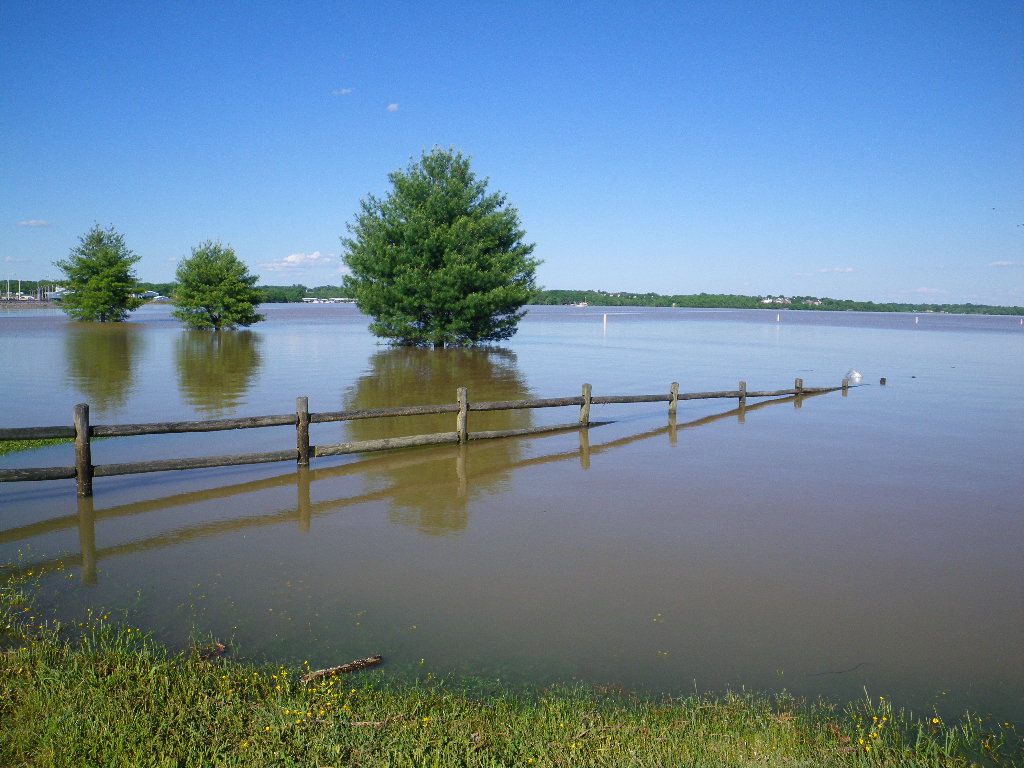
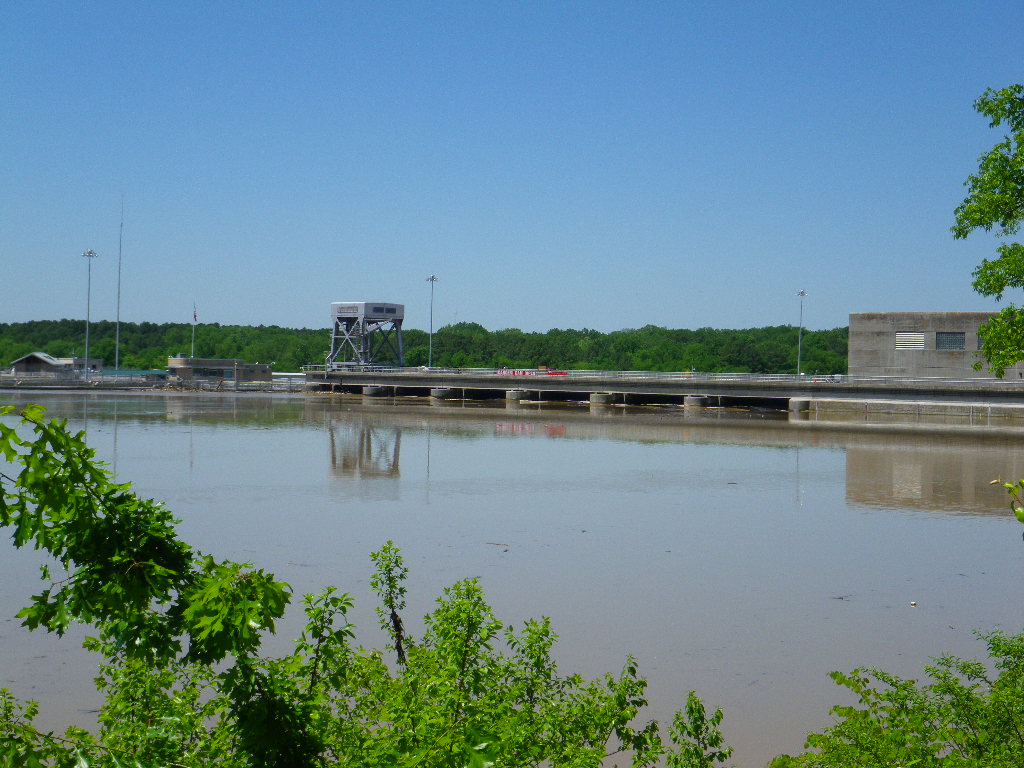
| Old Hickory Lake just above Old Hickory Dam on May 3, 2010 Photo by Bobby Boyd, NWS Nashville Forecaster |
 |
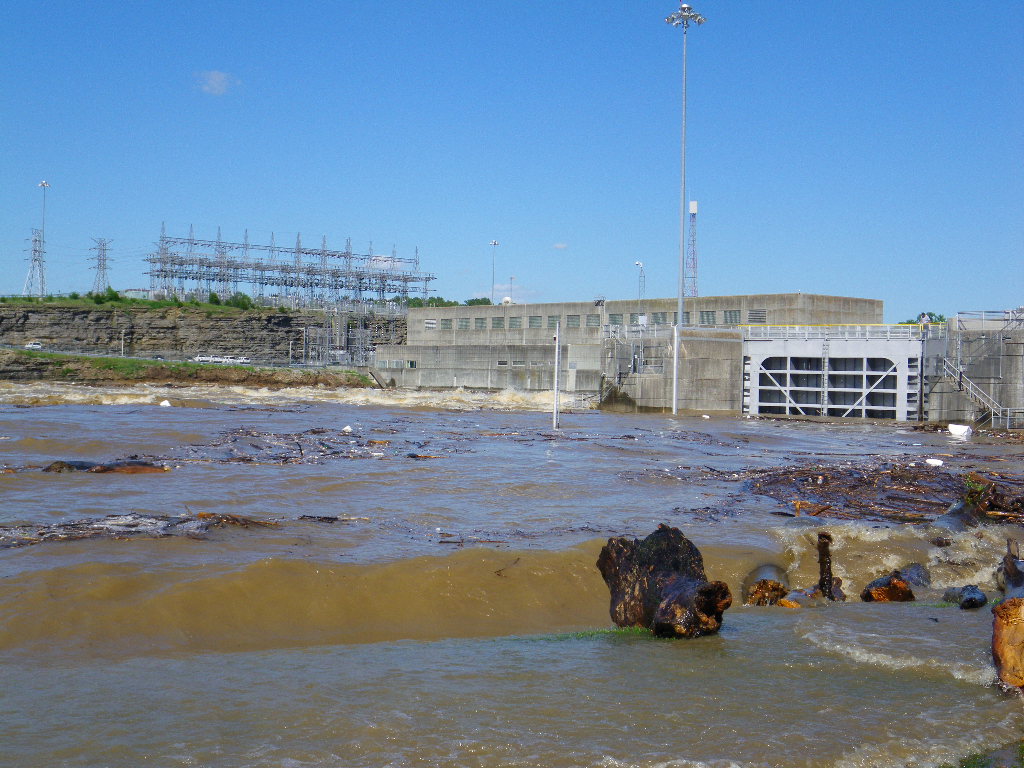
| Below Old Hickory Dam on May 3, 2010 Photo by Bobby Boyd, NWS Nashville Forecaster |
 |
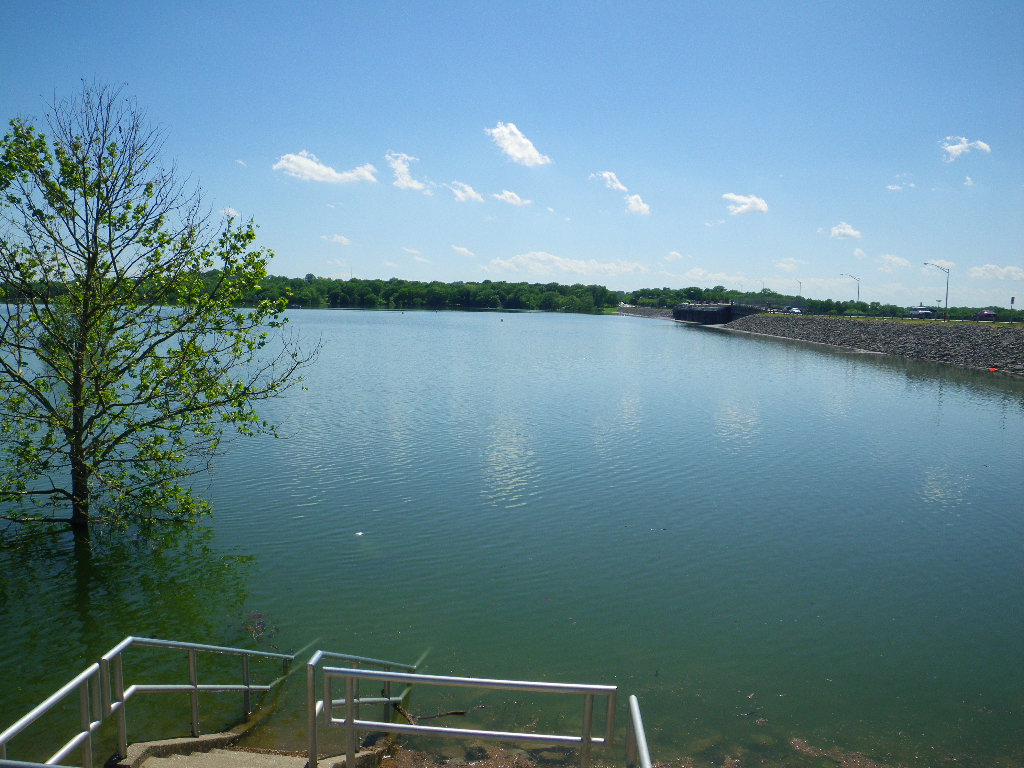
| Headwater on Old Hickory Lake on May 4, 2010 Photo by Bobby Boyd, NWS Nashville Forecaster |
 |
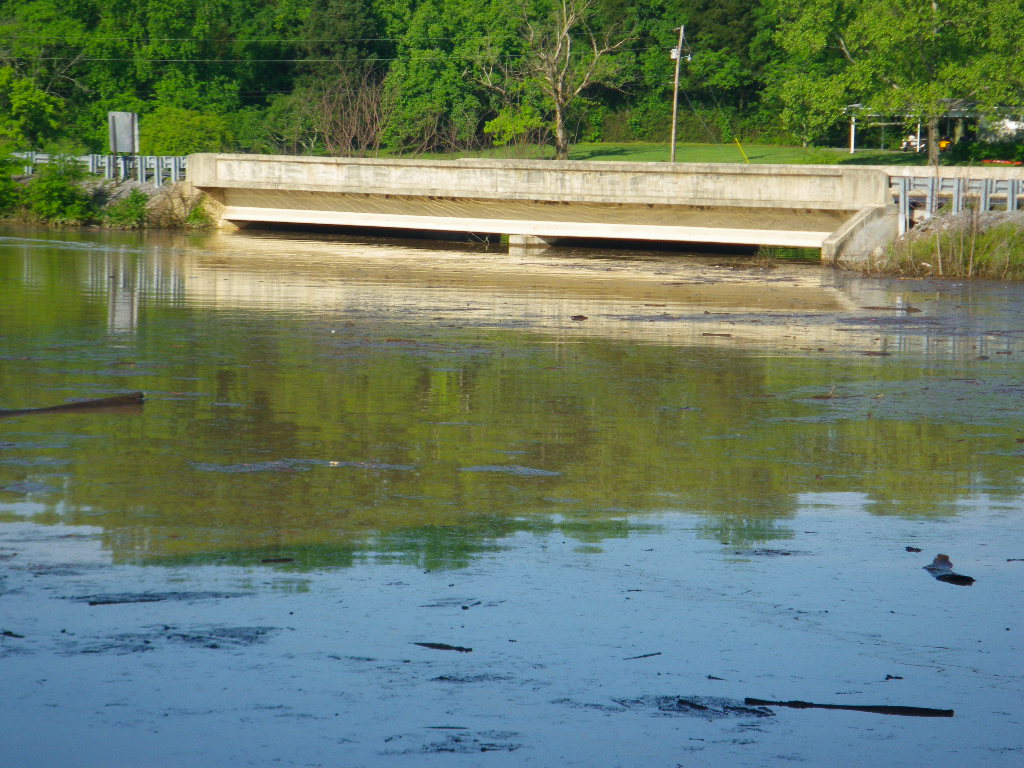
| Bridge across Langford Cove in Old Hickory, TN on May 3, 2010 Photo by Bobby Boyd, NWS Nashville Forecaster |
 |
| Percy Priest Lake on May 4, 2010 Photo by Bobby Boyd, NWS Nashville Forecaster |
 |
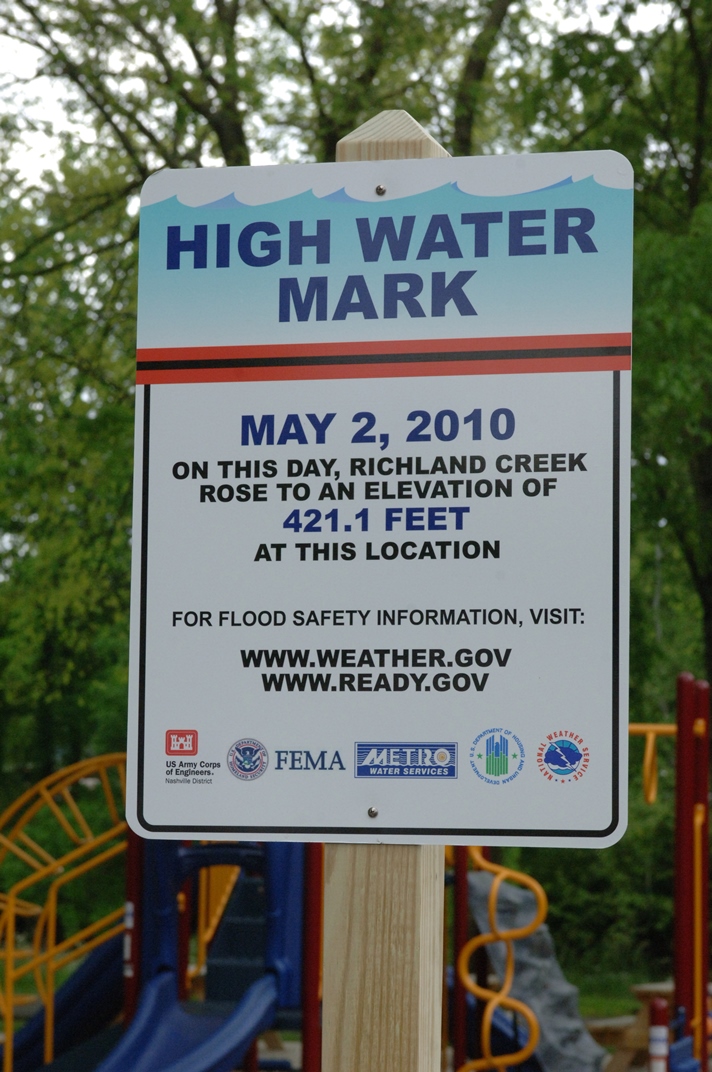
| High Water Mark established May 2, 2013 in England Park, Nashville TN Photo by Mr. Leon Roberts (USACE) |
 |
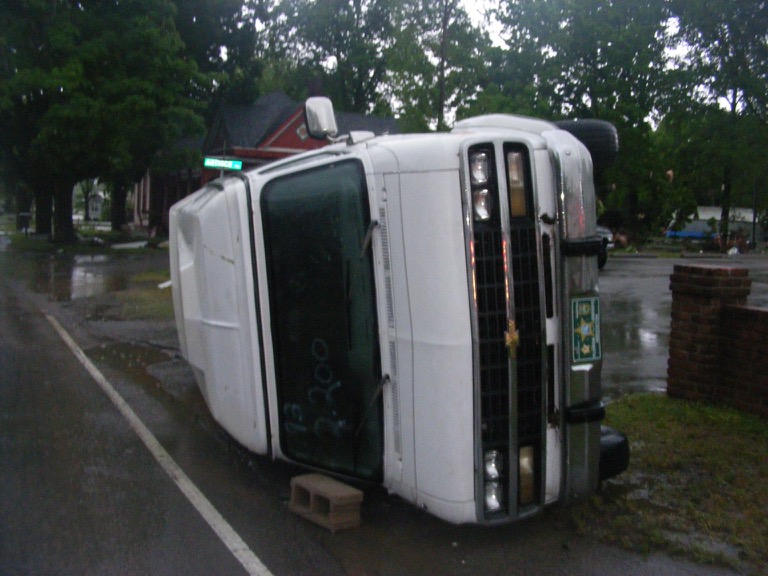
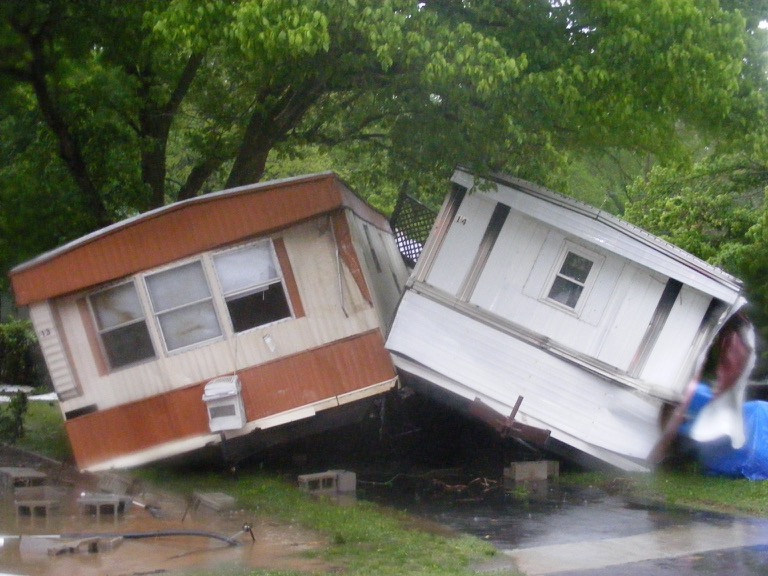
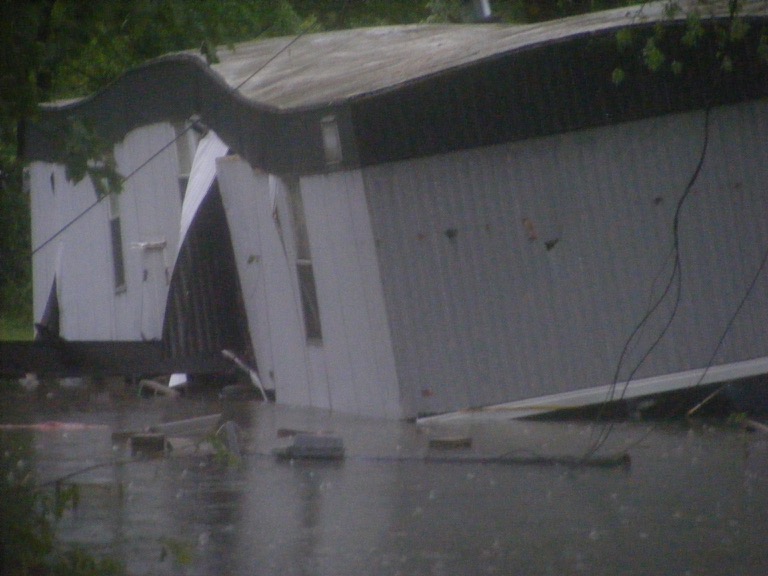
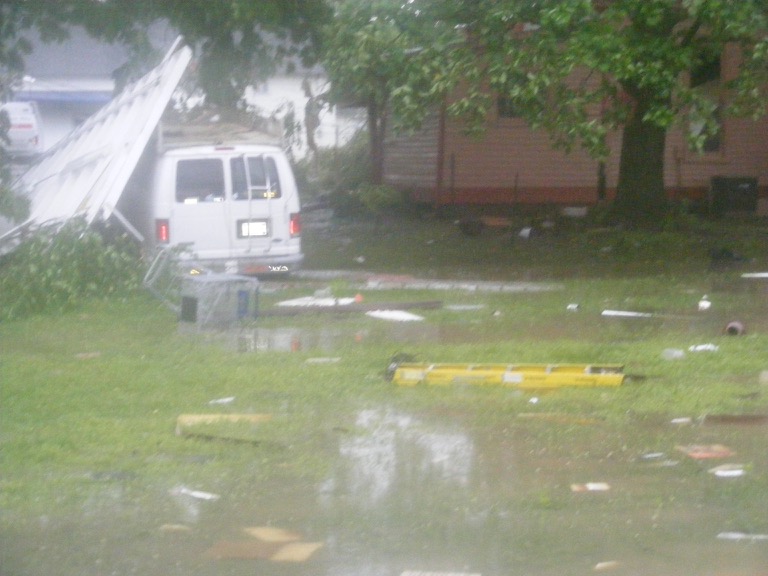
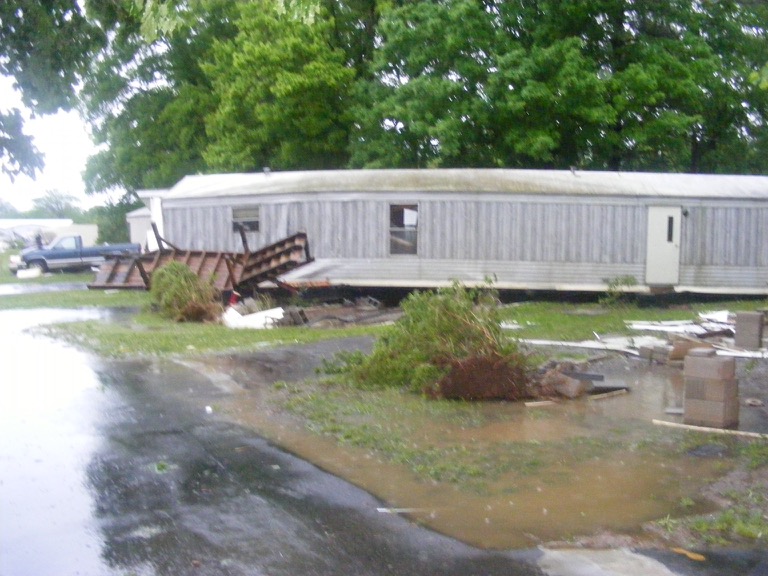
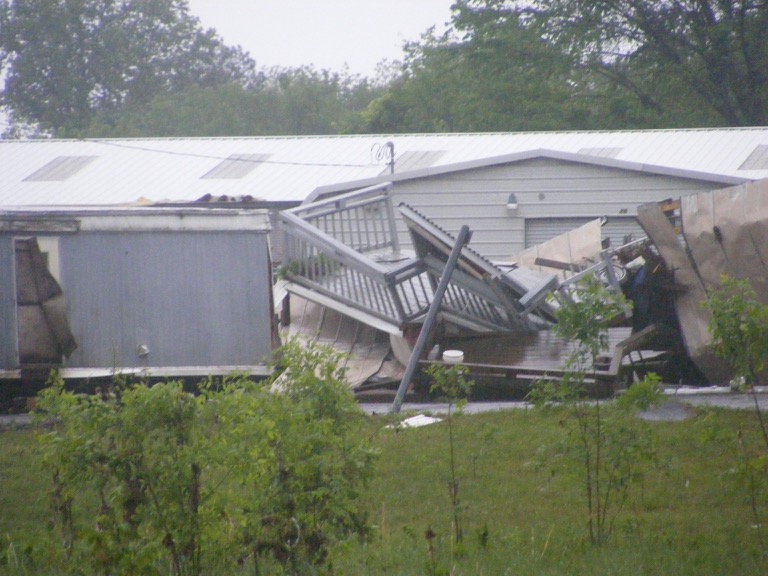
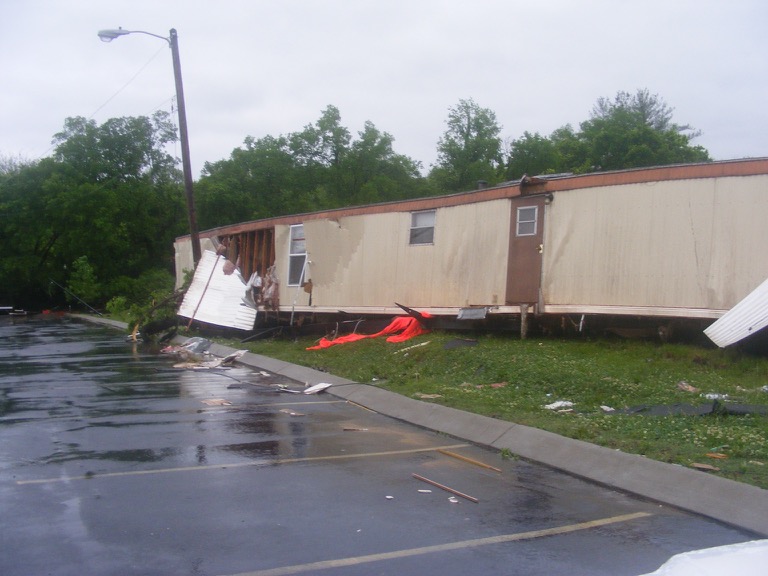
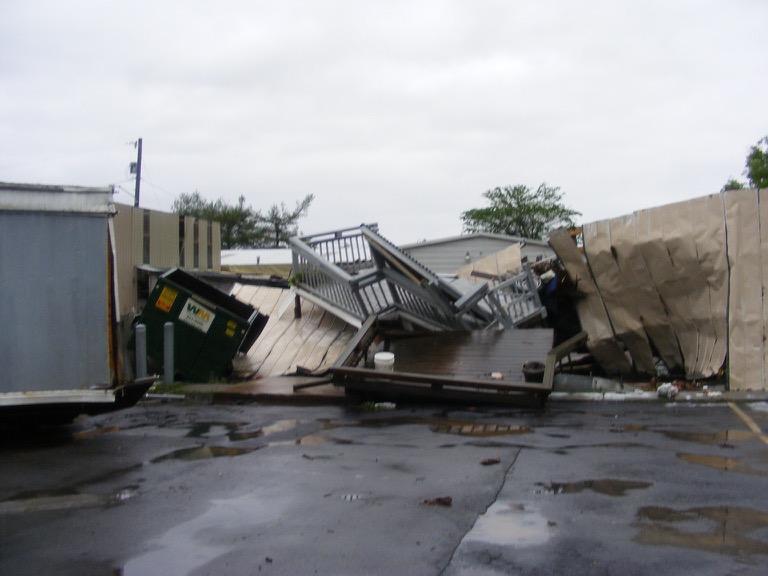
| Mill Creek area in Antioch, TN Photos by Scott Harris, Nashville OEM |
|||||
 |
 |
 |
 |
 |
 |
 |
 |
 |
 |
 |
 |
 |
 |
 |
 |
 |
 |
 |
 |
 |
 |
 |
 |
 |
 |
 |
 |
 |
 |
 |
 |
 |
 |
 |
 |
 |
 |
 |
 |
 |
 |
 |
 |
 |
 |
 |
 |
 |
 |
 |
 |
 |
 |
 |
 |
 |
 |
 |
 |
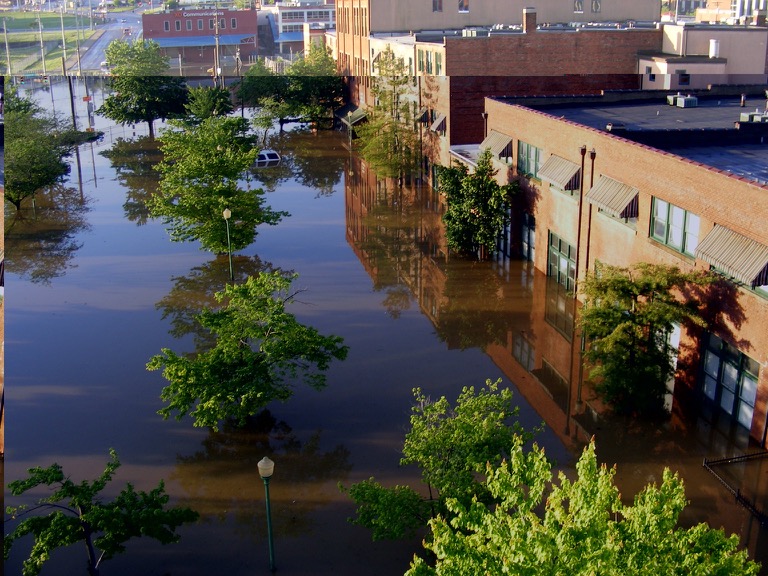
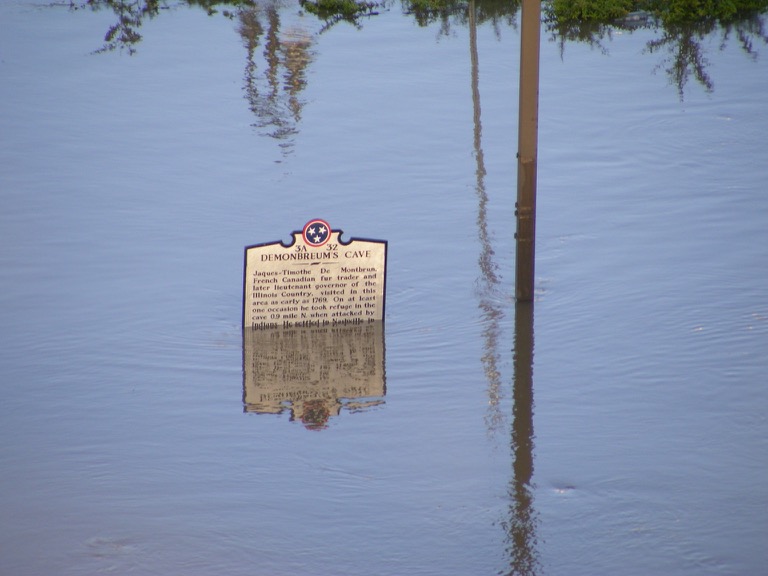
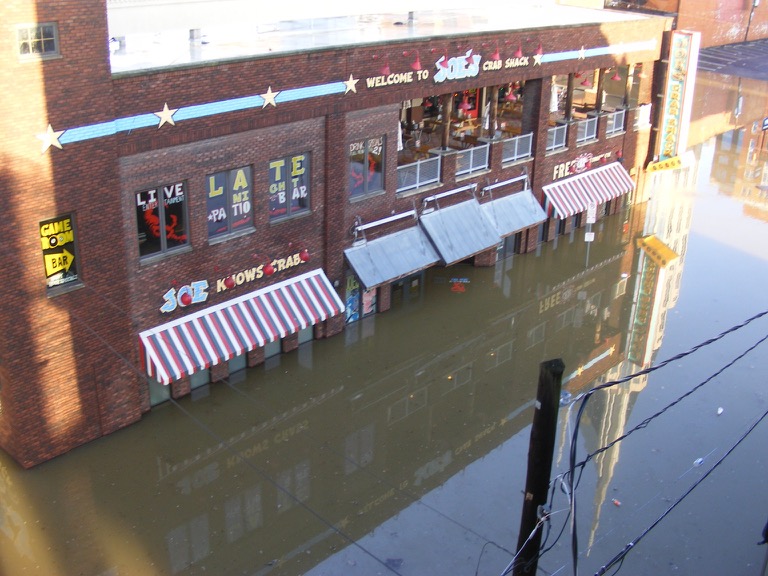
| Downtown Nashville Photos by Scott Harris, Nashville OEM |
|||||
 |
 |
 |
 |
 |
 |
 |
 |
 |
 |
 |
 |
 |
 |
 |
|||
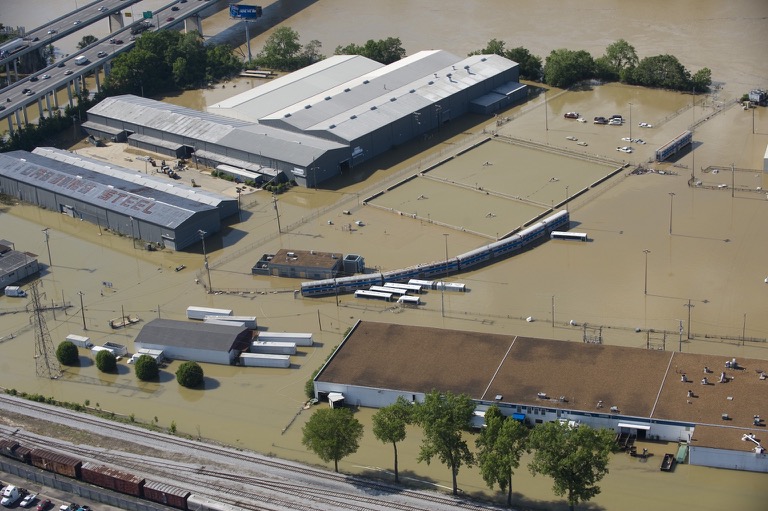
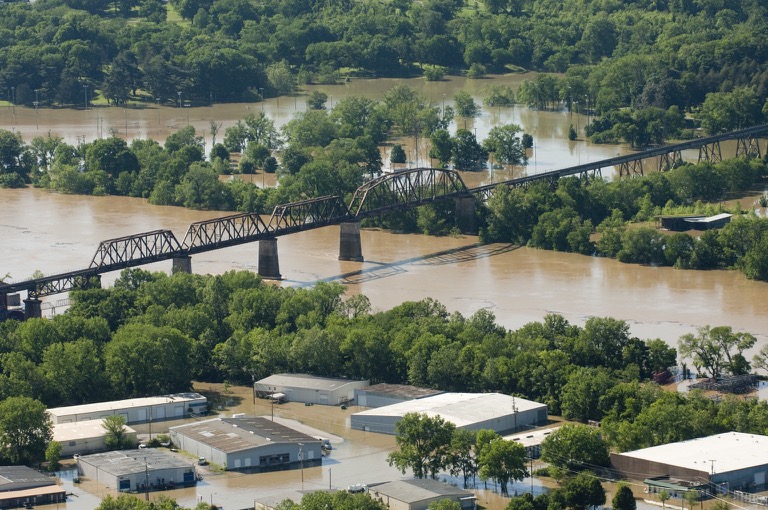
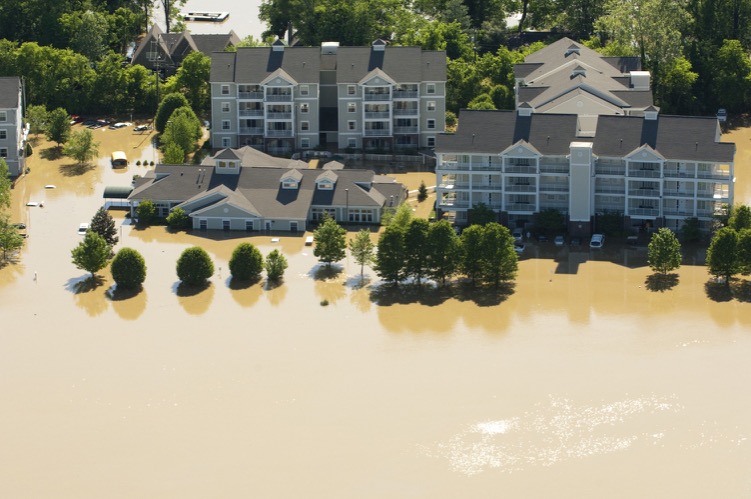
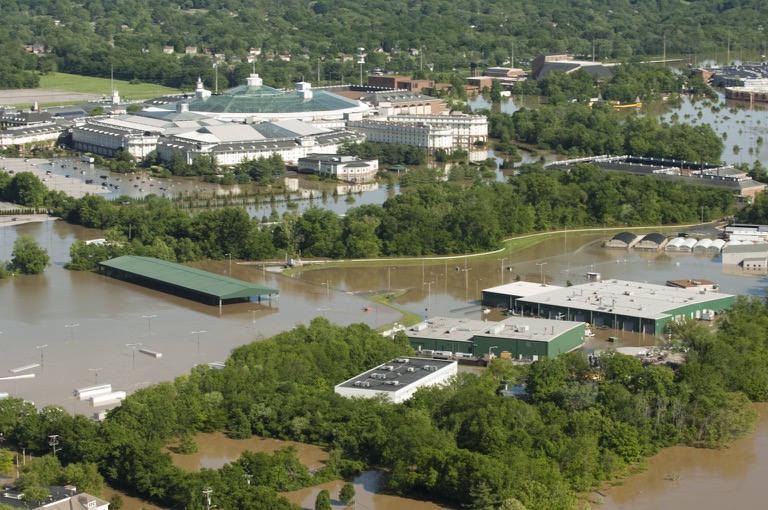
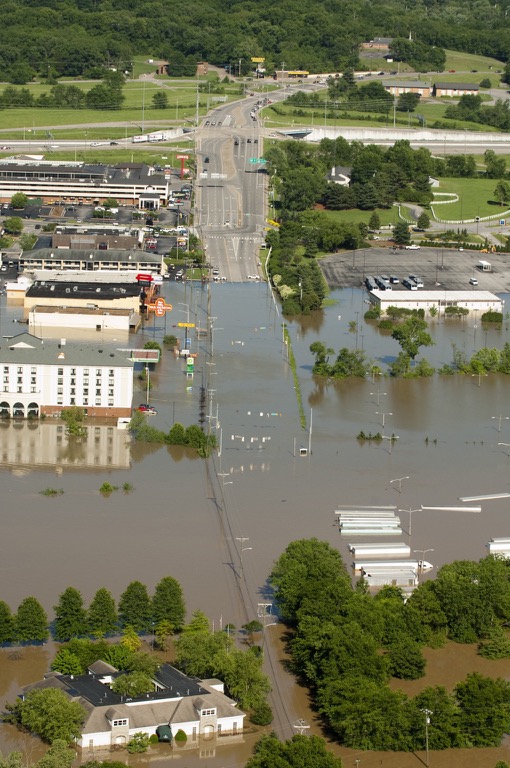
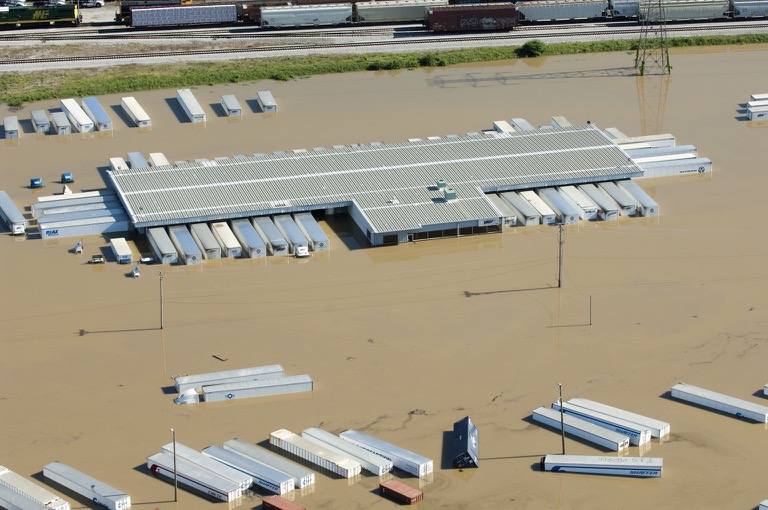
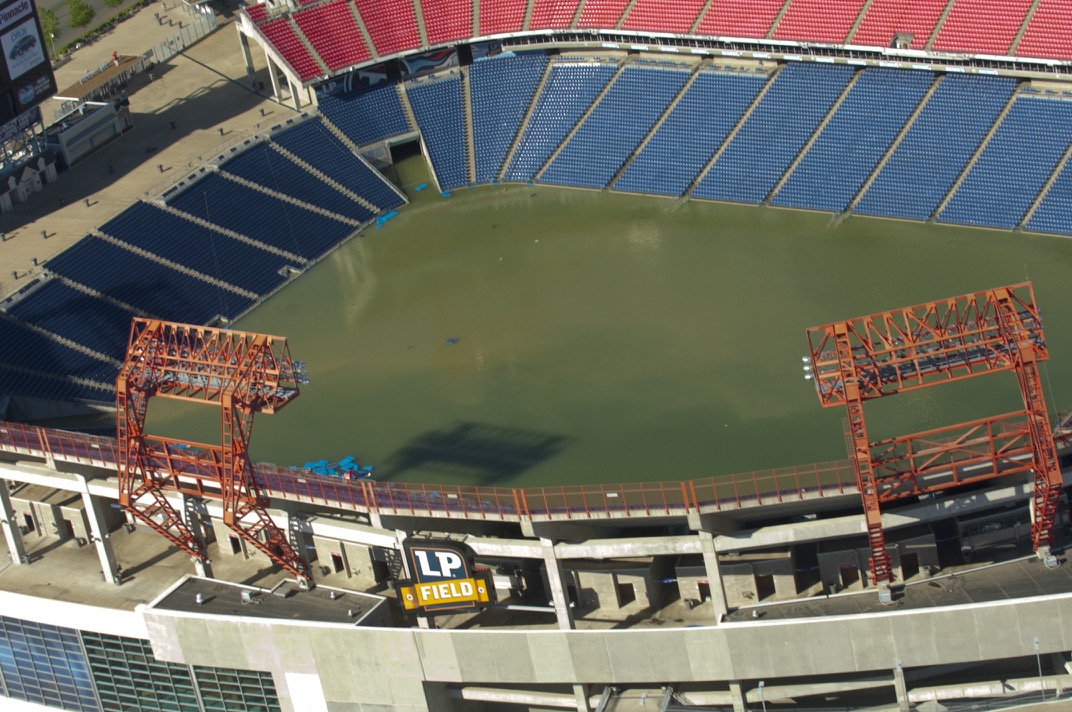
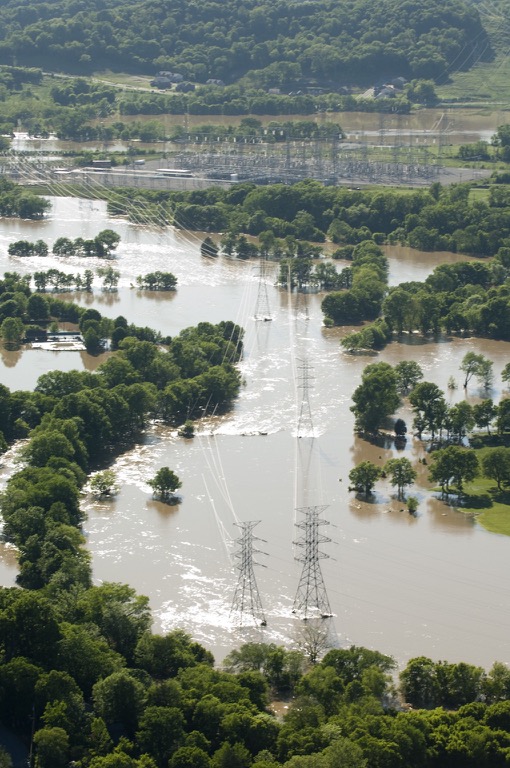
| Nashville from the air Photos courtesy of TEMA |
|||||
 |
 |
 |
 |
 |
 |
 |
 |
 |
 |
 |
 |
 |
 |
 |
 |
 |
 |
Many folks faced conditions they had never before seen – from the people directly impacted by flooding to those who try to forecast Mother Nature. After the National Weather Service’s “Service Assessment” report and by participating in a series of incident reviews with other agencies, the following is a list of “lessons learned” and the actions implemented to address them:
1. Many people felt unwarned about the flood despite nearly constant NWS flood warnings.
- It can be difficult to adequately convey technical information. The NWS recognizes that it’s text-based flood warnings would be enhanced by associated graphics that would show how deep flood waters would reach on any given street. The NWS is working on a long term project with other government and private sector partners to do detailed inundation mapping which could be used to develop graphical flood warnings.
2. Lack of real-time rainfall data.
- The NWS uses several tools and reports to measure rainfall. However, the USGS has worked closely with other agencies to install many new rainfall gauges and some river gauges in Davidson County. Thanks in large part to the USGS, we now receive rainfall measurements from 26 new sites in the county. This information will further enhance NWS Flash Flood Warnings.
3. Forecast of heavy rains only predicted half of what fell.
- NWS data gathering and research, along with much improved forecast models, have greatly enhanced forecasts in recent years. Although this effort continues on a daily basis, we recognize that accurately forecasting double-the-all-time-record rains will take many more years of research and model improvement.
4. Interagency coordination could have been more effective.
- The NWS and US Army Corps of Engineers coordinated about water release from area dams and the associate impacts on river level forecasts at least 17 times May 1-3, 2010. Some of these calls included other agencies (e.g., City of Nashville officials). However, to further enhance our ability to efficiently exchange critical information, NWS Nashville now sends a meteorologist to work in Nashville’s Emergency Operations Center (EOC) as often as possible during bad weather situations. We also have an agreement with the Tennessee Emergency Management Agency to assist in the State EOC when activated during selected activations.


 Follow us on YouTube