*Climate Data has been recorded at Barkley Regional Airport in West Paducah since 1949 and prior to that was observed in downtown Paducah back to December of 1937.
Here is a look at high and low temperature frequencies and extremes as well as precipitation statistics for Christmas in Paducah.
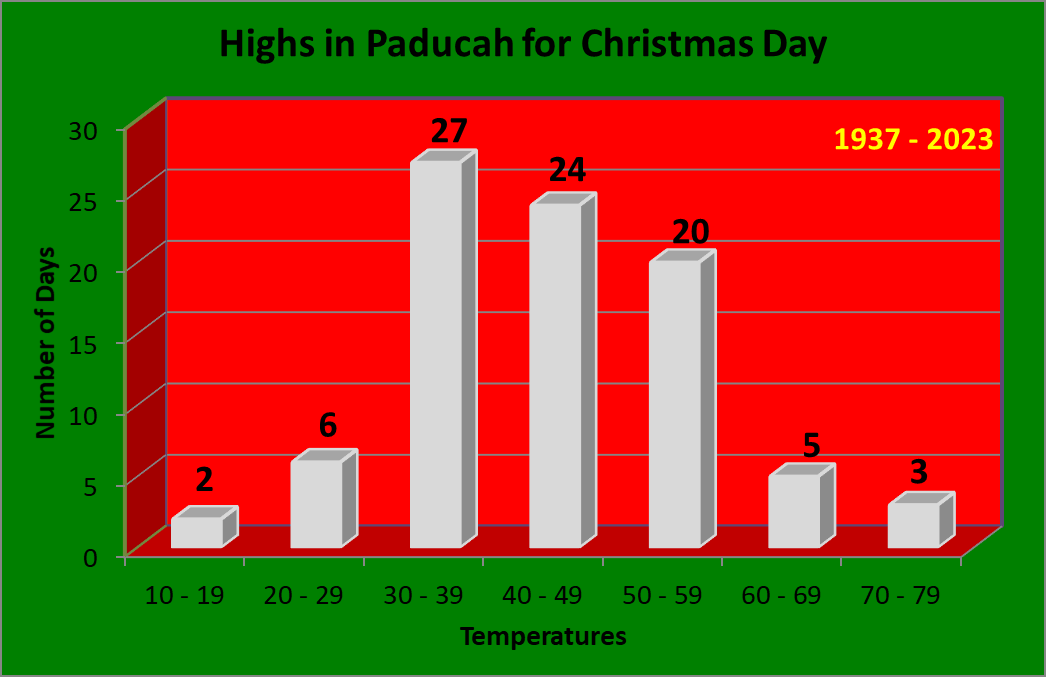
As you can see a good majority of Christmas Days have high temperatures in the 30s and 40s, accounting for 63% of all years on record.
| Warmest Highs | Coldest Highs |
| 74 in 2021 | 12 in 1983 |
| 71 in 2016 | 19 in 1985 |
| 70 in 2019 | 23 in 2022 |
| 69 in 1982 | 24 in 2000 |
| 66 in 1940 | 24 in 1980 |
| 64 in 2023 | 25 in 2020 |
| Normal High: | 44 |
*Denotes a tie in previous year(s)
Paducah has seen highs warm above 60 degrees eight times, including three years where it reached 70 degrees, in 2021, 2019, and 2016. There have also been 2 years where the high temperature failed to reach 20 degrees. This occurred back in 1985 and 1983.
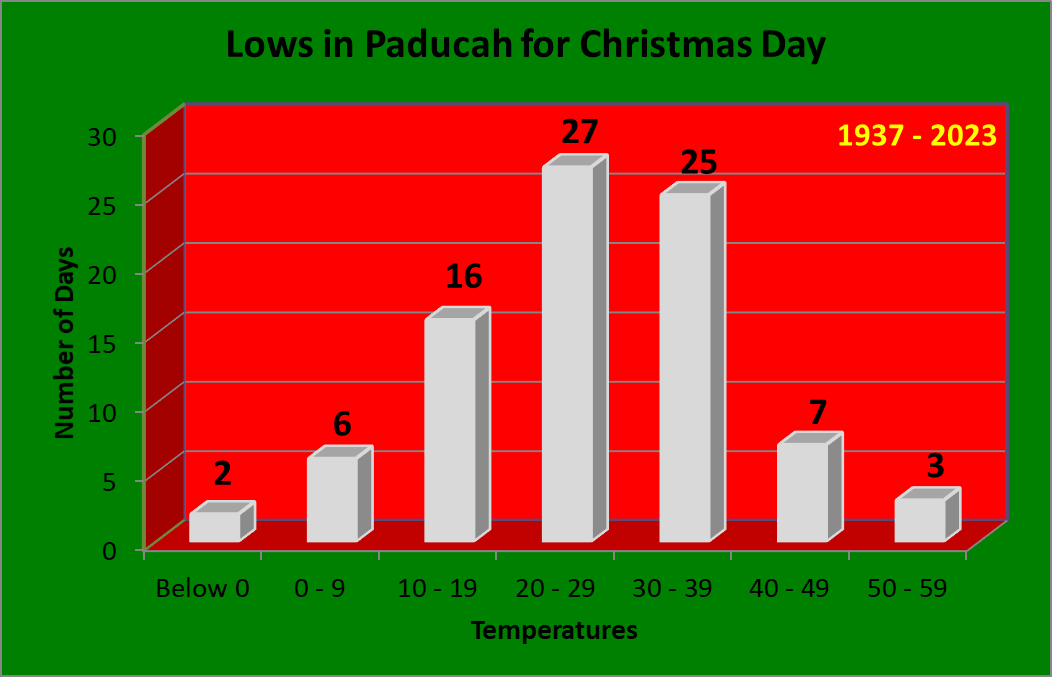
Most Christmas mornings we wake up to temperatures in the 20s and 30s, accounting for 62% of all years on record. But lows have bottomed out below 0 twice, most recently in 2004 when we tanked at 8 degrees below zero. There have also been 3 years where the low remained in the 50s, most recently in 2021.
| Warmest Lows | Coldest Lows |
| 51 in 2015 | -8 in 2004 |
| 50 in 2021 | -5 in 1983 |
| 50 in 1982 | 3 in 2022 |
| 49 in 1971 | 7 in 2000 |
| 46 in 2016 | 7 in 1980 |
| Normal Low: | 27 |
*Denotes a tie in previous year(s)
Measurable precipitation has fallen 29% of the time, with over an inch of precipitation falling on 3 different occasions, most recently in 1987 when a whooping 3.78 inches fell. Measurable snowfall has only occurred on 3 occasions (4% of all years on record), with the most recent back in 1992. There have been 9 years (12% of all years on record) classified as a white Christmas with a snow depth of 1 inch or greater. This last happened in 2022 when there was 2 inches of snow on the ground Christmas morning. The largest snow depth observed on Christmas morning was back in 2004 when there was an astounding 9 inches!
| Wettest (inches) | Snowiest (inches) | Most Snow Depth |
| 3.78 in 1987 | 4.0 in 1969 | 9.0 in 2004 |
| 1.09 in 1982 | 3.0 in 1992 | 5.0 in 1963 |
| 1.01 in 1951 | 2.0 in 1975 | 4.0 in 1969 |
| 0.95 in 2006 | T in 2012* | 3.0 in 2010 |
| 0.70 in 1944 | 2.0 in 2022* |
*Denotes a tie in previous year(s)
Here is a look at the observed weather for the past 15 years:
| Recent Christmas Day Weather | |||||
| Year | High | Low | Precip | Snowfall | Snow Depth |
| 2008 | 41 | 24 | 0 | 0 | 0 |
| 2009 | 53 | 29 | 0.33 | T | 0 |
| 2010 | 33 | 29 | 0.01 | T | 3 |
| 2011 | 56 | 28 | 0 | 0 | 0 |
| 2012 | 36 | 30 | 0.13 | T | 0 |
| 2013 | 45 | 18 | 0 | 0 | 0 |
| 2014 | 50 | 35 | 0 | 0 | 0 |
| 2015 | 59 | 51 | T | 0 | 0 |
| 2016 | 71 | 46 | 0.02 | 0 | 0 |
| 2017 | 34 | 23 | T | T | 0 |
| 2018 | 55 | 33 | 0 | 0 | 0 |
| 2019 | 70 | 33 | 0 | 0 | 0 |
| 2020 | 25 | 16 | 0 | 0 | 0 |
| 2021 | 74 | 50 | 0 | 0 | 0 |
| 2022 | 23 | 3 | 0 | 0 | 2 |
| 2023 | 64 | 44 | 0.58 | 0 | 0 |
*Climate Data has been recorded at Evansville Regional Airport since January of 1897. Snowfall records began in January of 1948.
Here is a look at high and low temperature frequencies and extremes as well as precipitation statistics for Christmas in Evansville.
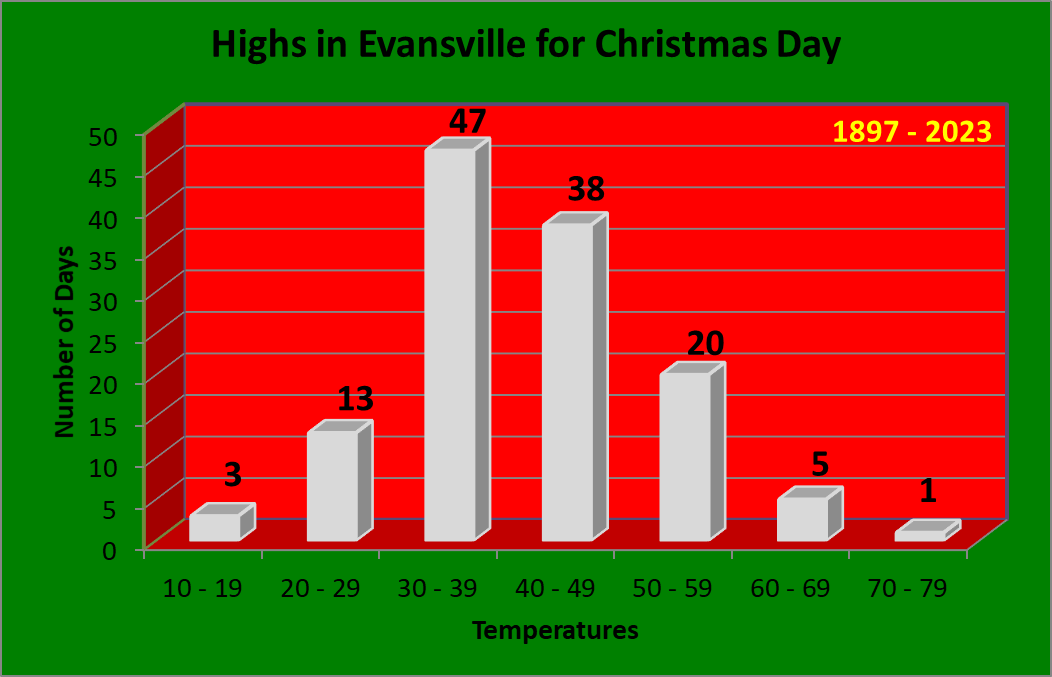
As seen by this graphic high temperatures are predominately in the 30s and 40s on Christmas, encompassing 70% of all years on record.
| Warmest Highs | Coldest Highs |
| 72 in 2021 | 10 in 1983 |
| 68 in 2019 | 14 in 1985 |
| 68 in 1982 | 14 in 1924 |
| 63 in 1932 | 20 in 2020 |
| 61 in 2016 | 21 in 1902 |
| Normal High: | 42 |
*Denotes a tie in previous year(s)
Evansville has seen highs as warm as the 60s six times on Christmas, most recently in 2021 when readings soared to a record breaking 72 degrees. This is the only occurrence of 70 degree temperatures on Christmas. There have also been 3 years where the high temperature failed to reach 20 degrees, most recently in 1985.
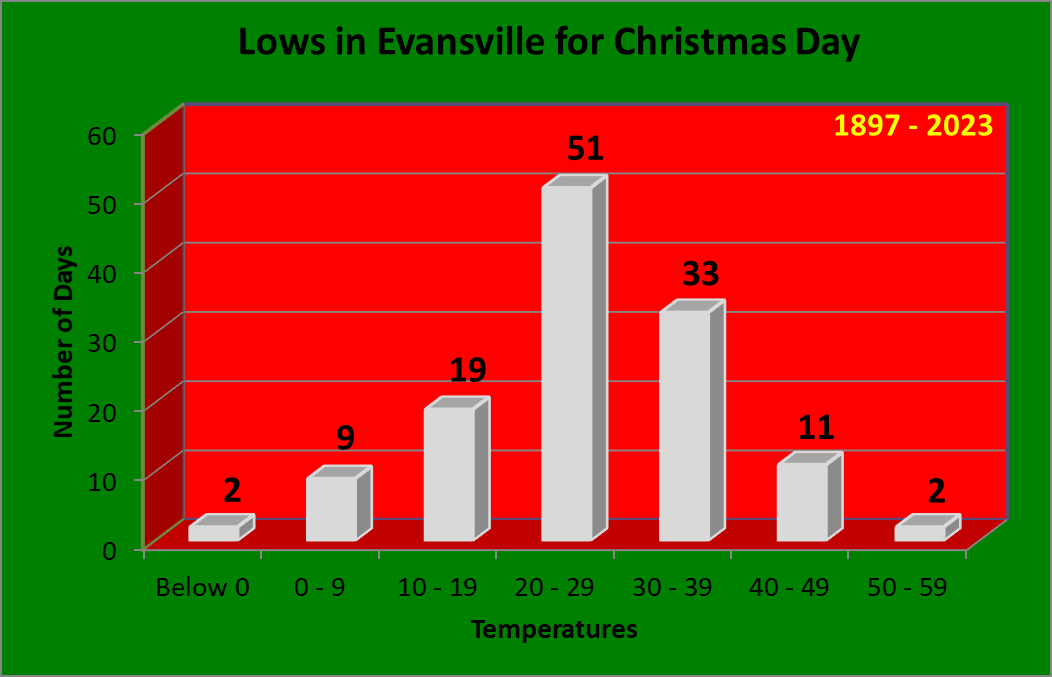
Low temperatures typically fall in the 20s or 30s, which accounts for 68% of the years on record. There have been 2 years with lows below 0, most recently in 2004 when it tanked to 11 below zero. On the warm end of the spectrum, there have been 3 years with lows above 45 degrees. This last occurred in 2023.
| Warmest Lows | Coldest Lows |
| 51 in 2023 | -11 in 2004 |
| 51 in 1982 | -7 in 1983 |
| 48 in 2015 | 0 in 2000 |
| 43 in 2021 | 3 in 1985 |
| 43 in 1940 | 3 in 1924 |
| 43 in 1936 | |
| Normal Low: | 25 |
*Denotes a tie in previous year(s)
Measurable precipitation has fallen 37% of the time, with over an inch of precipitation falling on 3 different occasions, most recently in 2006. Measurable snowfall has only occurred on 7 occasions (10% of all years on record), with the greatest being 2.3 inches in 1993. There have been 10 years (13% of all years on record) classified as a white Christmas with a snow depth of 1 inch or greater. This last happened in 2022 when there was 2 inches of snow on the ground Christmas morning. The largest snow depth observed on Christmas morning was back in 2004 when there was an astounding 11 inches!
| Wettest (inches) | Snowiest (inches) | Most Snow Depth |
| 1.96 in 1987 | 2.3 in 1993 | 11.0 in 2004 |
| 1.79 in 1982 | 2.1 in 1969 | 6.0 in 1963 |
| 1.03 in 2006 | 0.7 in 1992 | 4.0 in 1969 |
| 0.88 in 1975 | 0.7 in 1975 | 2.0 in 2022 |
| 0.85 in 1944 | 0.1 in 2002* | 2.0 in 2000* |
*Denotes a tie in previous year(s)
Here is a look at the observed weather for the past 15 years:
| Recent Christmas Day Weather | |||||
| Year | High | Low | Precip | Snowfall | Snow Depth |
| 2009 | 54 | 31 | 0.2 | T | 0 |
| 2010 | 33 | 29 | T | T | 1 |
| 2011 | 55 | 28 | 0 | 0 | 0 |
| 2012 | 37 | 30 | 0.01 | 0 | 0 |
| 2013 | 38 | 21 | 0 | 0 | 0 |
| 2014 | 49 | 38 | 0 | 0 | 0 |
| 2015 | 58 | 48 | T | 0 | 0 |
| 2016 | 61 | 41 | 0.04 | 0 | 0 |
| 2017 | 31 | 20 | T | T | T |
| 2018 | 50 | 32 | 0 | 0 | 0 |
| 2019 | 68 | 31 | 0 | 0 | 0 |
| 2020 | 20 | 13 | T | T | 0 |
| 2021 | 72 | 43 | 0 | 0 | 0 |
| 2022 | 22 | 9 | 0 | 0 | 2 |
| 2023 | 59 | 51 | 0.47 | 0 | 0 |
*Climate Data has been recorded at Cape Girardeau Regional Airport, located 5 miles southwest of Cape Girardeau, since June of 1960.
Here is a look at high and low temperature frequencies and extremes as well as precipitation statistics for Christmas in Cape Girardeau.
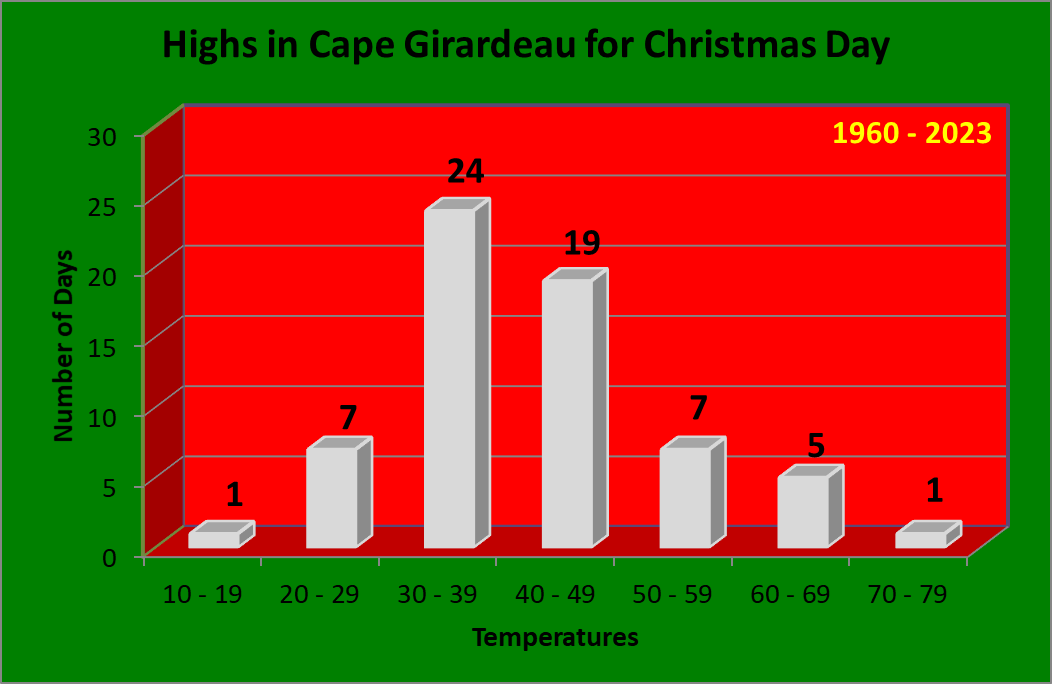
As you can see a good majority of Christmas Days have high temperatures in the 30s and 40s, accounting for 74% of all years on record.
| Warmest Highs | Coldest Highs |
| 74 in 2021 | 15 in 1983 |
| 67 in 2019 | 21 in 2000 |
| 66 in 2016 | 21 in 1985 |
| 65 in 1982 | 24 in 1980 |
| 63 in 2023 | 25 in 2004 |
| 61 in 1971 | 26 in 2022 |
| Normal High: | 43 |
*Denotes a tie in previous year(s)
Cape Girardeau has seen highs as warm as the 60s six times on Christmas, most recently in 2023. The warmest Christmas was in 2021, which was the only year where highs soared above 70 degrees. Back in 1983 was the only year that the high didn't hit 20 degrees, topping out at 15.
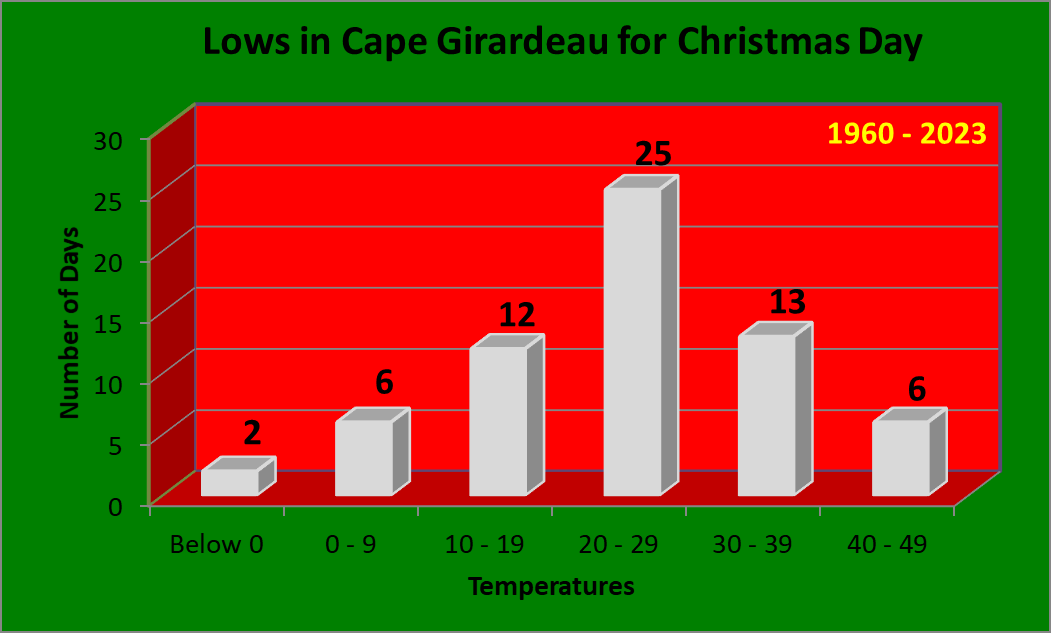
Christmas morning lows end up in the 20s a good portion of the time, accounting for 42% of all years on record. Teens and 30s are fairly common as well. Lows have bottomed out below 0 twice, most recently in 2004 when we tanked to 10 degrees below zero. There have also been 5 years where the low remained above 40 degrees, most recently in 2021.
| Warmest Lows | Coldest Lows |
| 48 in 1971 | -10 in 2004 |
| 47 in 2021 | -7 in 1983 |
| 47 in 2015 | 3 in 2022 |
| 46 in 1982 | 5 in 1963 |
| 44 in 2016 | 6 in 2000 |
| 43 in 2023 | 6 in 1985 |
| Normal Low: | 25 |
*Denotes a tie in previous year(s)
Measurable precipitation has fallen 23% of the time, with over an inch of precipitation falling on 3 different occasions, most recently in 1987 when a whooping 3.48 inches fell.
| Wettest (inches) |
| 3.48 in 1987 |
| 2.24 in 1982 |
| 1.06 in 1975 |
| 0.65 in 2023 |
| 0.50 in 2006 |
Here is a look at the observed weather for the past 15 years:
| Recent Christmas Day Weather | |||
| Year | High | Low | Precip |
| 2009 | 49 | 28 | 0.08 |
| 2010 | 34 | 29 | T |
| 2011 | 58 | 26 | 0 |
| 2012 | 37 | 27 | T |
| 2013 | 40 | 21 | 0 |
| 2014 | 49 | 34 | 0 |
| 2015 | 58 | 47 | T |
| 2016 | 66 | 44 | T |
| 2017 | 34 | 23 | 0 |
| 2018 | 53 | 34 | 0 |
| 2019 | 67 | 33 | 0 |
| 2020 | 29 | 14 | 0 |
| 2021 | 74 | 47 | 0 |
| 2022 | 26 | 3 | 0 |
| 2023 | 63 | 43 | 0.65 |
Climate Data has been recorded at the Poplar Bluff Airport, located 4 miles east of Poplar Bluff, since December of 1997. Prior to that data was taken at the Poplar Bluff COOP station, located a half mile west of downtown. Data for the COOP station dates back to January 1893.
Here is a look at high and low temperature frequencies and extremes as well as precipitation statistics for Christmas in Poplar Bluff.
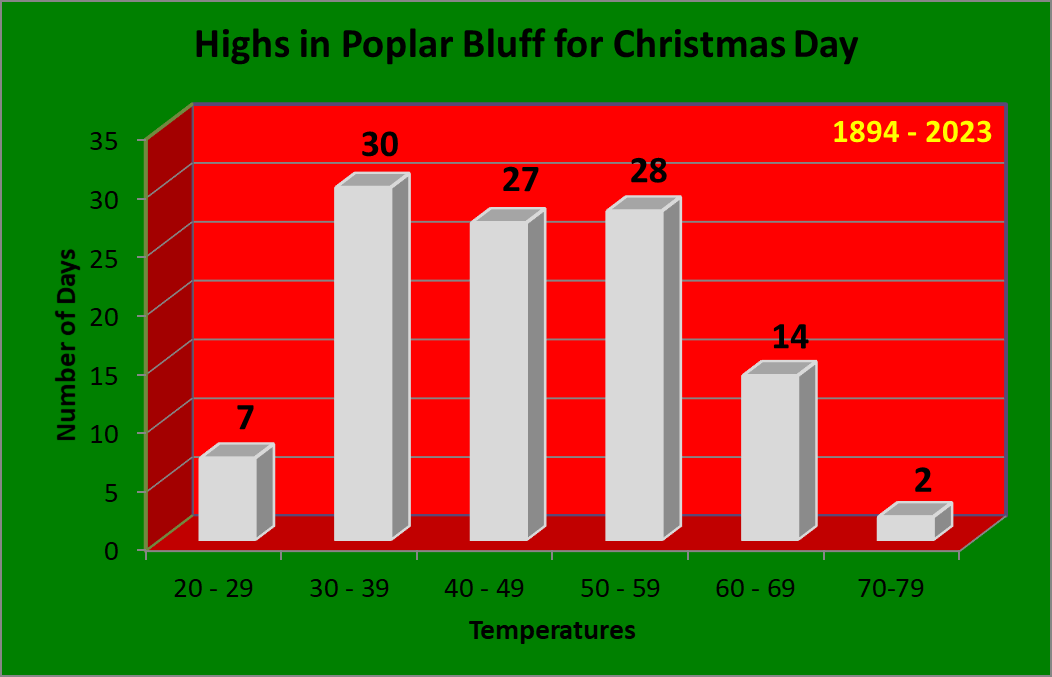
As you can see a good majority of Christmas Days have high temperatures in the 30s, 40s, or 50s, accounting for 81% of all years on record.
| Warmest Highs | Coldest Highs |
| 77 in 2021 | 22 in 2000 |
| 70 in 1921 | 22 in 1990 |
| 67 in 2019 | 25 in 1989 |
| 67 in 1982 | 25 in 1914 |
| 66 in 2016 | 27 in 2004 |
| Normal High: | 45 |
*Denotes a tie in previous year(s)
Poplar Bluff has seen highs warm above 60 degrees on 16 occasions. On 2 occasions, readings have reached 70 degrees. This occurred most recently in 2021 when temperatures soared to a record shattering 77 degrees! There have also been 7 years where the high temperature failed to reach 30 degrees. This last occurred back in 2022.
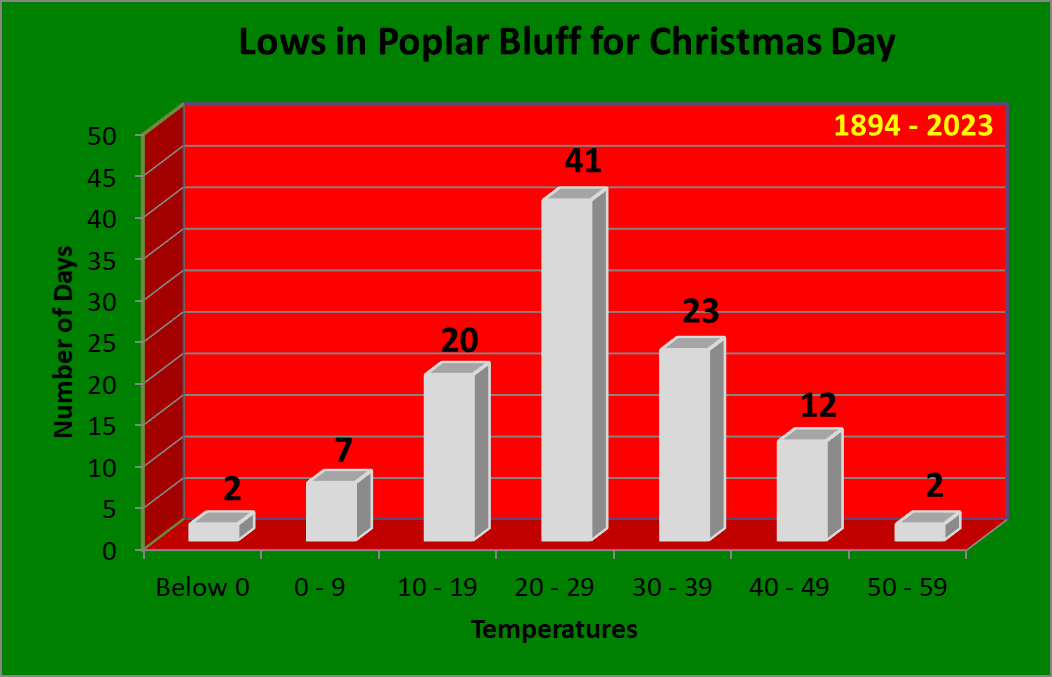
Most Christmas mornings we wake up to temperatures in the 20s, 30s, or 40s, accounting for 81% of all years on record. But lows have bottomed out below 0 twice, most recently in 2004 when we tanked to 4 degrees below zero. Meanwhile, back in 1982 we had a balmy low of 57 degrees, which is one of only two occurrences of low temperatures remaining above 50 on Christmas.
| Warmest Lows | Coldest Lows |
| 57 in 1982 | -4 in 2004 |
| 52 in 2021 | -1 in 1924 |
| 49 in 1940 | 6 in 1985 |
| 48 in 2015 | 7 in 1980 |
| 47 in 1942 | 8 in 2022* |
| Normal Low: | 29 |
Measurable precipitation has fallen 19% of the time, with over an inch of precipitation falling on 4 different occasions, most recently in 1987.
| Wettest (inches) |
| 3.33 in 1982 |
| 1.20 in 1944 |
| 1.19 in 1987 |
| 1.00 in 1948 |
| 0.86 in 2023 |
Here is a look at the observed weather for the past 15 years:
| Recent Christmas Day Weather | |||
| Year | High | Low | Precip |
| 2009 | 47 | 26 | T |
| 2010 | 36 | 30 | 0 |
| 2011 | 57 | 30 | 0 |
| 2012 | 37 | 28 | 0.01 |
| 2013 | 41 | 21 | 0 |
| 2014 | 51 | 31 | 0 |
| 2015 | 57 | 48 | 0 |
| 2016 | 66 | 44 | 0 |
| 2017 | 33 | 22 | 0 |
| 2018 | 53 | 36 | 0 |
| 2019 | 67 | 34 | 0 |
| 2020 | 32 | 15 | 0 |
| 2021 | 77 | 52 | 0 |
| 2022 | 29 | 8 | 0 |
| 2023 | 60 | 41 | 0.86 |
Climate Data has been recorded at Southern Illinois Airport, located 4 miles northwest of Carbondale, since August of 1998. Prior to that data was taken at the Carbondale Sewage Plant COOP station, located 3 miles east of Carbondale. Data for the COOP station dates back to November 1898.
Here is a look at high and low temperature frequencies and extremes as well as precipitation statistics for Christmas in Carbondale.
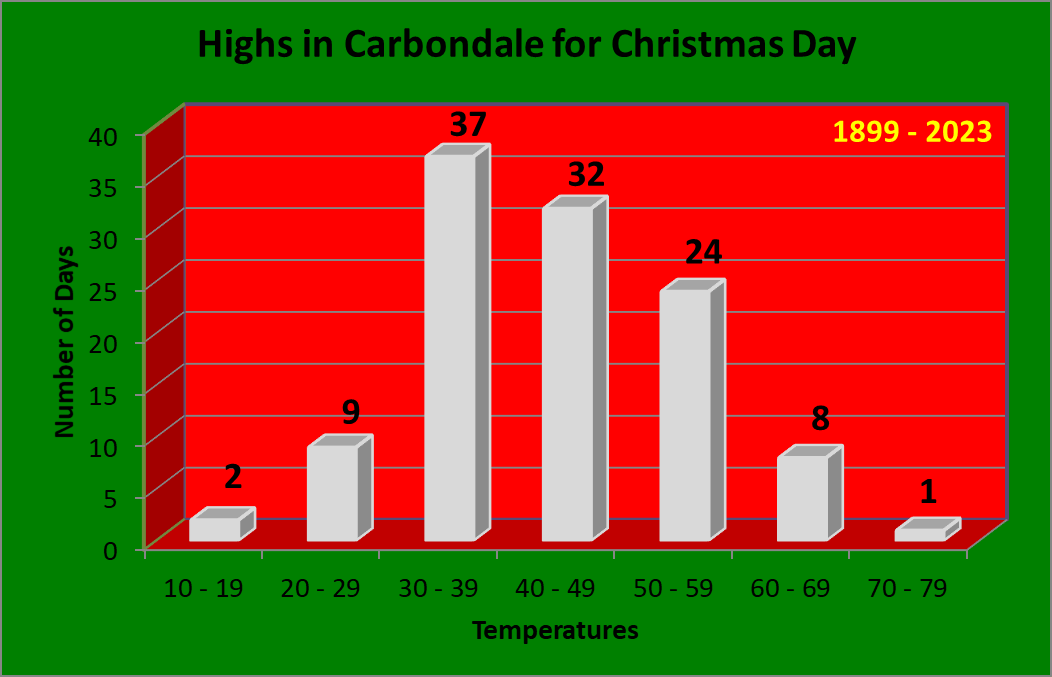
As you can see a good majority of Christmas Days have high temperatures in the 30s and 40s, accounting for 63% of all years on record.
| Warmest Highs | Coldest Highs |
| 74 in 2021 | 18 in 2000 |
| 67 in 2019 | 18 in 1924 |
| 67 in 1982 | 20 in 1989 |
| 66 in 1922 | 24 in 2020 |
| 64 in 2016 | 24 in 1990 |
| 63 in 1955 | 25 in 2022 |
| Normal High: | 43 |
*Denotes a tie in previous year(s)
Carbondale has seen highs warm above 60 degrees 9 times, with the most recent occurring in 2023. There have also been 2 years where the high temperature failed to reach 20 degrees. This occurred back in 2000 in 1924.
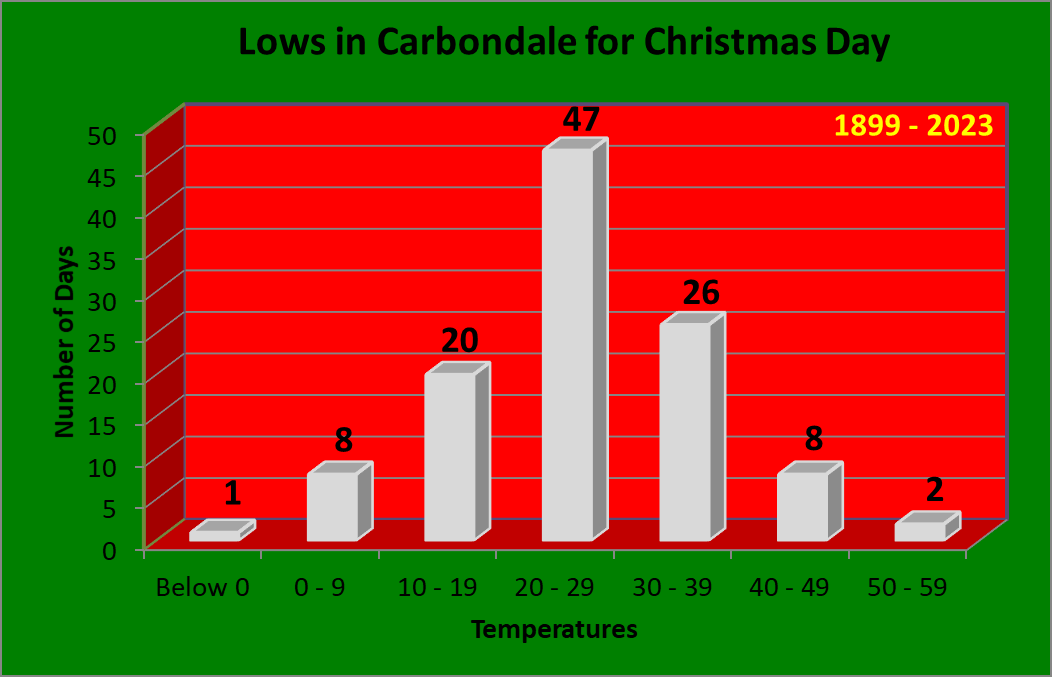
Most Christmas mornings we wake up to temperatures in the 20s, 30s, or 40s, accounting for 84% of all years on record. However, there was one year lows bottomed out below 0. This occurred back in 2004 when the low plummeted to -11 thanks to a fresh deep snow pack. There have also been 2 years where the low remained above 50 degrees, most recently in 1982.
| Warmest Lows | Coldest Lows |
| 54 in 1982 | -11 in 2004 |
| 52 in 1940 | 0 in 1924 |
| 48 in 1936 | 2 in 1990 |
| 43 in 2015 | 3 in 2000 |
| 43 in 1973* | 3 in 1980 |
| Normal Low: | 27 |
*Denotes a tie in previous year(s)
Measurable precipitation has fallen 27% of the time, with over an inch of precipitation falling only once, back in 1982 when 2.17" occurred.
| Wettest (inches) |
| 2.17 in 1982 |
| 0.86 in 1949 |
| 0.82 in 1973 |
| 0.64 in 1964 |
| 0.60 in 2006* |
*Denotes a tie in previous year(s)
Here is a look at the observed weather for the past 15 years:
| Recent Christmas Day Weather | |||
| Year | High | Low | Precip |
| 2009 | 54 | 26 | 0.35 |
| 2010 | 32 | 28 | T |
| 2011 | 57 | 26 | 0 |
| 2012 | 36 | 26 | T |
| 2013 | 38 | 20 | M |
| 2014 | 49 | 31 | T |
| 2015 | 55 | 43 | 0 |
| 2016 | 64 | 40 | 0.02 |
| 2017 | 32 | 20 | 0 |
| 2018 | 51 | 31 | T |
| 2019 | 67 | 30 | 0 |
| 2020 | 24 | 14 | 0 |
| 2021 | 74 | 38 | 0 |
| 2022 | 25 | 9 | 0 |
| 2023 | 61 | 42 | 0.54 |

