
Chantal is now a Tropical Depression. Flash flood concerns continue across portions of central North Carolina into Monday. Life-threatening surf and rip currents conditions are expected to continue at beaches along the U.S. East Coast from northeastern Florida to the Mid-Atlantic states during the next day or so. Flood Watches and recovery continue across central Texas. Read More >
*Climate Data has been recorded at Barkley Regional Airport in West Paducah since 1949 and prior to that was observed in downtown Paducah back to December of 1937.
Easter Sunday varies between March 22 and April 25. The date of Easter is the first Sunday after the full moon following the northern hemisphere's vernal equinox on March 21.
Here is a look at high and low temperature frequencies and extremes as well as precipitation statistics for Easter in Paducah.
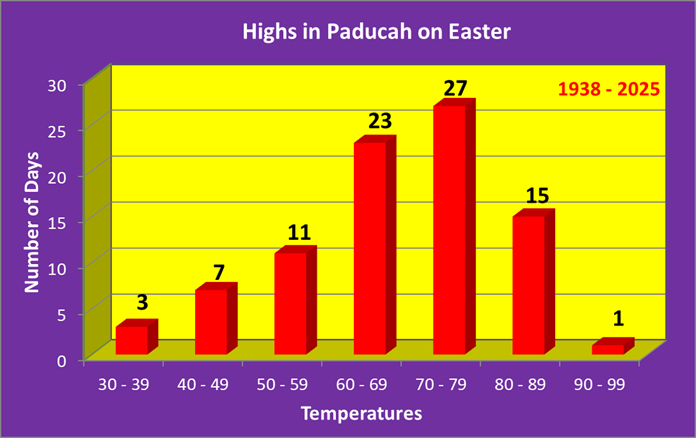
As seen by this graphic high temperatures are predominately in the 60s or 70s on Easter, encompassing 58% of all years on record.
| Warmest Highs | Coldest Highs |
| 90 in 1946 | 36 in 1970 |
| 88 in 1941 | 37 in 1978 |
| 84 in 2025 | 38 in 1940 |
| 84 in 2017 | 44 in 1975 |
| 84 in 1986 | 47 in 1996 |
| 84 in 1977 | |
| Normal High: | 61 - 72 |
*Denotes a tie in previous year(s)
Paducah has seen highs above 80 degrees 16 times, most recently in 2025. There have also been 3 years where the high temperature failed to reach 40 degrees, with this last happening in 1978.

Low temperatures in the 40s or 50s are most common, accounting for 59% of all years on record. There have been 11 years where lows dipped below freezing, most recently in 2008. On the warm side of the spectrum, there have been 12 years with lows in the 60s, with the most recent being in 2025.
| Warmest Lows | Coldest Lows |
| 66 in 2006 | 21 in 2007 |
| 65 in 1976 | 24 in 1940 |
| 64 in 1992 | 25 in 1991 |
| 63 in 1973 | 25 in 1964 |
| 62 in 2025* | 26 in 1996* |
| Normal Low: | 39 - 50 |
*Denotes a tie in previous year(s)
Measurable precipitation has fallen 43% of the time, with over an inch of precipitation falling on 5 different occasions, most recently in 2017. Measurable snowfall has only occurred once (1% of all years on record), way back in 1940. Snow depth of 1 inch or more has been recorded once (1% of all years on record), back in 1940 when 2 inches of snow were on the ground.
| Wettest (inches) | Snowiest (inches) | Most Snow Depth |
| 3.87 in 2011 | 2.0 in 1940 | 2.0 in 1940 |
| 1.62 in 2005 | ||
| 1.44 in 1973 | ||
| 1.18 in 2017 | ||
| 1.07 in 1981 |
Here is a look at the observed weather for the past 15 years:
| Recent Weather for Easter | |||
| Year | High | Low | Precip |
| 4/24/2011 | 70 | 61 | 3.87 |
| 4/8/2012 | 70 | 41 | 0 |
| 3/31/2013 | 63 | 48 | T |
| 4/20/2014 | 80 | 47 | 0 |
| 4/5/2015 | 66 | 33 | 0 |
| 3/27/2016 | 77 | 41 | 0.29 |
| 4/16/2017 | 84 | 61 | 1.18 |
| 4/1/2018 | 53 | 37 | 0.69 |
| 4/21/2019 | 78 | 38 | 0 |
| 4/12/2020 | 62 | 55 | 0.43 |
| 4/4/2021 | 74 | 41 | 0 |
| 4/17/2022 | 54 | 44 | 0.33 |
| 4/9/2023 | 73 | 41 | 0 |
| 3/31/2024 | 78 | 62 | 0 |
| 4/20/2025 | 84 | 62 | 0.03 |
*Climate Data has been recorded at Evansville Regional Airport since January of 1897. Snowfall records began in January of 1948.
Easter Sunday varies between March 22 and April 25. The date of Easter is the first Sunday after the full moon following the northern hemisphere's vernal equinox on March 21.
Here is a look at high and low temperature frequencies and extremes as well as precipitation statistics for Easter in Evansville.
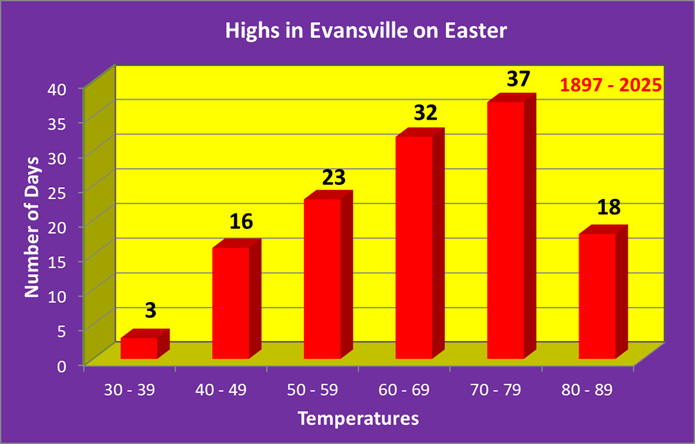
As seen by this graphic high temperatures are predominately in the 60s or 70s on Easter, encompassing 54% of all years on record.
| Warmest Highs | Coldest Highs |
| 86 in 1962 | 34 in 1940 |
| 85 in 1977 | 38 in 1978 |
| 85 in 1976 | 38 in 1970 |
| 85 in 1941 | 42 in 1975 |
| 84 in 2025* | 43 in 1899 |
| Normal High: | 59 - 71 |
*Denotes a tie in previous year(s)
Evansville has seen highs above 80 degrees 18 times, most recently in 2025. There have also been 3 years where the high temperature failed to reach 40 degrees, with this last happening in 1978.
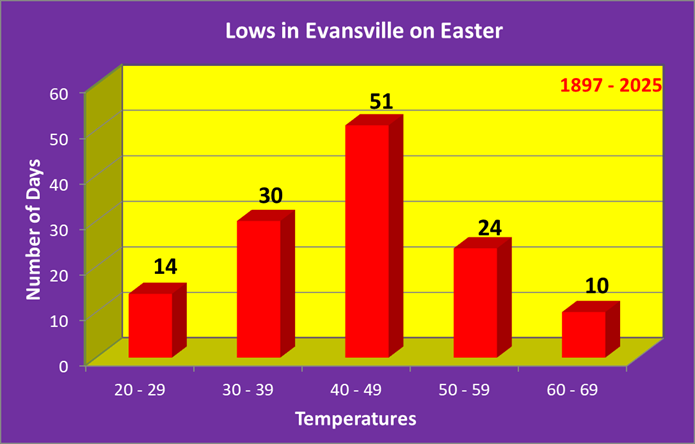
Low temperatures in the 30s or 40s are most common, accounting for 63% of all years on record. There have been 16 years where lows dipped below freezing, most recently in 2008. On the warm side of the spectrum, there have been 10 years with lows in the 60s, with the most recent being in 2017.
| Warmest Lows | Coldest Lows |
| 64 in 2006 | 23 in 1940 |
| 64 in 1973 | 24 in 1966 |
| 63 in 1992 | 24 in 1923 |
| 62 in 1910 | 25 in 1996 |
| 61 in 2017* | 25 in 1964 |
| Normal Low: | 37 - 48 |
*Denotes a tie in previous year(s)
Measurable precipitation has fallen 43% of the time, with over an inch of precipitation falling on 5 different occasions, most recently in 2017. Measurable snowfall has occured twice (3% of all years on record), with the most noticeable being the 2.8 inches that fell back in 1970. Snow depth of 1 inch or more has been recorded once (1% of all years on record), back in 1970 when 4 inches of snow were on the ground.
| Wettest (inches) |
Snowiest (inches) |
Most Snow Depth |
| 1.56 in 2017 | 2.8 in 1970 | 4.0 in 1970 |
| 1.49 in 2011 | 0.3 in 1978 | |
| 1.46 in 2005 | ||
| 1.30 in 1945 | ||
| 1.24 in 1944 |
Here is a look at the observed weather for the past 15 years:
| Recent Weather for Easter | |||
| Year | High | Low | Precip |
| 4/24/2011 | 70 | 61 | 1.49 |
| 4/8/2012 | 69 | 44 | 0 |
| 3/31/2013 | 64 | 46 | 0.01 |
| 4/20/2014 | 79 | 47 | 0 |
| 4/5/2015 | 65 | 35 | T |
| 3/27/2016 | 77 | 42 | 0.01 |
| 4/16/2017 | 82 | 61 | 1.56 |
| 4/1/2018 | 51 | 35 | 0.65 |
| 4/21/2019 | 73 | 35 | 0 |
| 4/12/2020 | 62 | 51 | 0.14 |
| 4/4/2021 | 77 | 43 | 0 |
| 4/17/2022 | 53 | 38 | 0.30 |
| 4/9/2023 | 71 | 38 | 0 |
| 3/31/2024 | 81 | 59 | 0 |
| 4/20/2025 | 84 | 58 | 0 |
*Climate Data has been recorded at Cape Girardeau Regional Airport, located 5 miles southwest of Cape Girardeau, since June of 1960.
Easter Sunday varies between March 22 and April 25. The date of Easter is the first Sunday after the full moon following the northern hemisphere's vernal equinox on March 21.
Here is a look at high and low temperature frequencies and extremes as well as precipitation statistics for Easter in Cape Girardeau.
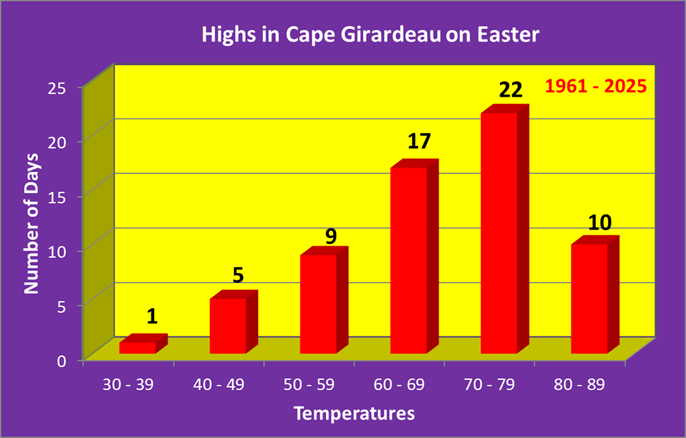
As seen by this graphic high temperatures are predominately in the 60s or 70s on Easter, encompassing 60% of all years on record.
| Warmest Highs | Coldest Highs |
| 84 in 1986 | 37 in 1978 |
| 84 in 1977 | 41 in 1970 |
| 83 in 2006 | 47 in 2008 |
| 83 in 1976 | 48 in 1996 |
| 83 in 1971 | 48 in 1975 |
| Normal High: | 60 - 72 |
*Denotes a tie in previous year(s)
Cape Girardeau has seen highs above 80 degrees 10 times, most recently in 2025. There has also been 1 year where the high temperature failed to reach 40 degrees, back in 1978.
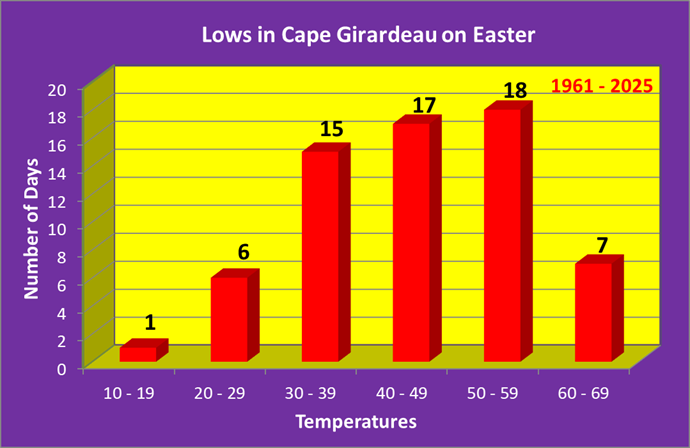
Low temperatures in the 40s or 50s are most common, accounting for 58% of all years on record. There have been 9 years where lows dipped below freezing, most recently in 2008. On the warm side of the spectrum, there have been 7 years with lows in the 60s, with the most recent being in 2025.
| Warmest Lows | Coldest Lows |
| 65 in 2006 | 18 in 2007 |
| 64 in 1992 | 24 in 1964 |
| 64 in 1976 | 26 in 1966 |
| 62 in 2025 | 27 in 1961 |
| 61 in 1973 | 28 in 1975* |
| Normal Low: | 38 - 49 |
*Denotes a tie in previous year(s)
Measurable precipitation has fallen 47% of the time, with over an inch of precipitation falling only once, back in 1993.
| Wettest |
| 1.28 in 1993 |
| 0.88 in 1989 |
| 0.76 in 1961 |
| 0.69 in 2013 |
| 0.68 in 2005 |
Here is a look at the observed weather for the past 15 years:
| Recent Weather for Easter | |||
| Year | High | Low | Precip |
| 4/24/2011 | 64 | 59 | 3.6 |
| 4/8/2012 | 70 | 40 | 0 |
| 3/31/2013 | 65 | 47 | T |
| 4/20/2014 | 78 | 45 | 0 |
| 4/5/2015 | 62 | 33 | T |
| 3/27/2016 | 76 | 39 | 0.01 |
| 4/16/2017 | 78 | 60 | 0.15 |
| 4/1/2018 | 53 | 36 | 0.46 |
| 4/21/2019 | 76 | 38 | 0 |
| 4/12/2020 | 61 | 54 | 0.18 |
| 4/4/2021 | 75 | 36 | 0 |
| 4/17/2022 | 51 | 43 | 0.55 |
| 4/9/2023 | 70 | 39 | 0 |
| 3/31/2024 | 78 | 54 | 0 |
| 4/20/2025 | 81 | 62 | 0.54 |
Climate Data has been recorded at the Poplar Bluff Airport, located 4 miles east of Poplar Bluff, since December of 1997. Prior to that data was taken at the Poplar Bluff COOP station, located a half mile west of downtown. Data for the COOP station dates back to January 1893.
Easter Sunday varies between March 22 and April 25. The date of Easter is the first Sunday after the full moon following the northern hemisphere's vernal equinox on March 21.
Here is a look at high and low temperature frequencies and extremes as well as precipitation statistics for Easter in Poplar Bluff.
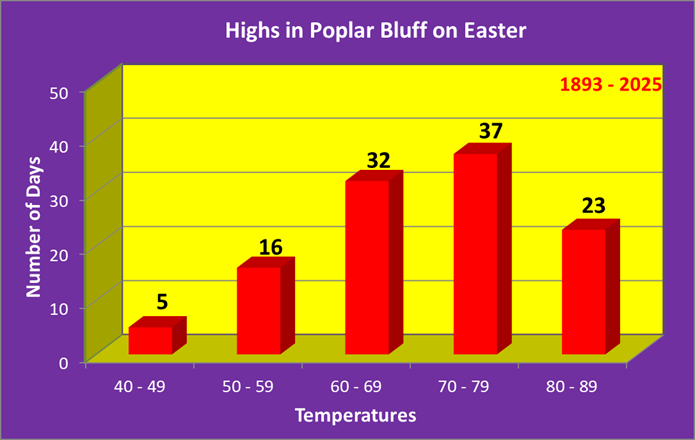
As seen by this graphic high temperatures are predominately in the 60s or 70s on Easter, encompassing 61% of all years on record.
| Warmest Highs | Coldest Highs |
| 88 in 1941 | 41 in 1940 |
| 87 in 2006 | 44 in 1975 |
| 86 in 1946 | 45 in 1894 |
| 85 in 1925 | 47 in 1937 |
| 84 in 1927* | 48 in 2005 |
| Normal High: | 61 - 73 |
*Denotes a tie in previous year(s)
Poplar Bluff has seen highs above 85 degrees 4 times, most recently in 2006. There has also been 5 years where the high temperature failed to reach 50 degrees, most recently in 2005.
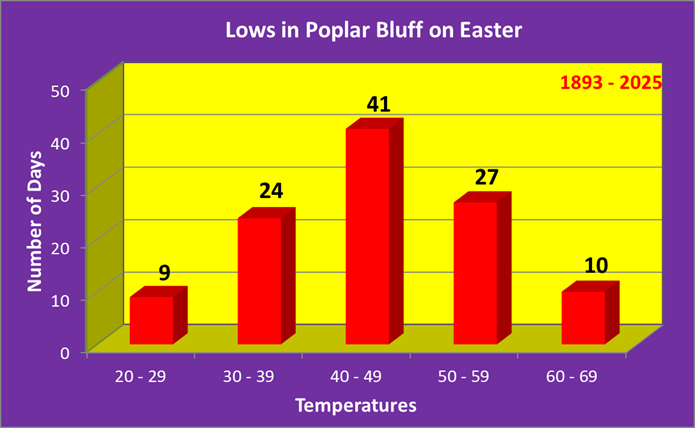
Low temperatures in the 30s, 40s, or 50s are most common, accounting for 83% of all years on record. There have been 9 years where lows dipped below 30 degrees, most recently in 2007. On the warm side of the spectrum, there have been 10 years with lows in the 60s, with the most recent being in 2025.
| Warmest Lows | Coldest Lows |
| 68 in 2006 | 22 in 1964 |
| 65 in 1957 | 23 in 1940 |
| 65 in 1903 | 25 in 2007 |
| 63 in 1973 | 25 in 1937 |
| 62 in 2025* | 25 in 1923 |
| Normal Low: | 40 - 51 |
*Denotes a tie in previous year(s)
Measurable precipitation has fallen 36% of the time, with over an inch of precipitation falling on 9 occasions, most recently in 2022.
| Wettest |
| 2.38 in 2011 |
| 1.92 in 1952 |
| 1.79 in 1917 |
| 1.50 in 1944 |
| 1.40 in 1973 |
Here is a look at the observed weather for the past 15 years:
| Recent Weather for Easter | |||
| Year | High | Low | Precip |
| 4/24/2011 | 67 | 61 | 2.38 |
| 4/8/2012 | 71 | 45 | 0 |
| 3/31/2013 | 65 | 51 | 0.02 |
| 4/20/2014 | 80 | 48 | 0 |
| 4/5/2015 | 63 | 35 | 0.01 |
| 3/27/2016 | 76 | 41 | T |
| 4/16/2017 | 78 | 60 | 0.28 |
| 4/1/2018 | 55 | 36 | 0.55 |
| 4/21/2019 | 78 | 40 | 0 |
| 4/12/2020 | 64 | 53 | 0.62 |
| 4/4/2021 | 75 | 40 | 0 |
| 4/17/2022 | 52 | 41 | 1.05 |
| 4/9/2023 | 68 | 46 | 0 |
| 3/31/2024 | 79 | 59 | 0 |
| 4/20/2025 | 81 | 62 | 0.16 |
Climate Data has been recorded at Southern Illinois Airport, located 4 miles northwest of Carbondale, since August of 1998. Prior to that data was taken at the Carbondale Sewage Plant COOP station, located 3 miles east of Carbondale. Data for the COOP station dates back to November 1898.
Easter Sunday varies between March 22 and April 25. The date of Easter is the first Sunday after the full moon following the northern hemisphere's vernal equinox on March 21.
Here is a look at high and low temperature frequencies and extremes as well as precipitation statistics for Easter in Carbondale.

As seen by this graphic high temperatures are predominately in the 60s or 70s on Easter, encompassing 61% of all years on record.
| Warmest Highs | Coldest Highs |
| 87 in 1946 | 35 in 1940 |
| 87 in 1925 | 40 in 1978 |
| 87 in 1910 | 43 in 2008 |
| 85 in 1941 | 43 in 1970 |
| 83 in 2006* | 43 in 1937* |
| Normal High: | 59 - 71 |
*Denotes a tie in previous year(s)
Carbondale has seen highs above 85 degrees on 4 occasions, most recently in 1946. There has also been 1 year where the high temperature failed to reach 40 degrees, back in 1940.
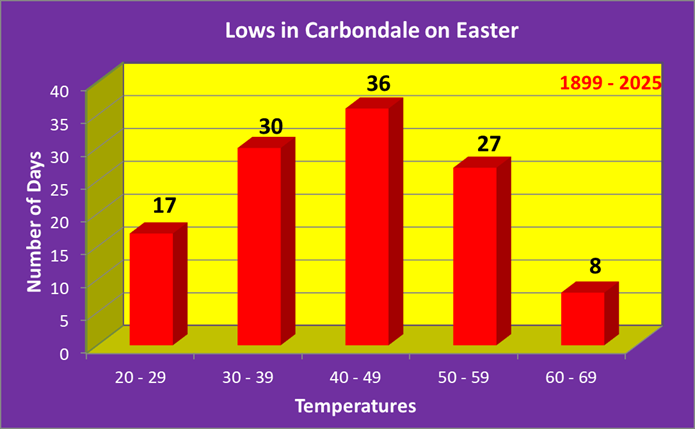
Low temperatures in the 30s, 40s, or 50s are most common, accounting for 78% of all years on record. There have been 5 years where lows falling below 25 degrees, most recently in 2007. On the warm side of the spectrum, there have been 8 years with lows in the 60s, with the most recent being in 2006.
| Warmest Lows | Coldest Lows |
| 68 in 2006 | 20 in 1940 |
| 64 in 1976 | 21 in 1923 |
| 62 in 1992 | 23 in 2007 |
| 62 in 1962 | 23 in 1899 |
| 61 in 1973 | 24 in 1991 |
| Normal Low: | 38 - 48 |
*Denotes a tie in previous year(s)
Measurable precipitation has fallen 34% of the time, with over an inch of precipitation falling on 5 occasions, most recently in 2011.
| Wettest |
| 1.80 in 2011 |
| 1.62 in 1945 |
| 1.25 in 1973 |
| 1.07 in 1952 |
| 1.07 in 1917 |
Here is a look at the observed weather for the past 15 years:
| Recent Weather for Easter | |||
| Year | High | Low | Precip |
| 4/24/2011 | 64 | 57 | 1.80 |
| 4/8/2012 | 67 | 43 | 0 |
| 3/31/2013 | 68 | 48 | 0 |
| 4/20/2014 | 78 | 44 | 0 |
| 4/5/2015 | 62 | 33 | T |
| 3/27/2016 | 75 | 37 | 0.06 |
| 4/16/2017 | 76 | 59 | 0.67 |
| 4/1/2018 | 47 | 33 | 0.58 |
| 4/21/2019 | 77 | 37 | 0 |
| 4/12/2020 | 61 | 53 | 0.09 |
| 4/4/2021 | 76 | 45 | 0 |
| 4/17/2022 | 54 | 43 | 0 |
| 4/9/2023 | 70 | 35 | 0 |
| 3/31/2024 | 80 | 55 | 0 |
| 4/20/2025 | 80 | 58 | 0.62 |

