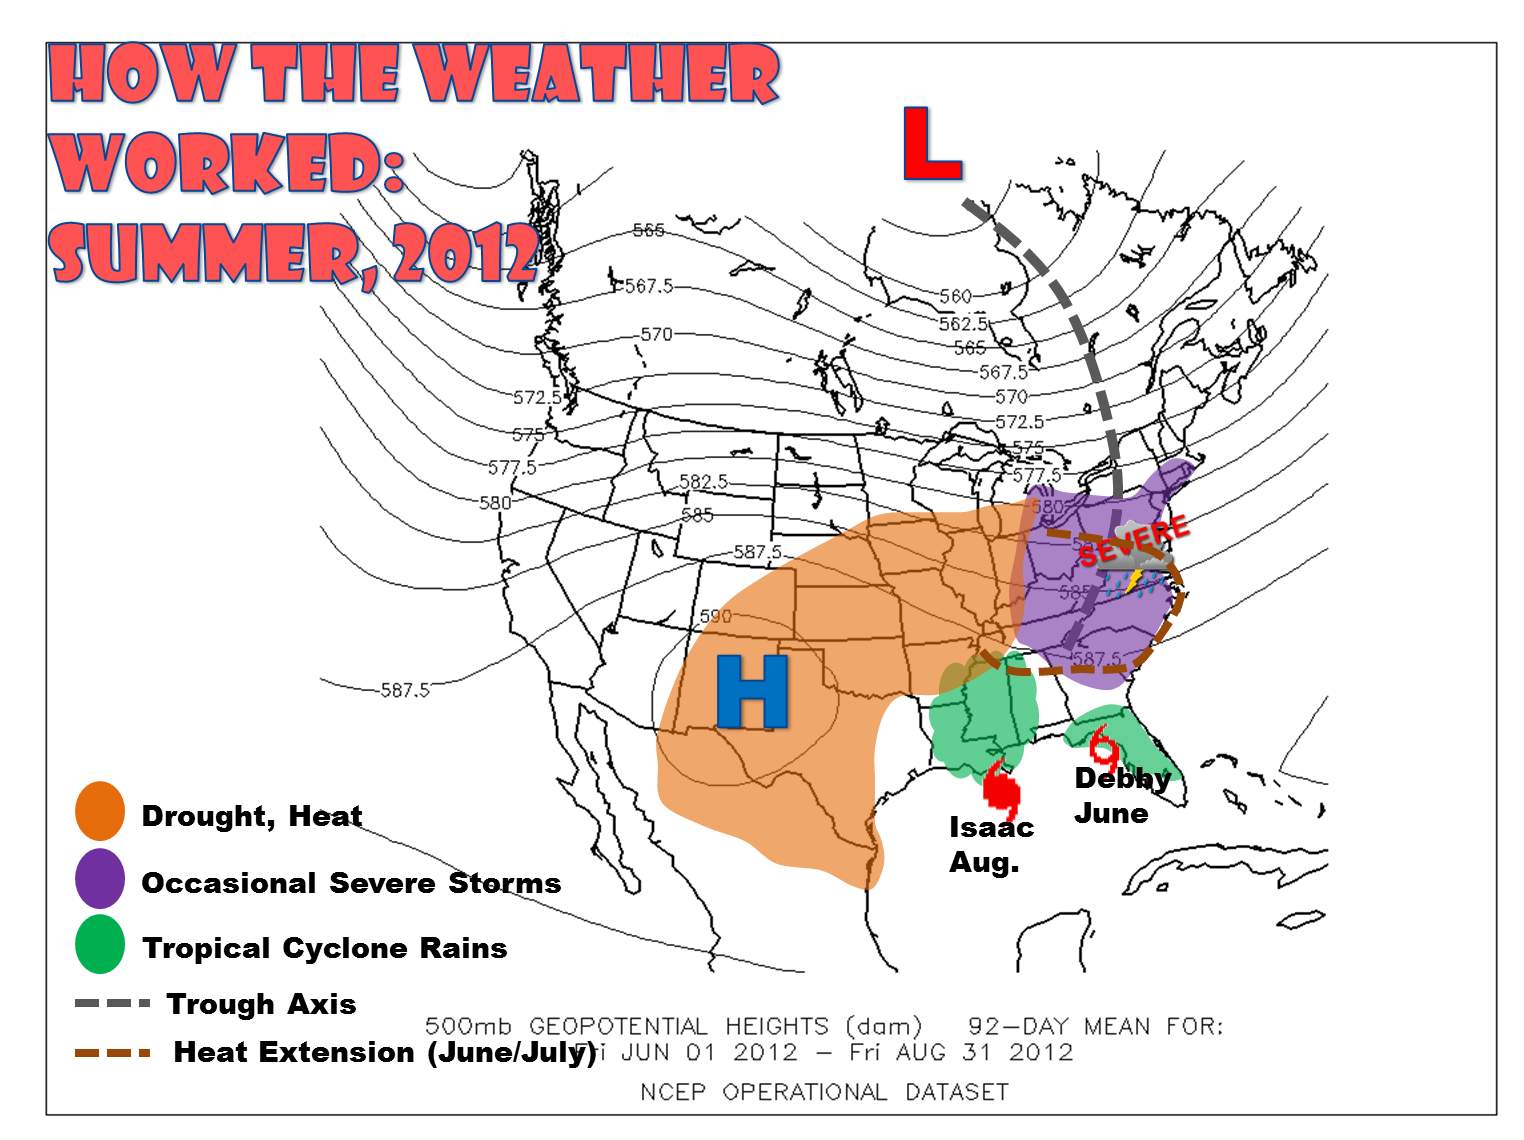
 Critical weather events across the eastern two–thirds of the U.S. overlaid onto map of average 500 mb height contours from June 1 through August 31, 2012. |
|||||||||||||||||||||||||||||||||||||||||||||||||||||||||||||||||||||||
| Another Summer, Another Smoker Hot, Dry Weather Dominates RGV for Second Year in Row |
|||||||||||||||||||||||||||||||||||||||||||||||||||||||||||||||||||||||
|
If you sweltered through the heat this past summer (June through August, 2012), you weren’t alone. For the second year in a row, and third of the most recent four (2009), many locations across the Rio Grande Valley recorded a top ten hottest summer, with records dating back more than 100 years in several locations. For the vast majority of the Rio Grande Valley population, temperatures were among the top five hottest all time (see table below). By early September, McAllen/Miller Airport had exceeded 60 days with high temperatures at or above 100°F; this ranked 2012 with the third highest number of 100°F days behind 2009 and 1998 (tied at 78 days for the calendar year). A map of 100°F days for summer 2012 is shown at right, bottom. While seasonal temperatures were similar to 2011, rainfall varied when compared with the withering drought (through September 2011). Periodic weak upper level disturbances assisted the sea breeze in Cameron County, leading to nearly 10 inches of rain in Brownsville; some of these disturbances combined with uplift provided by thunderstorm outflow boundaries across the Rio Grande Plains ranchlands to leave similar totals across portions of Jim Hogg, Starr, and Zapata County (right). June 30th was one such day. Unfortunately, no such rainy luck found the mid Valley, as rainfall across much of Hidalgo County fell below 25 percent of average. Why so Hot...Again? There may be several interlocking reasons that led to the pattern of hot, dry weather across South Texas and the Rio Grande Valley. One key player may have been the negative phase of the North Atlantic Oscillation, which can favor atmospheric low pressure troughs across eastern North America and broadening high pressure ridges across the central and south central U.S. El Niño Southern Oscillation, which transitioned into the positive phase (El Niño) by summer’s end, shows some correlation between an ongoing or developing El Niño and the North Atlantic Oscillation. |
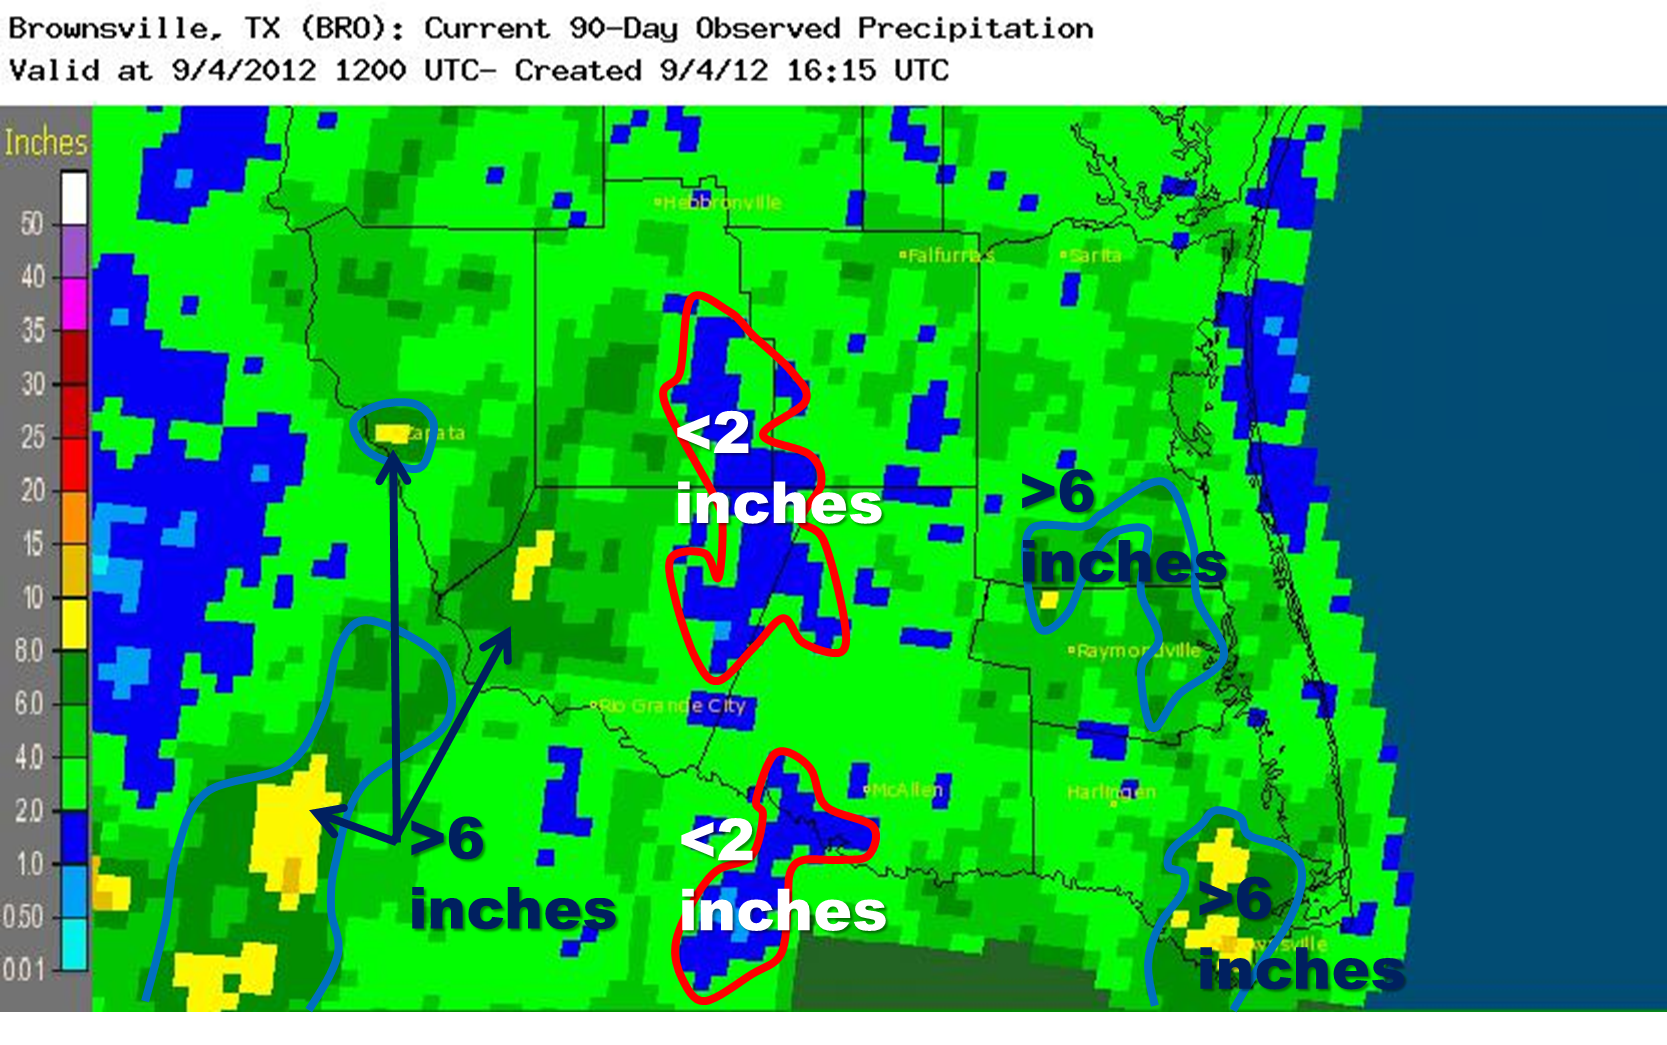 Rainfall Estimates for the Rio Grande Valley for June 1 through August 31, 2012. 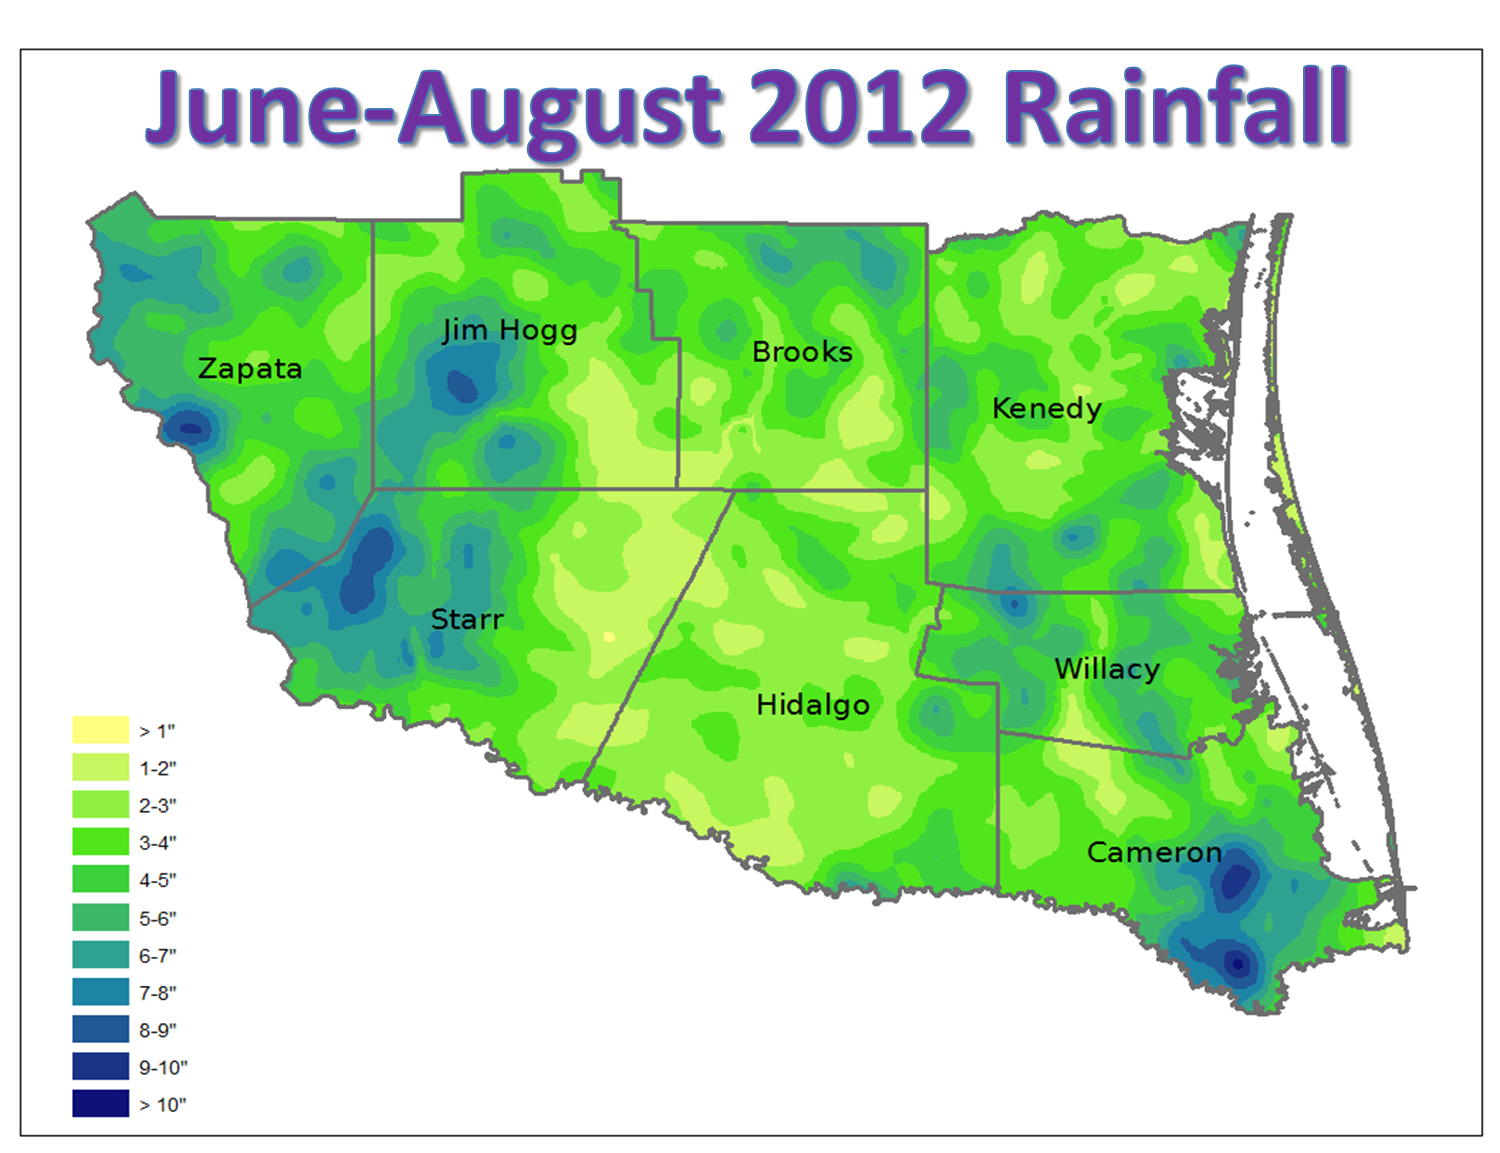 Detailed view of Rainfall Estimates for the Rio Grande Valley for June 1 through August 31, 2012, using GIS. 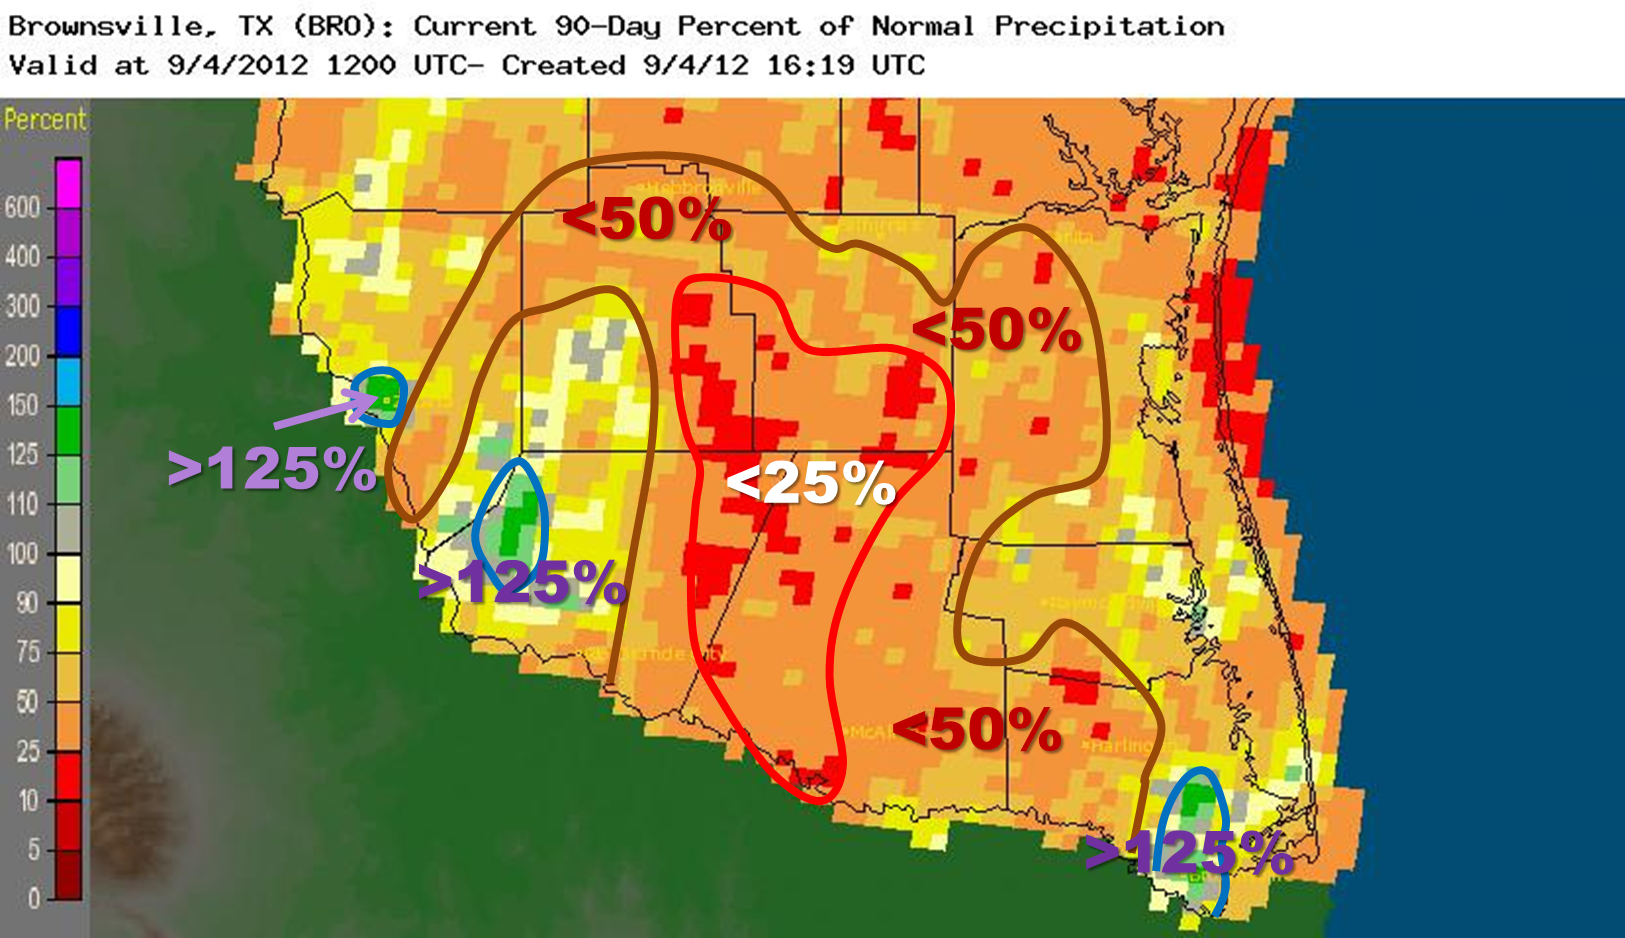 Rainfall Departure Estimates for the Rio Grande Valley for June 1 through August 31, 2012, in percent, based on the most recent 30 year average from 1981 to 2010. 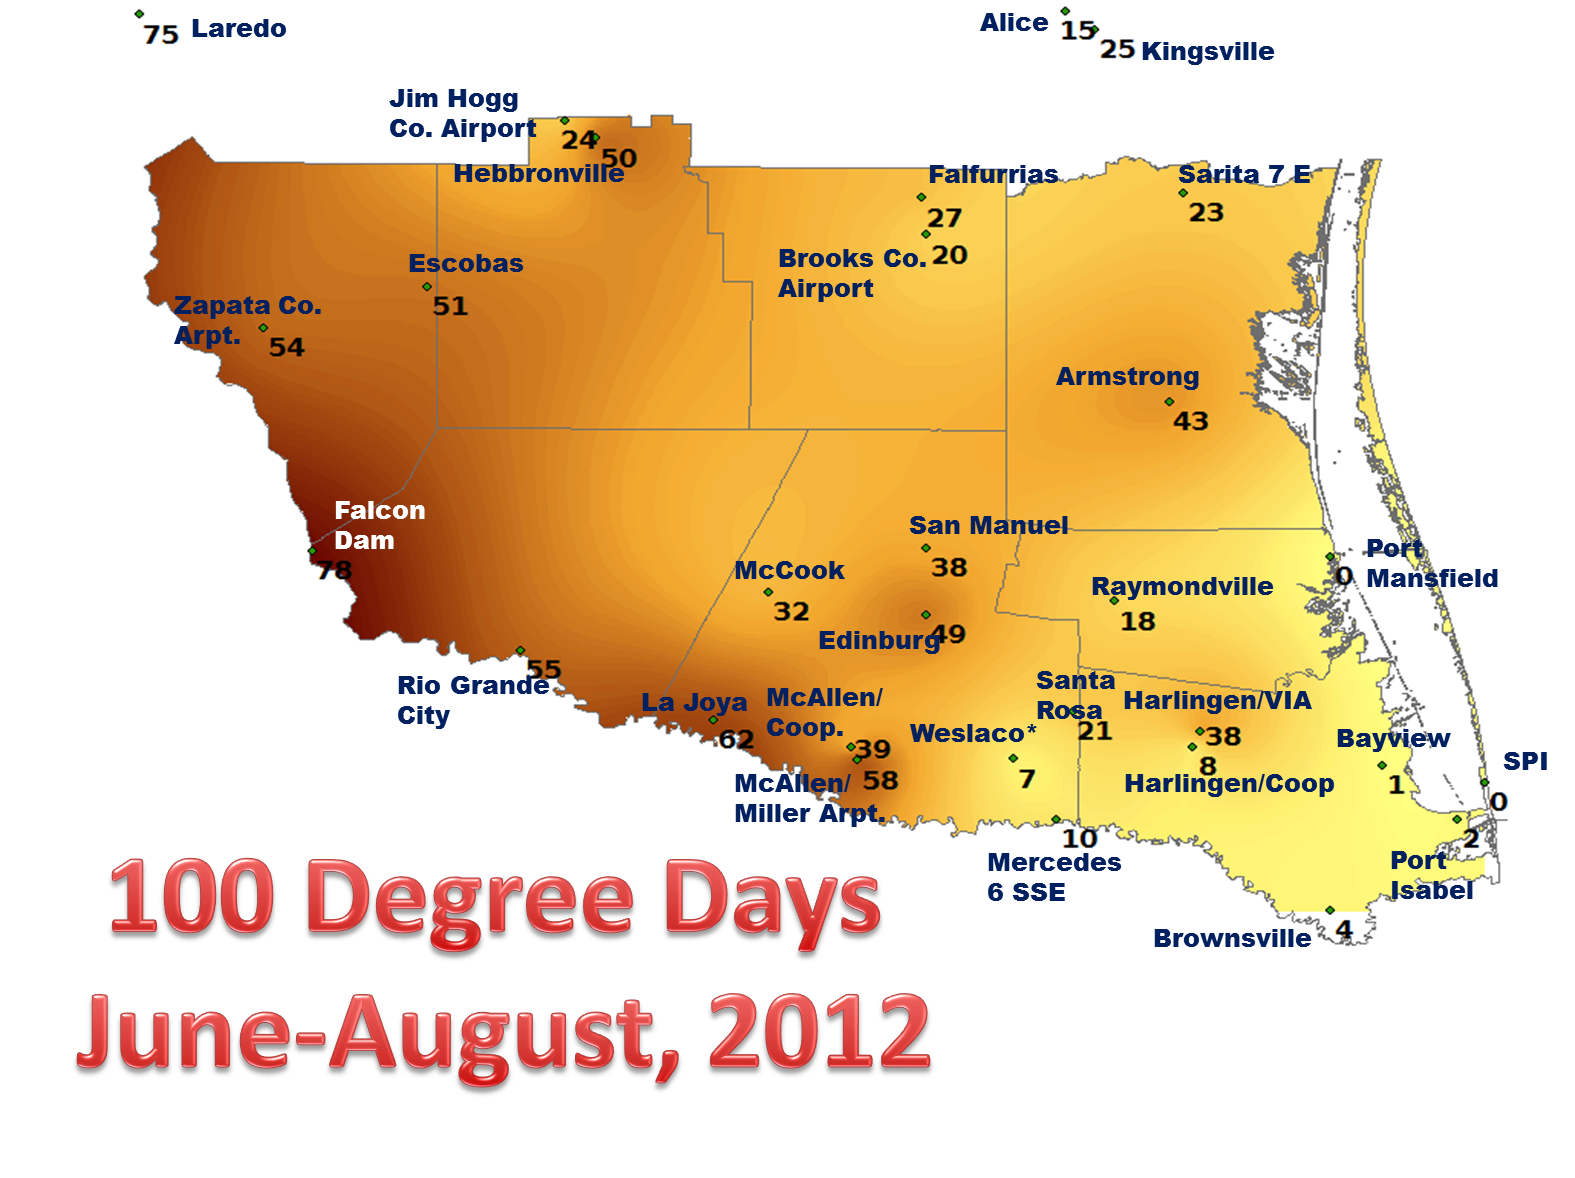 |
||||||||||||||||||||||||||||||||||||||||||||||||||||||||||||||||||||||
*Missing more than 25 percent of data.
Please note that some sites do not have a complete record back to the listed starting year. |
|||||||||||||||||||||||||||||||||||||||||||||||||||||||||||||||||||||||

