 |
 |
 |
 |
 Watches |
 Mesoscale Discussions |
 Day 1 |
 Tornado Probablistic |
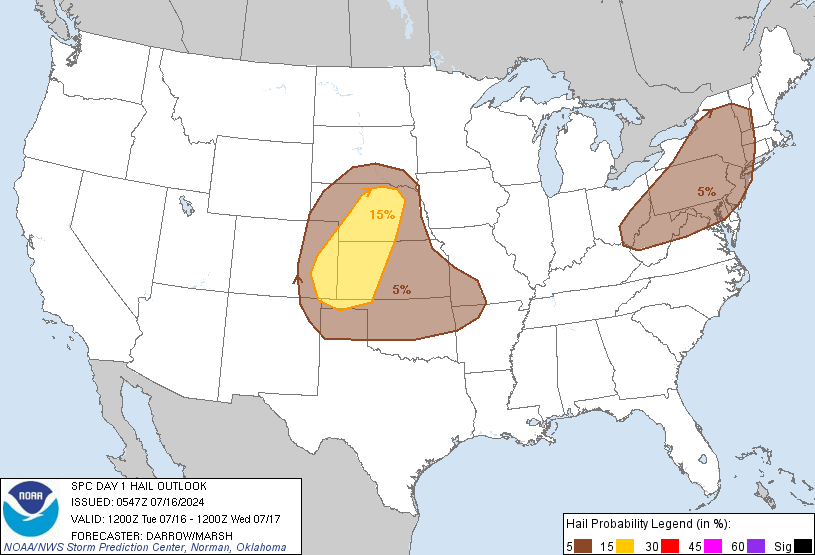 Hail Probablistic |
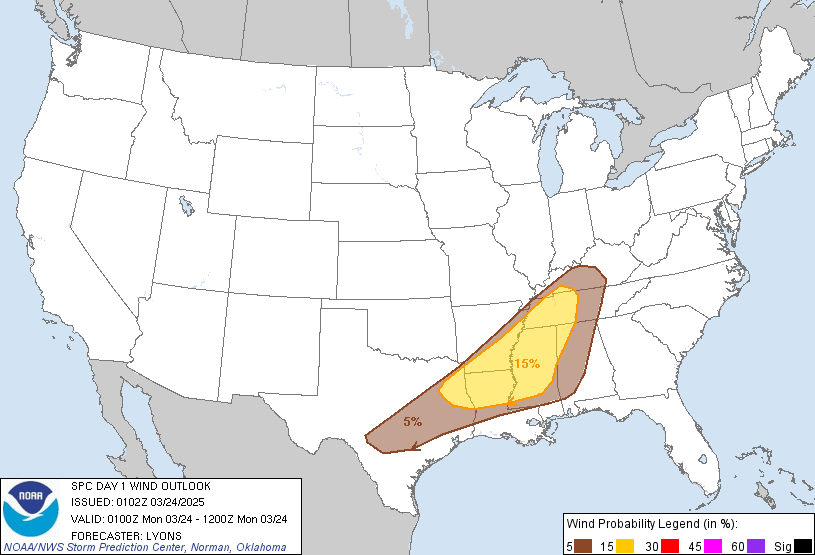 Wind Probablistic |
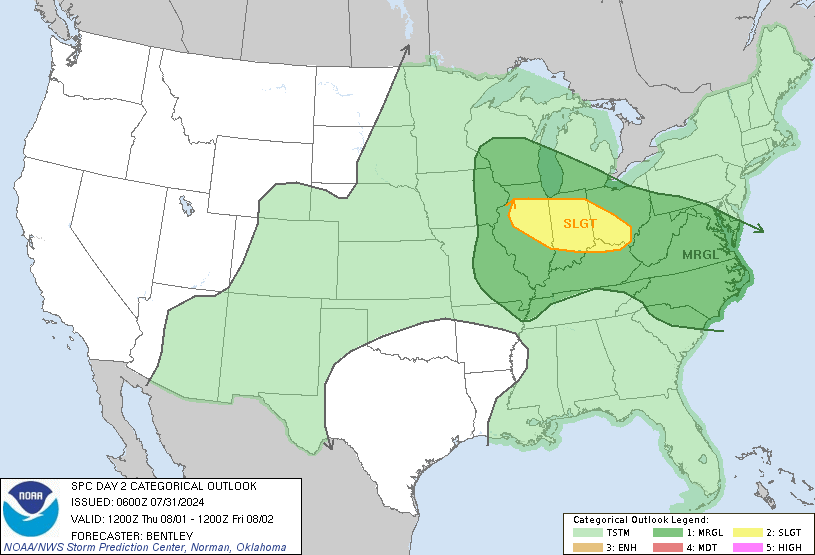 Day 2 |
 Probablistic |
||
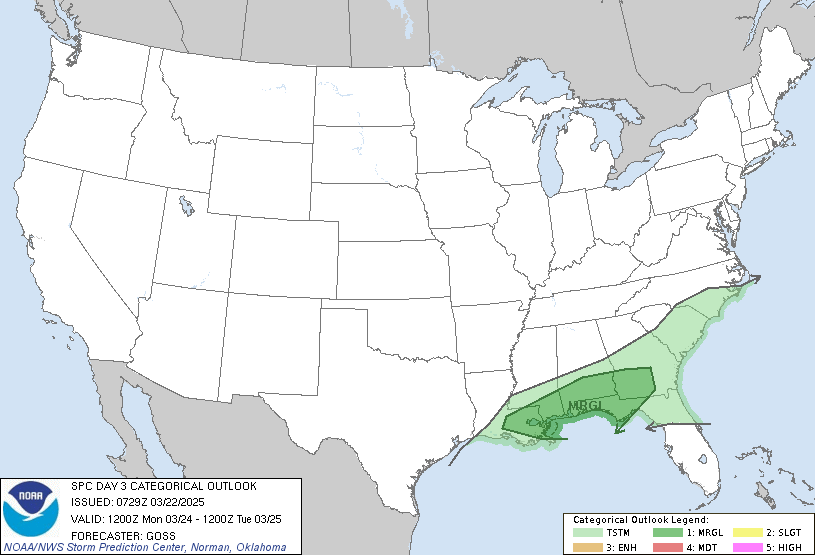 Day 3 |
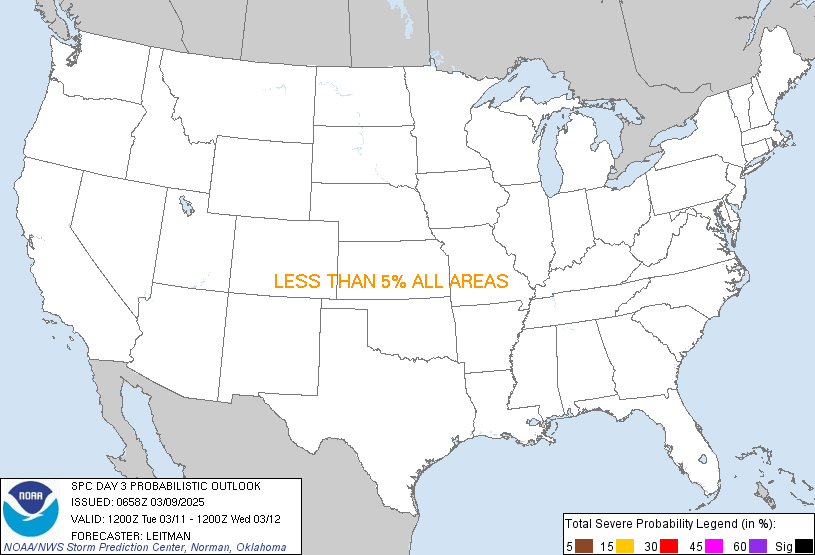 Probablistic |
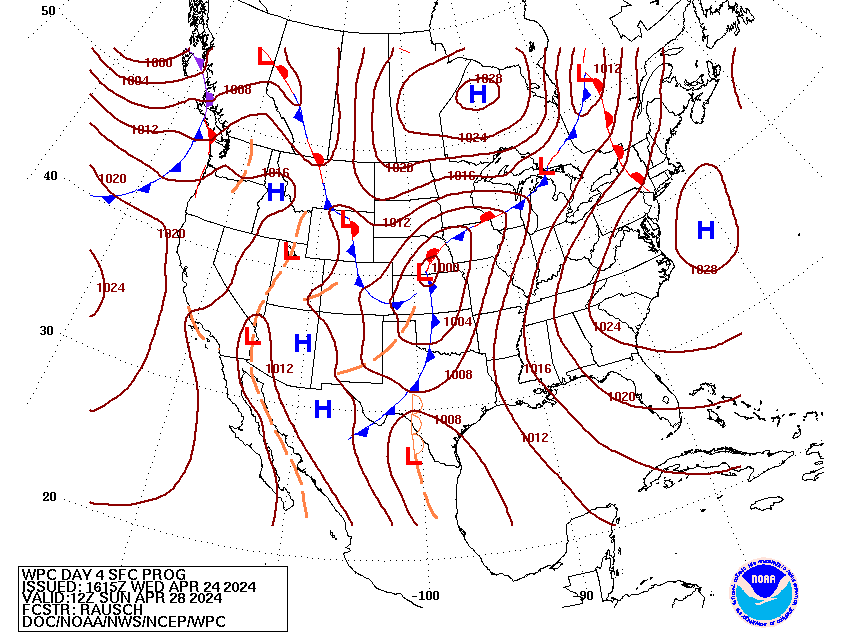
 Day 4 |
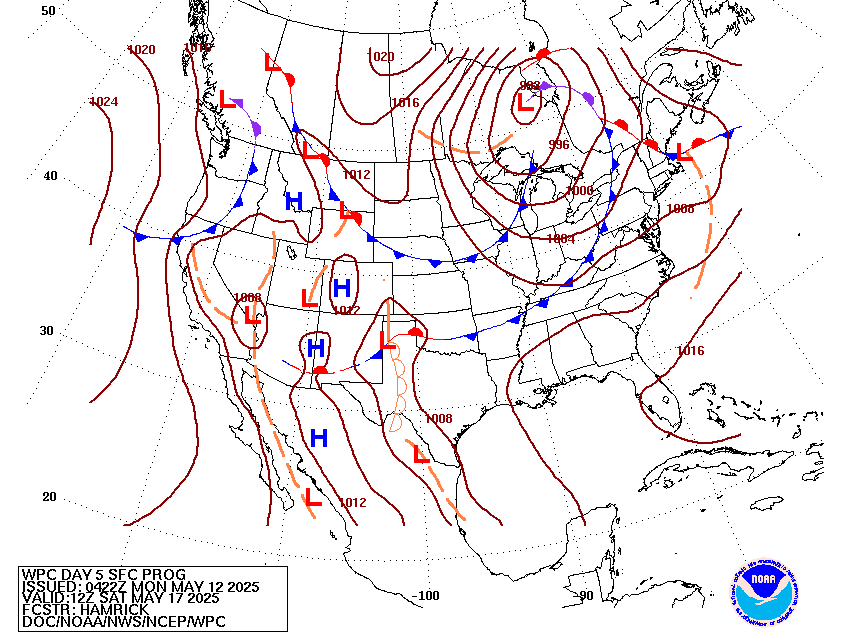
 Day 5 |
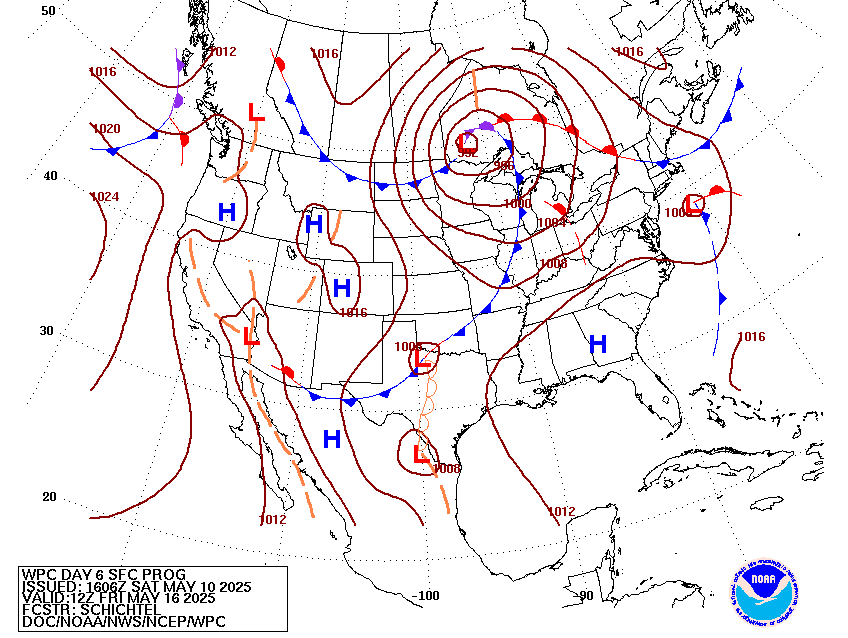
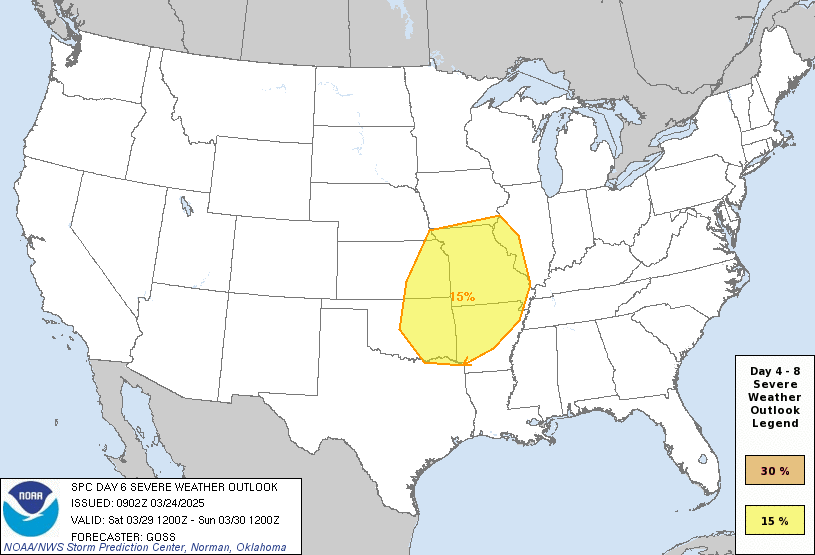 Day 6 |
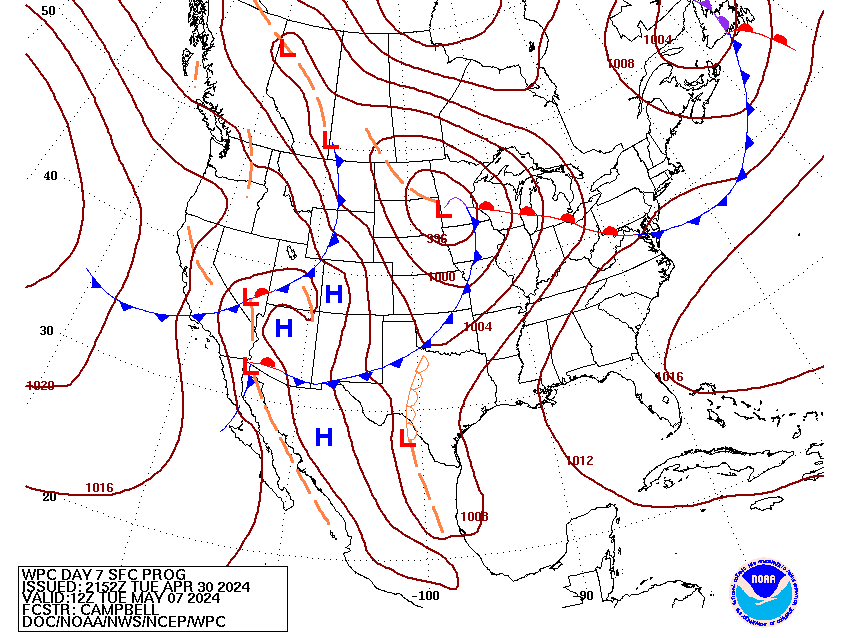
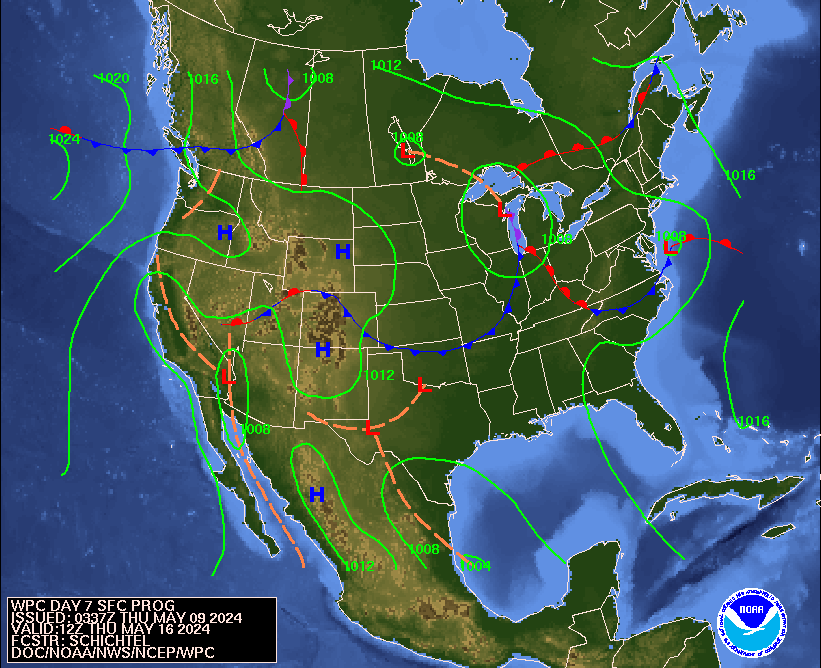
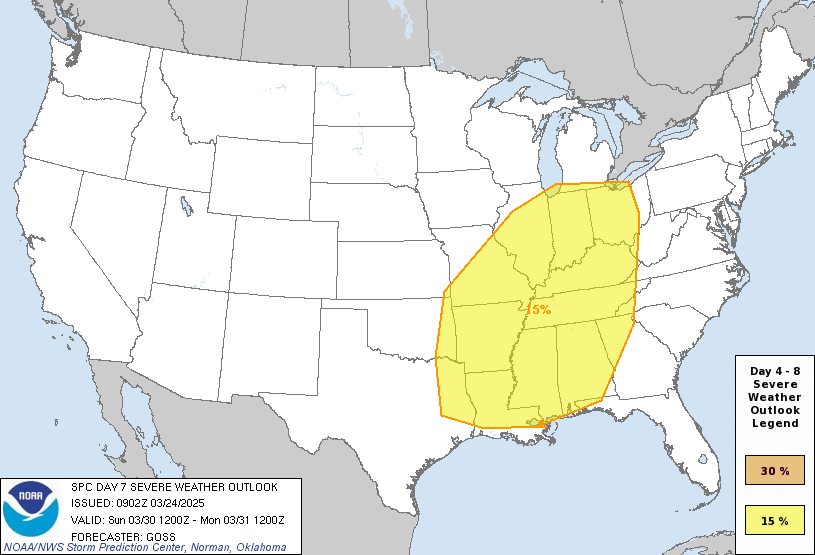 Day 7 |
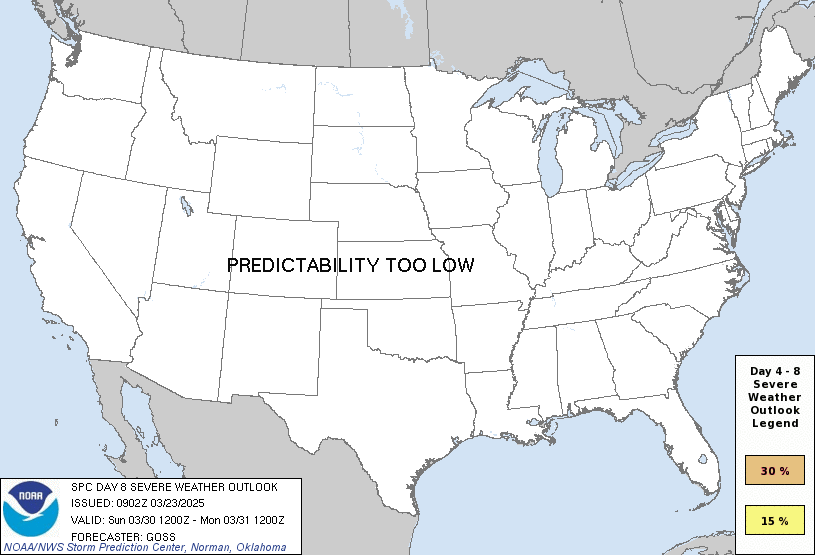 Day 8 |
 Today's Reports |
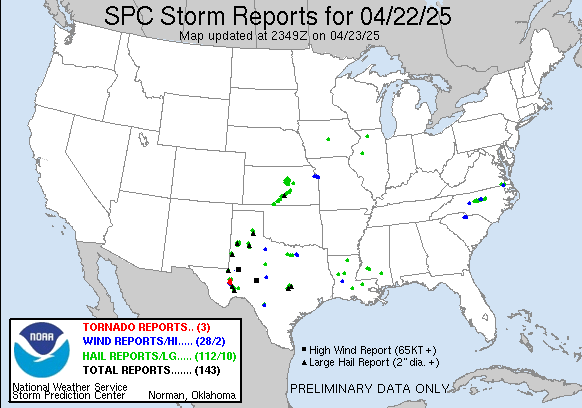 Yesterday's Reports |
 Tornado Reports |
 Hail Reports |
 Wind Reports |
Resources:
Upper Air Maps North America & Satellite |
 U.S. |
 Eastern U.S. |
 6 Hr Fcst |
 12 Hr Fcst |
 18 Hr Fcst |
 24 Hr Fcst |
 30 Hr Fcst |
 36 Hr Fcst |
 48 Hr Fcst |
 60 Hr Fcst |
 6 Hr Fcst |
 12 Hr Fcst |
 18 Hr Fcst |
 24 Hr Fcst |
 36 Hr Fcst |
 48 Hr Fcst |
 60 Hr Fcst |
 Day 3 (B&W) |
 Day 4 (B&W) |
 Day 5 (B&W) |
 Day 6 (B&W) |
 Day 7 (B&W) |
 Day 3 (color) |
 Day 4 (color) |
 Day 5 (color) |
 Day 6 (color) |
 Day 7 (color) |
 Day 3 |
 Day 4 |
 Day 5 |
 Day 6 |
 Day 7 |
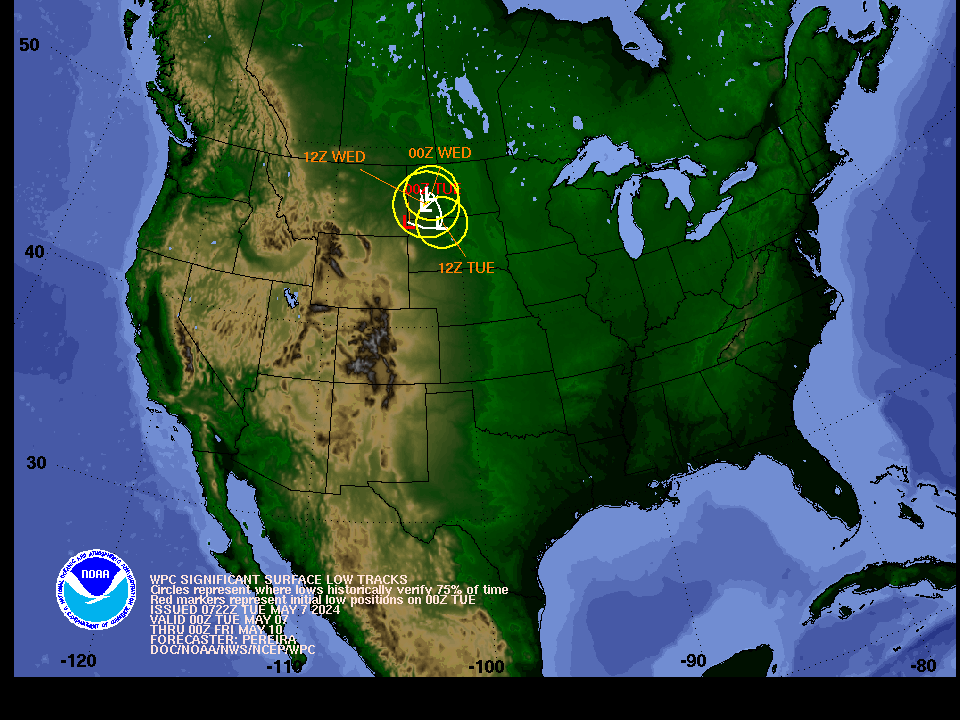
 Low Tracks |
 Low Track Probs |
 Day 1 |
 Day 2 |
 Day 3 |
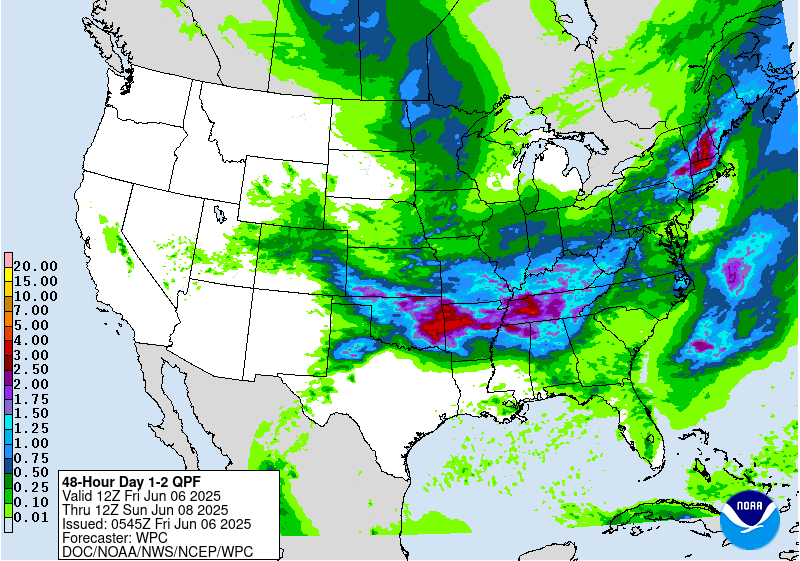 Day 1-2 |
 Day 1-3 |
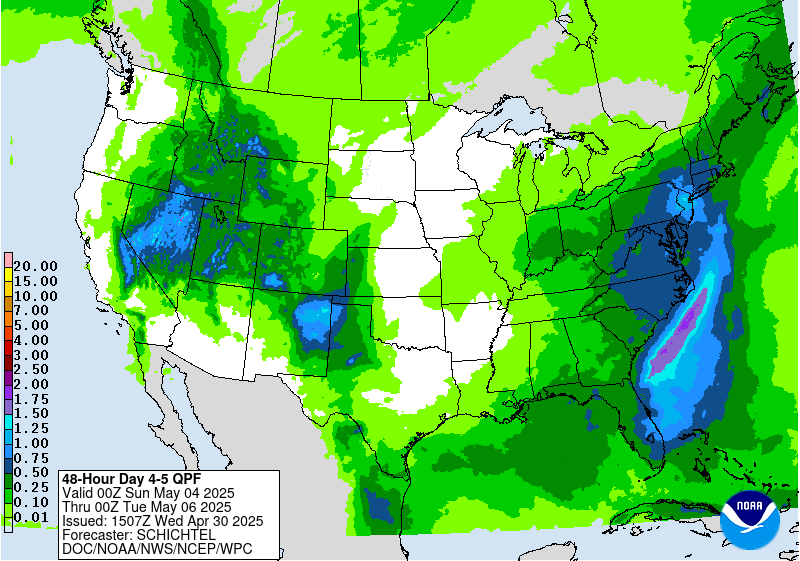 Day 4-5 00z |
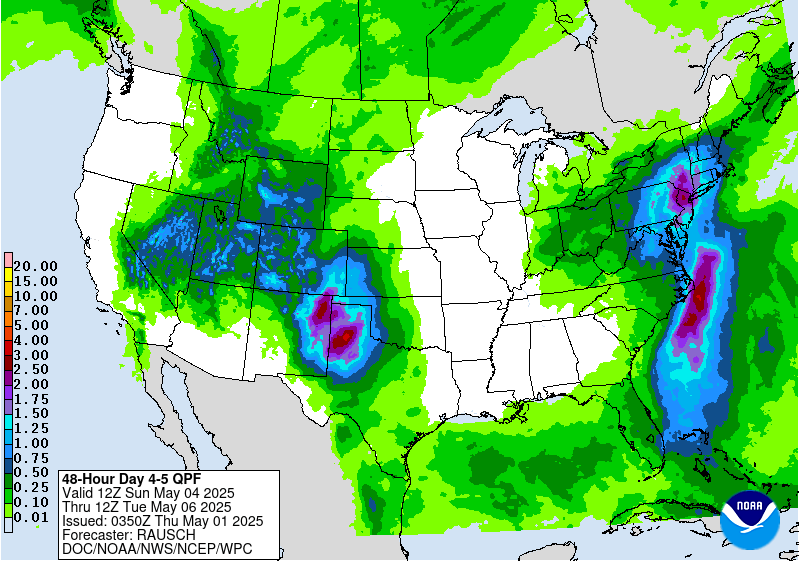 Day 4-5 12z |
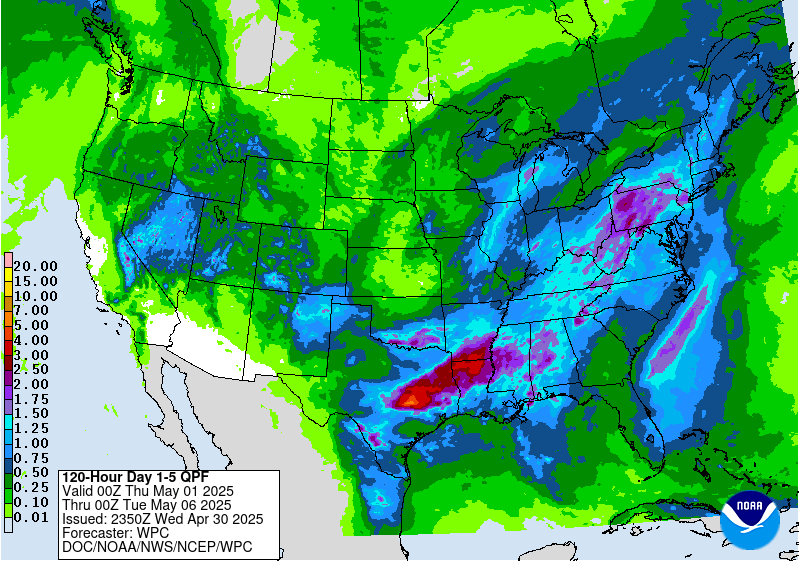 Day 1-5 0z |
 Day 1-5 12z |
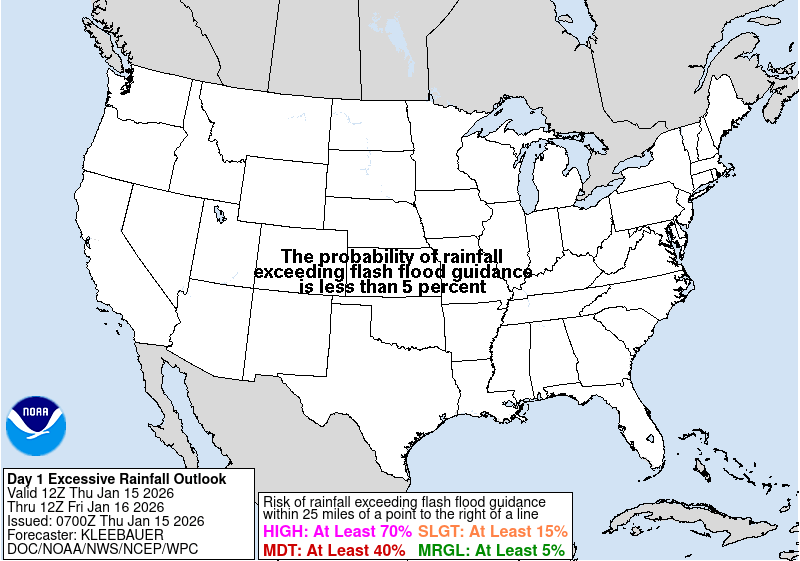 Day 1 FFG |
 Day 2 FFG |
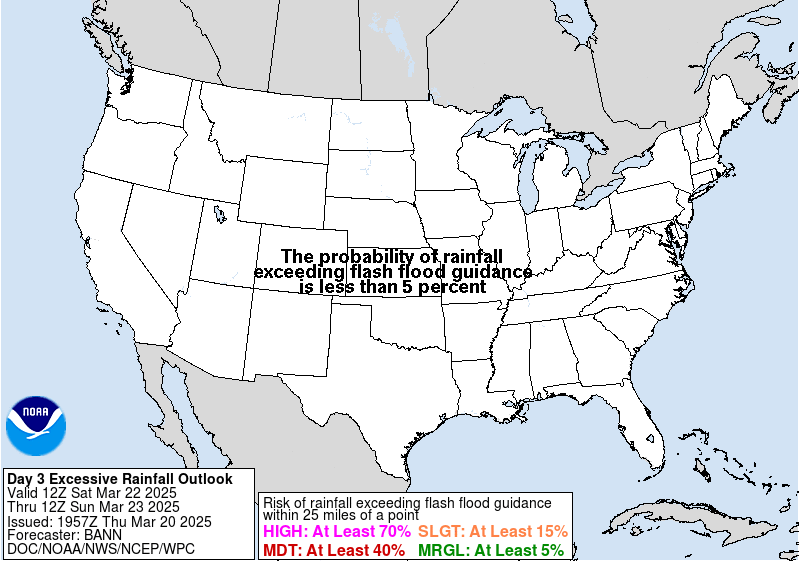 Day 3 FFG |
 Day 1 (Snow > 4) |
 Day 2 (Snow > 4) |
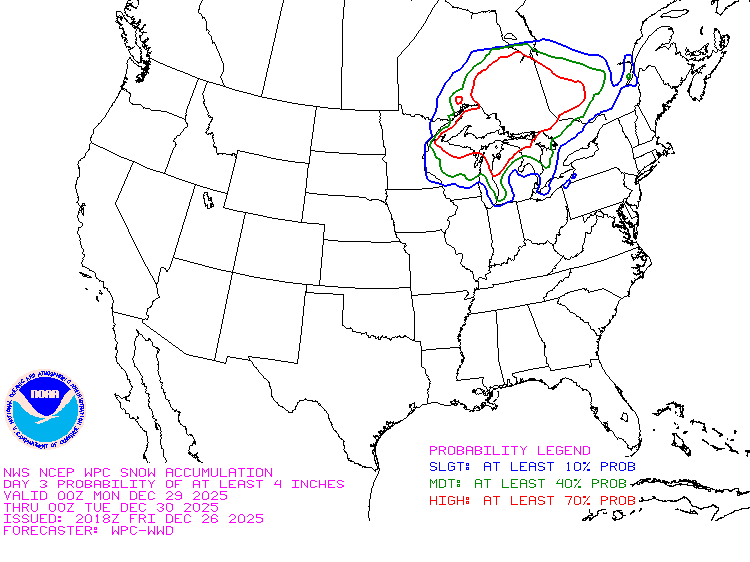 Day 3 (Snow > 4) |
 Day 1 (Snow > 8) |
 Day 2 (Snow > 8) |
 Day 3 (Snow > 8) |
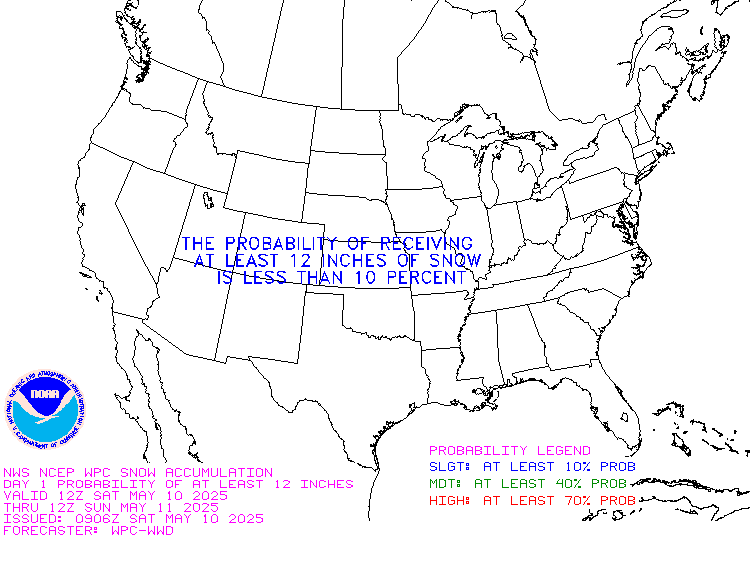 Day 1 (Snow > 12) |
 Day 2 (Snow > 12) |
 Day 3 (Snow > 12) |
 Day 1 (Ice > .25) |
 Day 2 (Ice > .25) |
 Day 3 (Ice > .25) |
Resources:
WPC 6-Hour Probabilistic Precipitation Guidance Days 1-3 6-10 Day Temp |
 6-10 Day Precip |
 8-14 Day Temp |
 8-14 Day Precip |
 One Month Temp |
 One Month Precip |
 Three Month Temp |
 Three Month Precip |
 U.S. Drought Monitor |
 Southeast Drought Monitor |
 Seasonal Drought Assessment |
 NAO |
 AO |
 PNA |
Resources:
CPC Seasonal Outlooks GOES East Visible |
 GOES East IR |
 GOES East WV |
 GOES East AVN |
 GOES East JSL |
 GOES East RGB |
 GOES East Funktop |
 GOES East Rainbow |
 GOES SE CONUS Visible |
 GOES SE CONUS IR |
 GOES SE CONUS WV |
 GOES SE CONUS AVN |
 GOES SE CONUS JSL |
 GOES SE CONUS RGB |
 GOES SE CONUS Funktop |
 GOES SE CONUS Rainbow |
 GOES WFO CAE Visible |
 GOES WFO CAE IR |
 GOES WFO CAE RGB |
 GOES WFO CAE IR2 |
 GOES WFO CAE AVN |
 GOES WFO CAE JSL |
 GOES WFO CAE Funktop |
 GOES WFO CAE Rainbow |
 National |
 Southeast |
 Alt Southeast |
 Columbia |
Resources:
MODIS Today 7-Day Avg Temp |
 14-Day Avg Temp |
 30-Day Avg Temp |
 Month-to-Date Avg Temp |
 Year-to-Date Avg Temp |
 Water-Year Avg Temp |
 Last Month Avg Temp |
 Last 3-Months Avg Temp |
 Last 12-Months Avg Temp |
 7-Day Avg Temp Dept |
 14-Day Avg Temp Dept |
 30-Day Avg Temp Dept |
 Month-to-Date Avg Temp Dept |
 Year-to-Date Avg Temp Dept |
 Water-Year Avg Temp Dept |
 Last Month Avg Temp Dept |
 Last 3-Months Avg Temp Dept |
 Last 12-Months Avg Temp Dept |
 7-Day Precip |
 14-Day Precip |
 30-Day Precip |
 60-Day Precip |
 90-Day Precip |
 6-Month Precip |
 12-Month Precip |
 24-Month Precip |
 36-Month Precip |
|
 Since April 1 Precip |
 Since July 1 Precip |
 Month-to-Date Precip |
 Year-to-Date Precip |
 Water-Year Precip |
 7-Day Precip Dept |
 14-Day Precip Dept |
 30-Day Precip Dept |
 60-Day Precip Dept |
 90-Day Precip Dept |
 6-Month Precip Dept |
 12-Month Precip Dept |
 24-Month Precip Dept |
 36-Month Precip Dept |
|
 Since April 1 Precip Dept |
 Since July 1 Precip Dept |
 Month-to-Date Precip Dept |
 Year-to-Date Precip Dept |
 Water-Year Precip Dept |
 7-Day Precip % Norm |
 14-Day Precip % Norm |
 30-Day Precip % Norm |
 60-Day Precip % Norm |
 90-Day Precip % Norm |
 6-Month Precip % Norm |
 12-Month Precip % Norm |
 24-Month Precip % Norm |
 36-Month Precip % Norm |
|
 Since April 1 Precip % Norm |
 Since July 1 Precip % Norm |
 Month-to-Date Precip % Norm |
 Year-to-Date Precip % Norm |
 Water-Year Precip % Norm |
 Day 1 Max T |
 Day 2 Max T |
 Day 1 Min T |
 Day 2 Min T |
 SC 24 hr Total QPF |
 SC 3 Day Total QPF |
 SC 2 Day Total Snowfall |
 SC Total Ice Accumulation |
 GA 24 hr Total QPF |
 GA 3 Day Total QPF |
 GA 2 Day Total Snowfall |
 Day 1 Max T |
 Day 2 Max T |
 Day 3 Max T Day 3 Max T |
 Day 1 Min T |
 Day 2 Min T Day 2 Min T |
|
 Day 1 Convective Outlook |
 Day 2 Convective Outlook |
 Day 3 Convective Outlook |
 24-Hour Total QPF |
 3-Day Total QPF |
 3-Day Snow Accumulation |
 Current Temps (CONUS) |
||
 Day 1 Max T |
 Day 2 Max T |
 Day 3 Max T |
 Day 1 Min T |
 Day 2 Min T |
|
 3-Day Precipitation |
 36-Hr Snowfall |
Resources:
CAE NDFD GIS GraphicsResources:
CR Warning Impact Graphics Cheraw (CHES1) |
 Camden (CMDS1) |
 Columbia (COLS1) |
 Carolina Eastman (CEAS1) |
 Chappells (CHAS1) |
 Orangeburg (ORBS1) |
 Modoc (MODS1) |
 Augusta (AUGG1) |
Resources:
Saluda River at Saluda Shoals Park Water TempResources:
NWS Awareness Weeks Calendar


