Dangerous heat will expand from the Gulf Coast into the Southern Plains and Desert Southwest through week's end. Additional extreme heat impacting the Pacific Northwest will shift to the northern Plains by the weekend. Tropical Storm Bertha is expected to continue to impact portions of the northern Gulf Coast from the western Florida Panhandle to southeastern Louisiana through tonight. Read More >
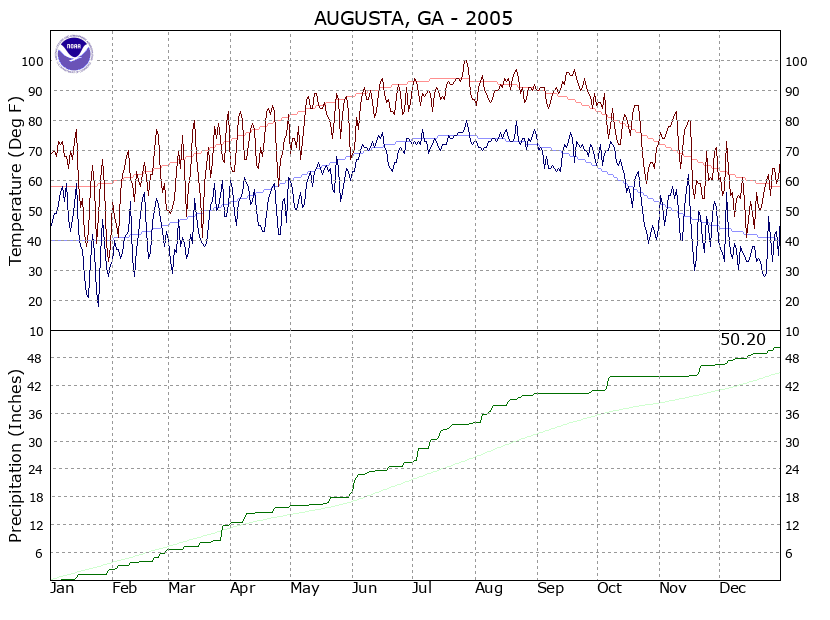
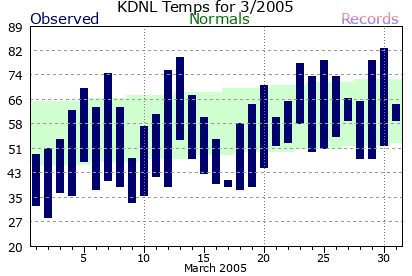
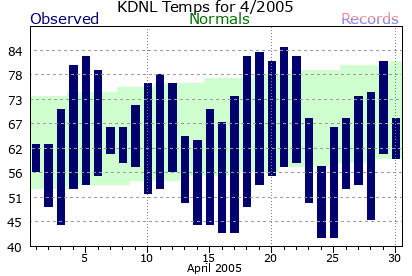
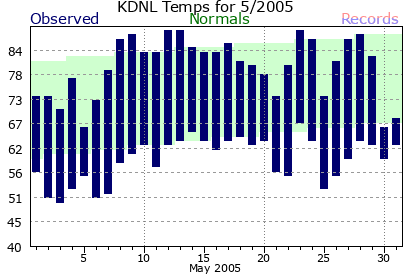
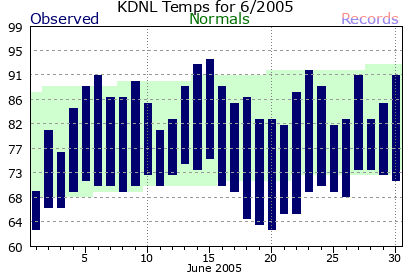
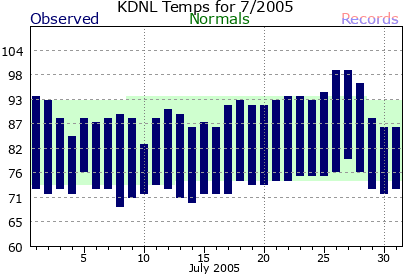
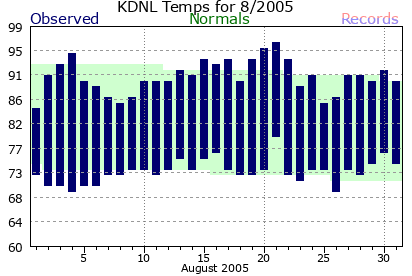
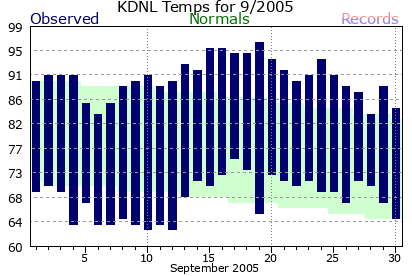
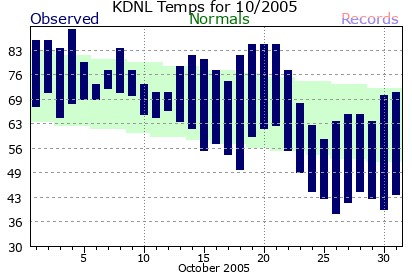
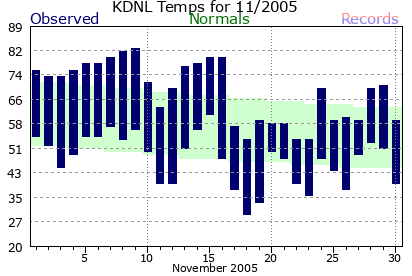
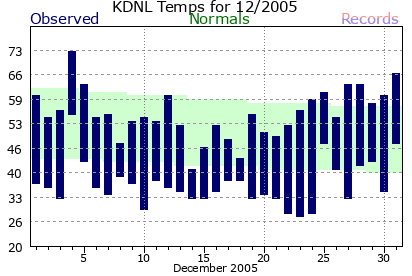
2005 Augusta Daniel Field Climate PlotsClimate data on this page is PRELIMINARY (unofficial). CERTIFIED (official) climate data is available from the National Climatic Data Center (NCDC).
|