National Weather Service United States Department of Commerce

Bering Sea Storms for Alaska; Multi-Day Heavy Rain Event for the Southern Plains and Southwest

A series of Bering Sea storms will impact western Alaska this week, with elevated water levels, isolated coastal flooding, high surf, erosion, and strong winds. Heavy rain and snow are also expected for the West Coast into Interior Alaska. A multi-day flash flooding threat is forecast across parts of the southern High Plains and Southwest through the weekend. Surf remains high for Florida. Read More >


2012 Augusta Daniel Field Climate Plots

Climate data on this page is PRELIMINARY (unofficial). CERTIFIED (official) climate data is available from the National Climatic Data Center (NCDC).


Back to Main Cliplots Page


Year 2012
click to enlarge


Current 31 Day Period
click to enlarge


January 2012
click to enlarge

February 2012
click to enlarge

March 2012
click to enlarge

April 2012
click to enlarge

May 2012
click to enlarge

June 2012
click to enlarge

July 2012
click to enlarge

August 2012
click to enlarge

September 2012
click to enlarge

October 2012
click to enlarge

November 2012
click to enlarge

December 2012
click to enlarge

How to Read the Plots:

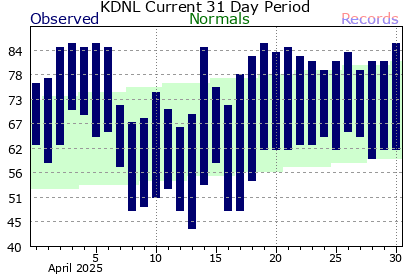
Below is an example of the monthly climate plot. The observed high and low temperatures are indicated by the tops and bottoms of the vertical blue bars, respectively. The normal temperature ranges are indicated by the green band. Record highs are shown on the top of the light pink band, and record lows are indicated along the bottom of the light blue band.

Please note that Columbia Metro and Augusta Bush Field will have both the normals and record data included on the plots. Jim Hamilton - L.B. Owens Airport, Orangeburg, and Augusta Daniel Field will only have the normals.


Next we have an example of the year to date climate plot. As with the monthly plot, observed temperatures are shown by the dark blue areas, normals with the light green areas, record highs in the light red areas, and record lows in the light blue areas. The bottom portion of the graph indicates the precipitation for the year to date. The yellow line (and green area below it) represents the normal year to date total at the given time frame. Periods that have year to date totals above the climatological normals are shown by dark green areas above the yellow line. Periods that are below normal are shown with the brown areas below the yellow line.

Please note that Columbia Metro and Augusta Bush Field will have both the normals and record data included on the plots. Jim Hamilton - L.B. Owens Airport, Orangeburg, and Augusta Daniel Field will only have the normals.