
Dangerous and extreme heat will remain across portions of the Central U.S. this week, persisting across the Mid to Lower Mississippi Valleys, Gulf Coast, Southern Plains and portions of Texas. A heat wave over the Southwest will intensify late this week. Severe thunderstorms and flash flooding will spread from the Great Lakes/Ohio Valley to the Mid-Atlantic and Northeast the next few days. Read More >
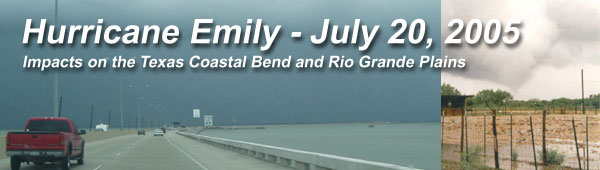
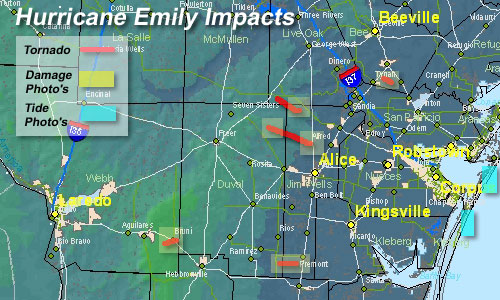
Hurricane Emily made landfall approximately 200 miles to the south of Corpus Christi in Northeastern Mexico on July 20, 2005, however the mid Texas coast experienced two of the four major hazards that hurricanes can offer, including coastal flooding and tornadoes. 
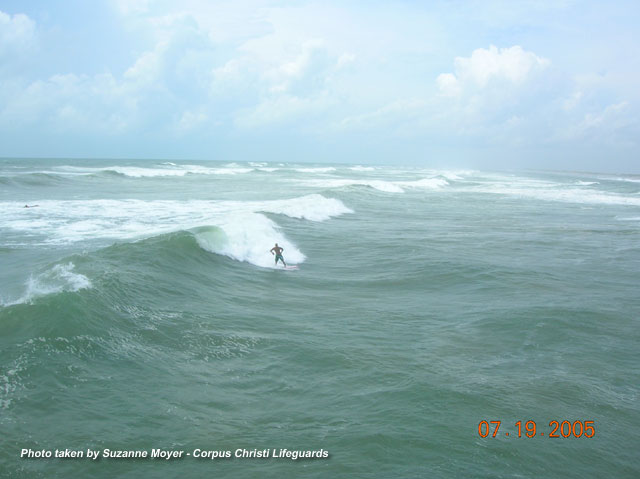
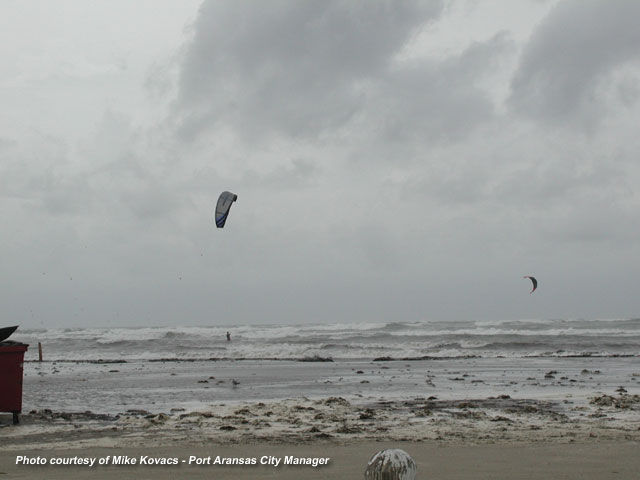
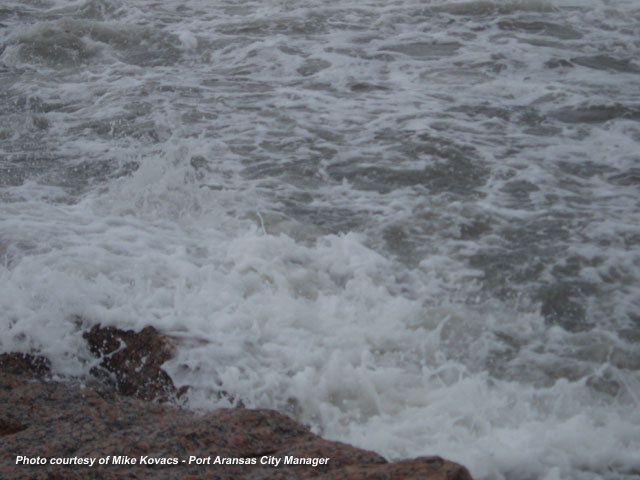
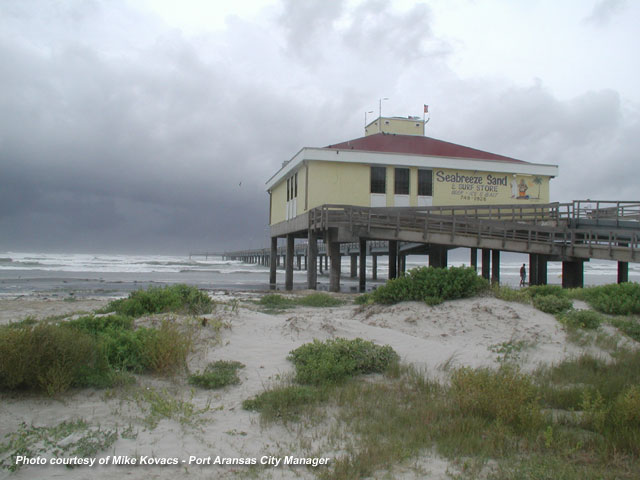
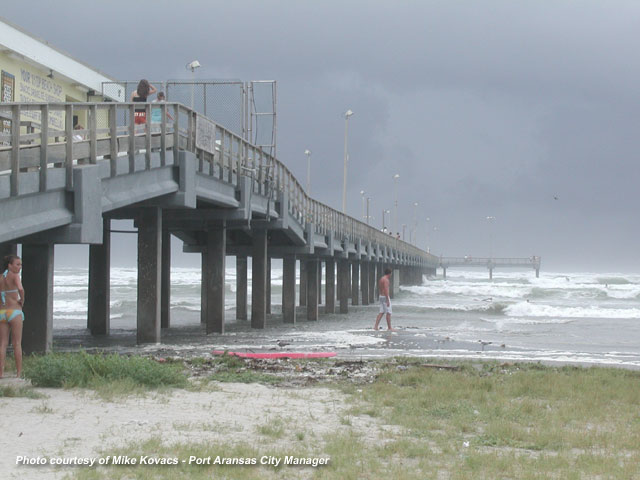
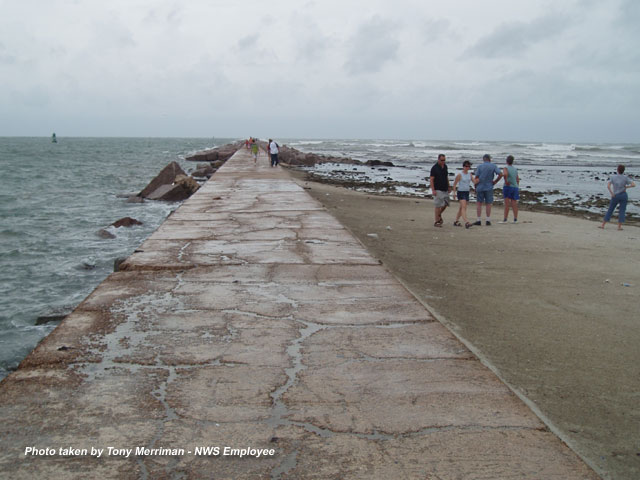
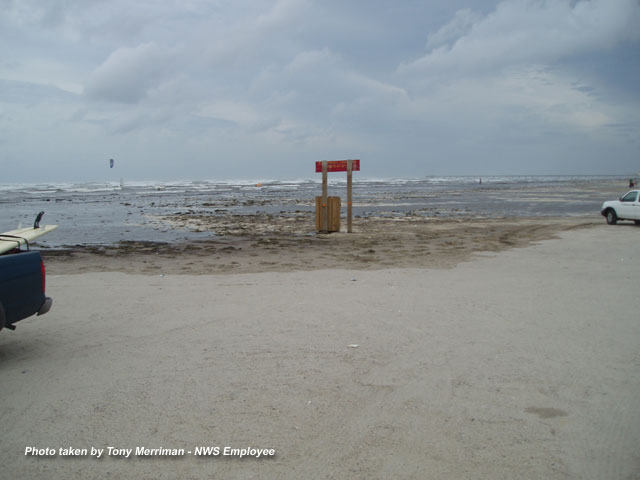
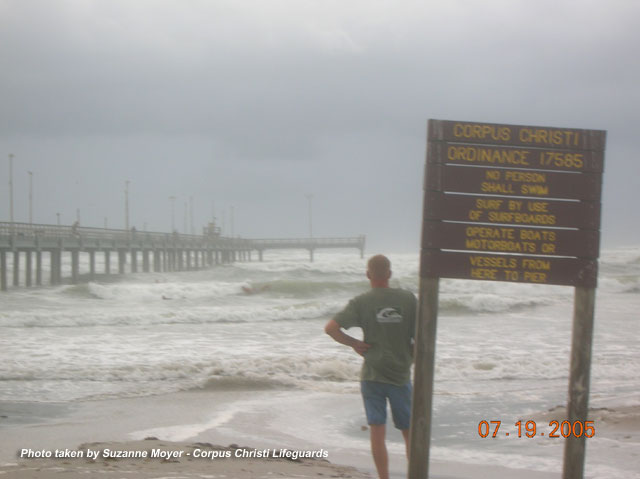
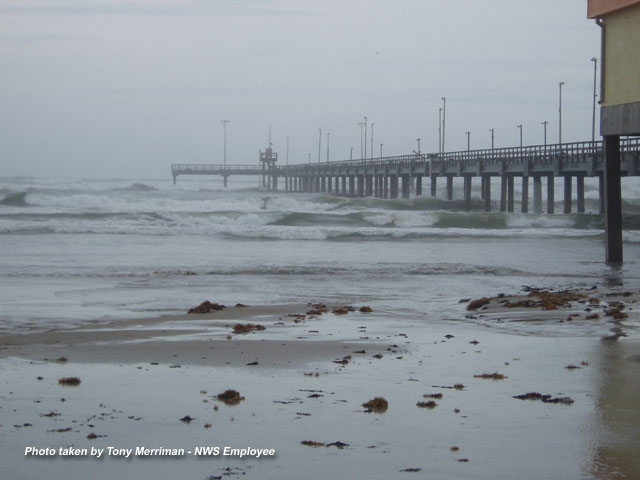
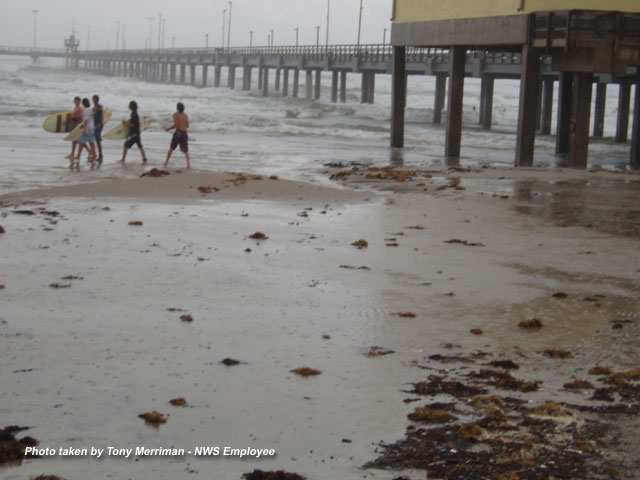
Forecasters at the National Weather Service worked around the clock monitoring Emily's every move for over a week before she made landfall. Coordination calls were made every 6 hours with the National Hurricane Center (NHC) and with local officals in the South Texas region. The NHC track forecast was very accurate and the coastal bend was spared from the brunt of the storm. Emily Storm History  However the powerful winds from Emily generated large 30 foot waves over the open ocean, which were dampened slightly before pounding the mid Texas coast. The large swells were excellent for surfing, but potentially deadly, helping to produce strong rip currents that could easily push the inexperienced swimmer out to sea.
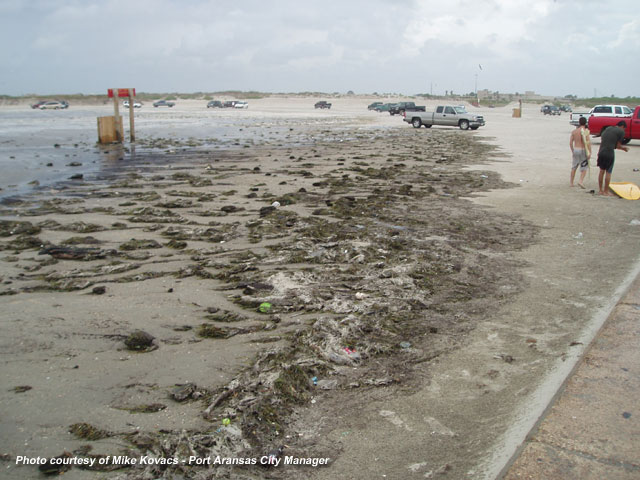
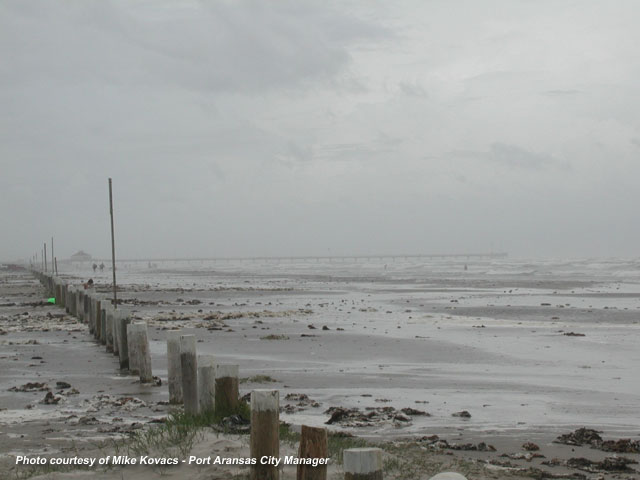
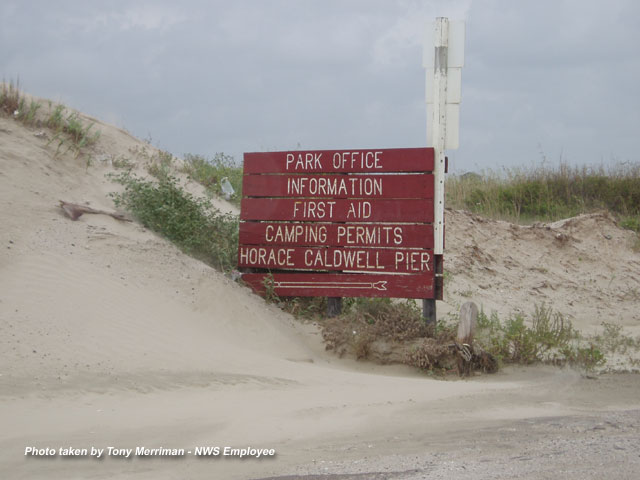
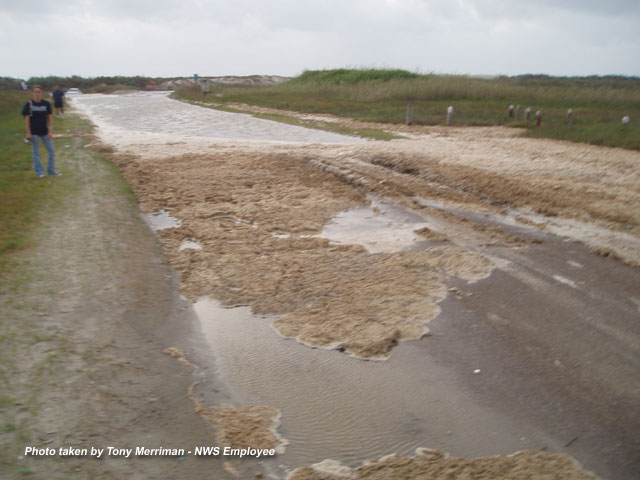
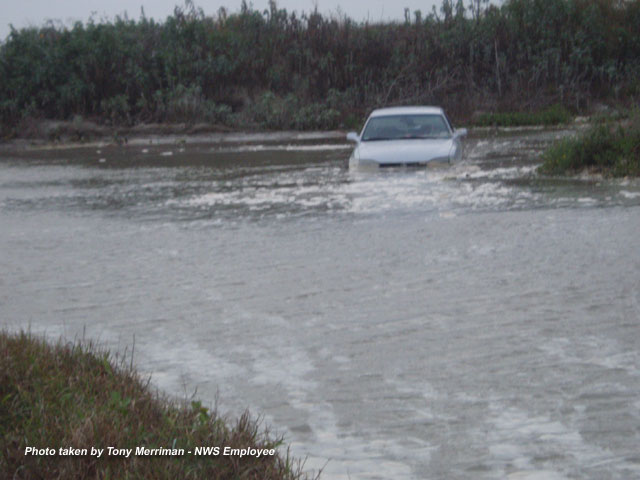
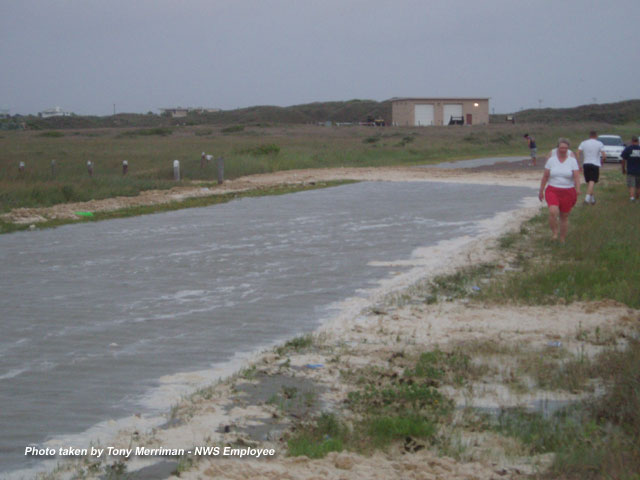
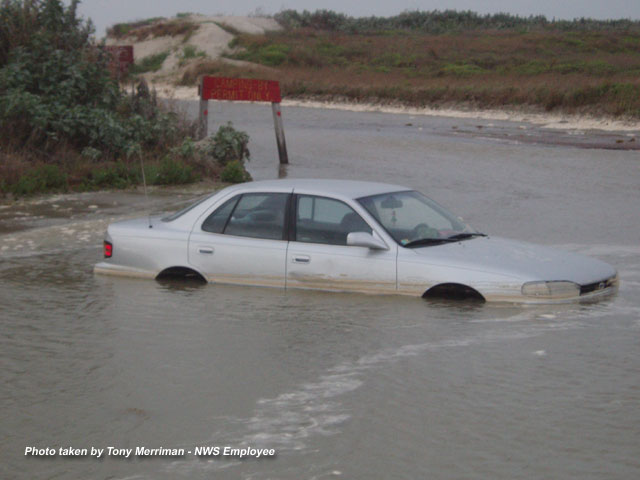
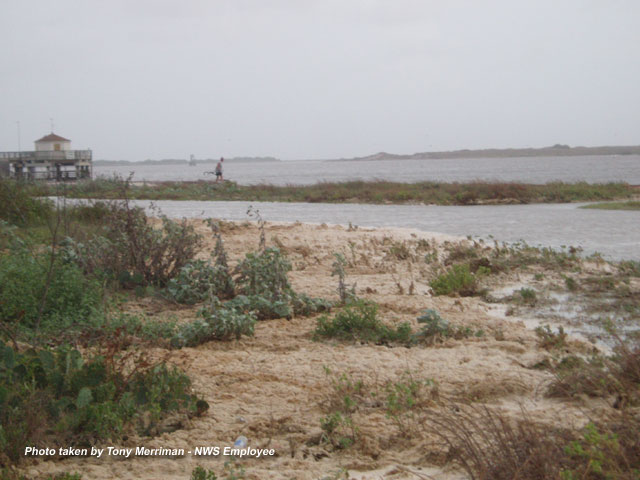
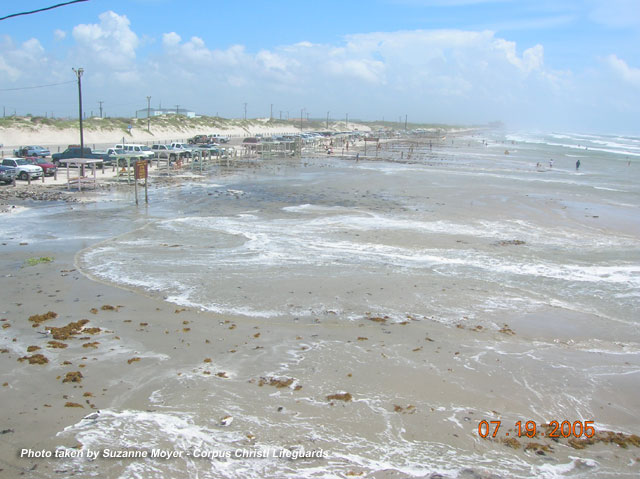
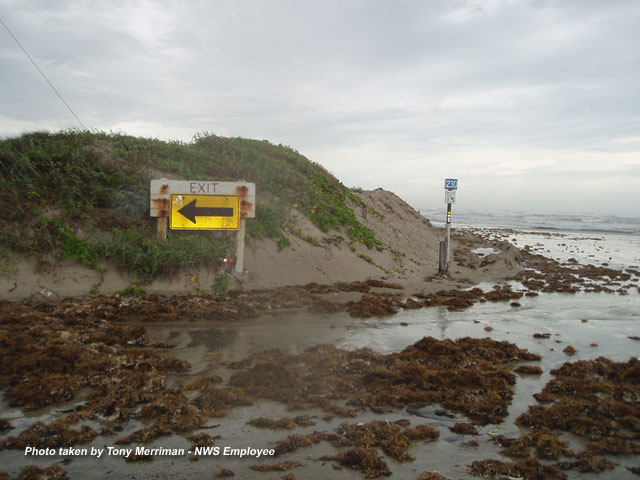
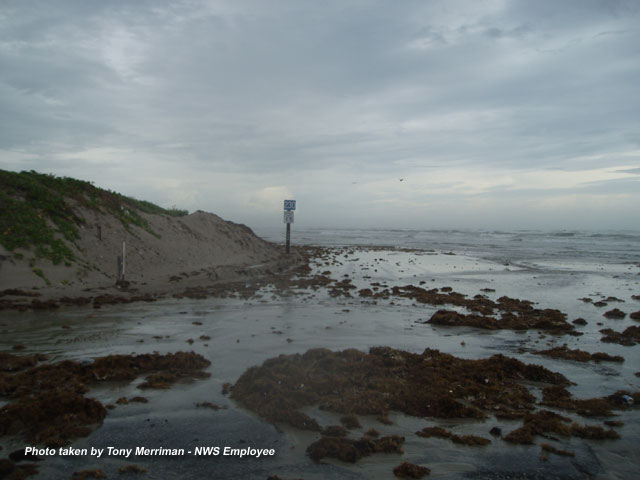
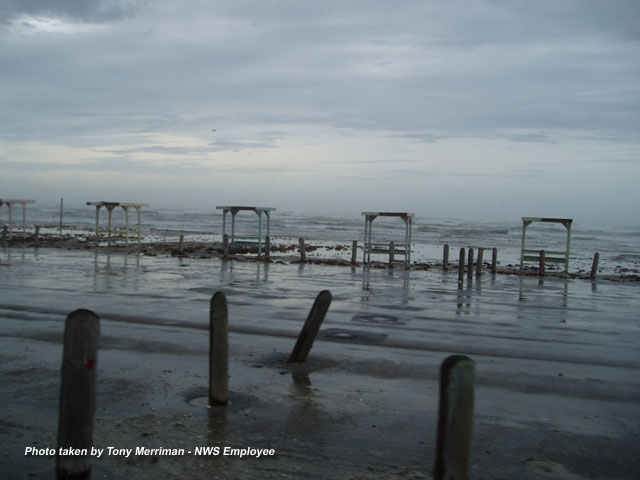
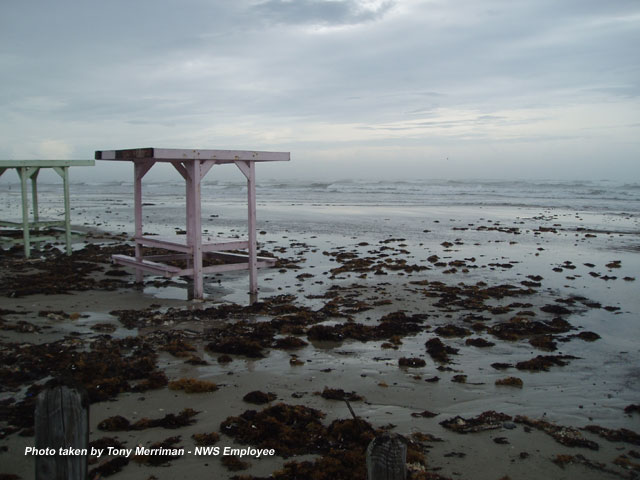
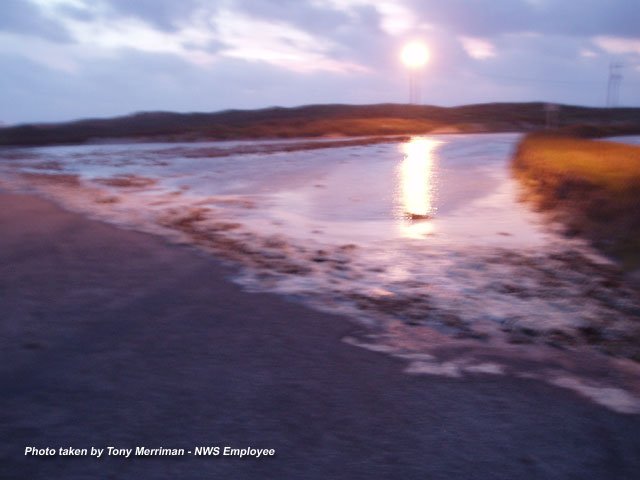
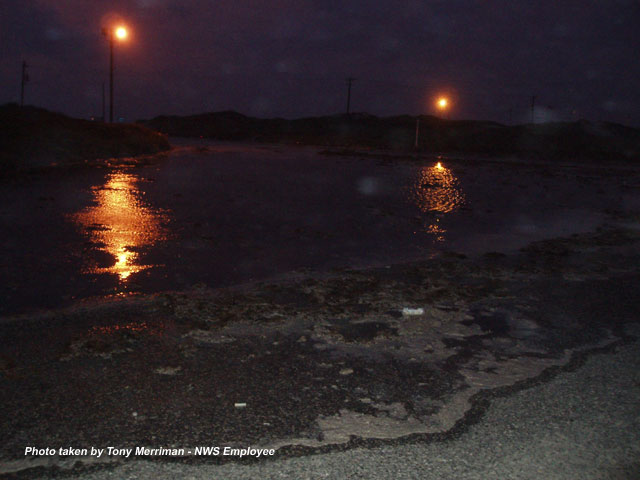
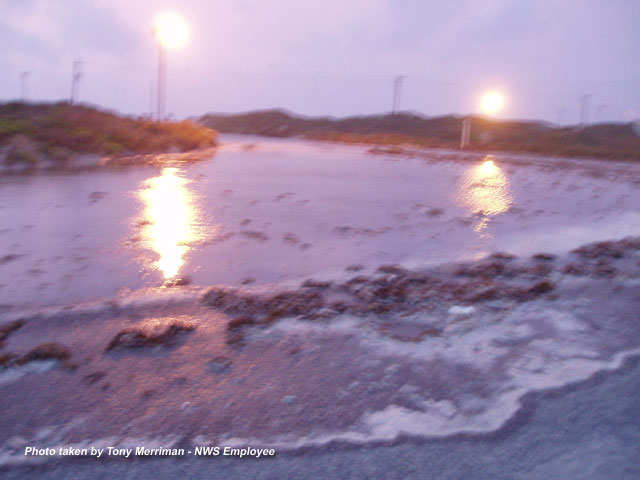
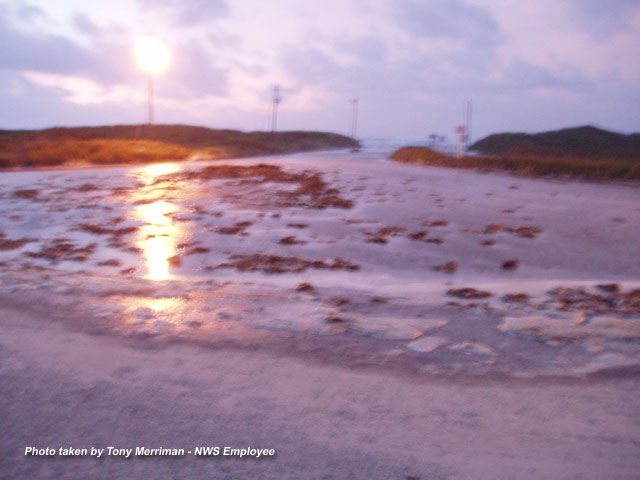
 Emily made landfall during peak high tide. Water levels rose to 2.0 to 2.5 feet above normal resulting in storm tides of 3.5 feet mean sea level along the barrier island from Bob Hall Pier southward. These higher than normal tides caused flooding of area beaches and beach access roads up to several feet deep. The Padre Island National Sea Shore closed down the beach several days before Emily made landfall. Beaches farther north eventually closed as well as the strong surf flooded beach access roads. Some vehicles were stranded in water several feet deep.
 |
|
|
|
| Bob Hall Pier | Ingleside | Port Aranasas | Rockport |
|
Site |
Peak Wind Time (LST) |
Peak 2 min. Wind Time (LST) |
Lowest Press Time (LST) |
24 hr Rainfall |
|
ASOS/AWSS |
|
|
|
|
|
07/19/05 |
E 39 mph, 1657 |
E 31 mph, 1658 |
29.87 in, 2100 |
0.44 inches |
|
07/20/05 |
E 46 mph, 1310 |
E 39 mph, 1310 |
29.85 in., 0426 |
0.35 inches |
|
07/19/05 |
E 41 mph, 1335 |
E 36 mph 1335 |
29.86 in., 2057 |
0.04 inches |
|
07/20/05 |
E 35 mph, 1613 |
E 29 mph, 1614 |
29.84 in., 0318 |
0.14 inches |
|
Cotulla 07/19/05 |
ESE 32 mph, 1728 |
ESE 28 mph, 1737 |
29.87 in., 1609 |
0.00 inches |
|
07/20/05 |
E 25 mph, 1539 |
E 20 mph, 1540 |
29.90 in., 0419 |
0.15 inches |
|
07/19/05 |
SE 36 mph, 1626 |
SE 26, 1627 |
29.92 in., 2117 |
0.01 inches |
|
07/20/05 |
NE 29 mph, 1753 |
NE 24, 1753 |
29.91 in., 0408 |
0.22 inches |
|
07/19/05 |
ESE 42 Kts, 1513 |
SE 3 7Kts, 1514 |
NA |
Trace |
|
07/20/05 |
Missing |
Missing |
NA |
|
|
NAS 07/19/05 |
E 38 mph, 1618 |
E 28, 1619 |
29.85 in., 2150 |
Missing |
|
07/20/05 |
ENE 32 mph, 1028 |
E 25 mph, 1532 |
29.83 in., 0539 |
Missing |
|
McMullen Target Site 07/19/05 |
ESE 33 mph, 1559 |
ESE 28 mph, 1559 |
30.30 in., 2359 |
Missing |
|
07/20/05 |
NE 26 mph, 1515 |
NE 21 mph, 1600 |
30.30 in., 1557 |
Missing |
|
Orange Grove NALF 07/19/05 |
E 32 mph, 1311 |
E 28 mph, 1312 |
29.84 in., 2056 |
0.62 inches |
|
07/20/05 |
NE 33 mph, 1114 |
NE 28 mph, 1114 |
29.82 in., 0309 |
0.24 inches |
|
TCOON Sites |
|
|
|
|
|
07/19/05 |
45 mph, 1412 |
NE 34 mph, 1436 |
29.79 in., 2036 |
NA |
|
07/20/05 |
40 mph, 0736 |
NE 33 mph, 0736 |
29.76 in., 0300 |
NA |
|
Bob Hall Pier 07/19/05 |
37 mph, 2200 |
NE 32 mph, 1900 |
29.83 in., 2100 |
NA |
|
07/20/05 |
34 mph, 0200 |
ENE 31 mph, 0200 |
29.82 in., 0300 |
NA |
|
Ingleside 07/19/05 |
30 mph, 2100 |
ENE 23 mph, 2100 |
NA |
NA |
|
07/20/05 |
29 mph, 1500 |
ENE 23 mph, 1300 |
NA |
NA |
|
Site |
Peak Wind Date/Time |
Fastest 2 min. Wind Date/time |
Lowest Press Date/time |
24 hr Rainfall Date |
|
TCOON Sites |
|
|
|
|
|
Port Aransas 07/19/05 |
30 mph, 1900 |
ENE 25 mph, 1900 |
NA |
NA |
|
07/20/05 |
28 mph, 0700 |
ESE 20 mph, 2300 previous day |
NA |
NA |
|
S. 07/19/05 |
39 mph, 1442 |
ENE 31 mph, 1430 |
NA |
NA |
|
07/20/05 |
34 mph, 0742 |
ENE 28 mph, 0612 |
NA |
NA |
|
Sea Drift 07/19/05 |
26 mph, 1200 |
NE 16 mph, 1300 |
NA |
NA |
|
07/20/05 |
26 mph, 1300 |
ENE 17 mph, 0900 |
NA |
NA |
|
White Point 07/19/05 |
33 mph, 1336 |
E 23 mph, 1336 |
NA |
NA |
|
07/20/05 |
26 mph, 1350 |
E 18 mph, 1350 |
NA |
NA |
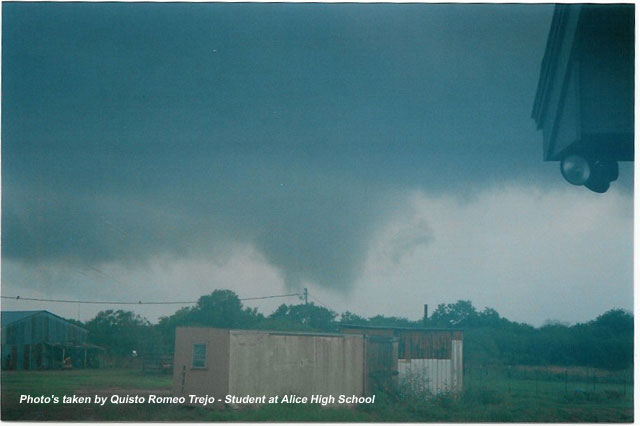
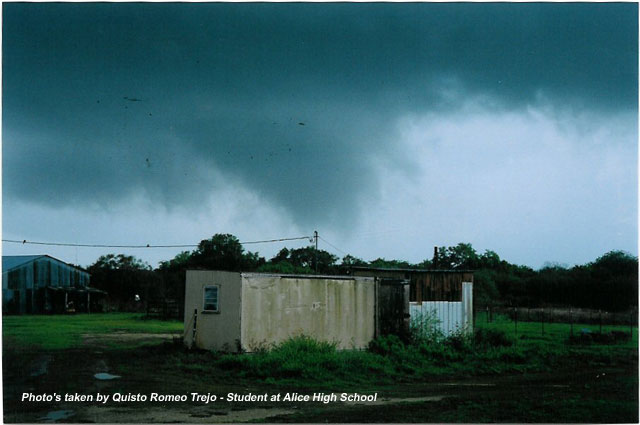
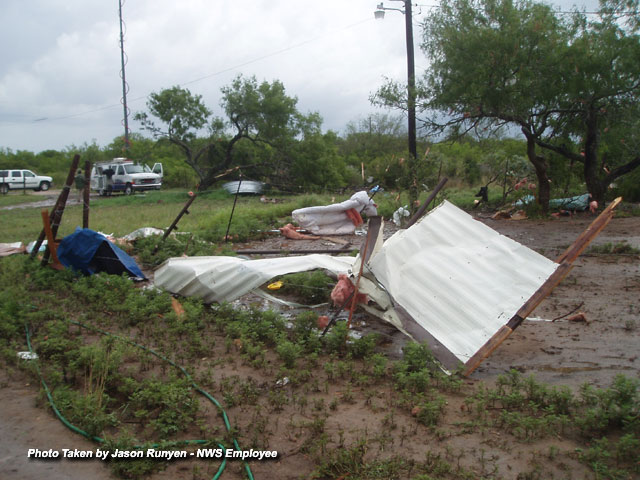
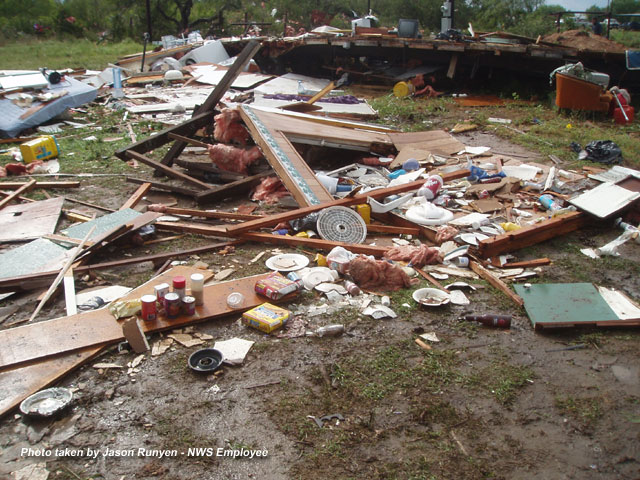
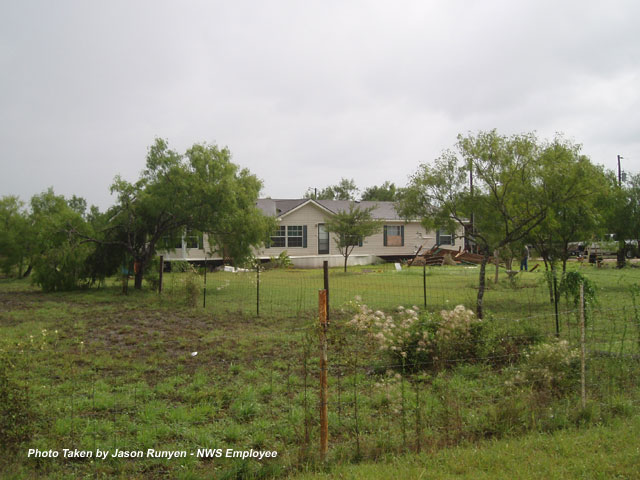
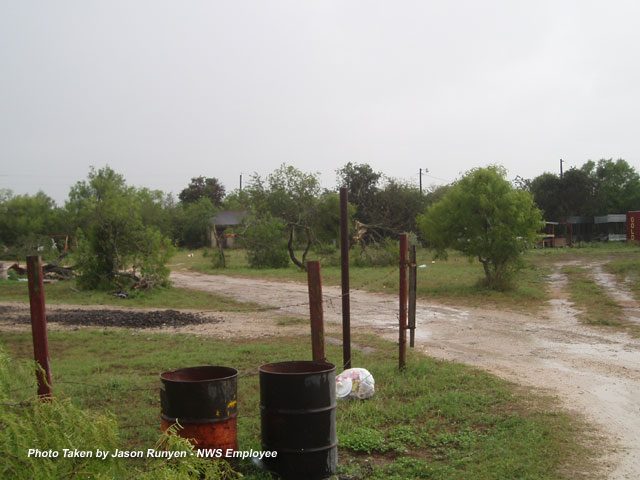
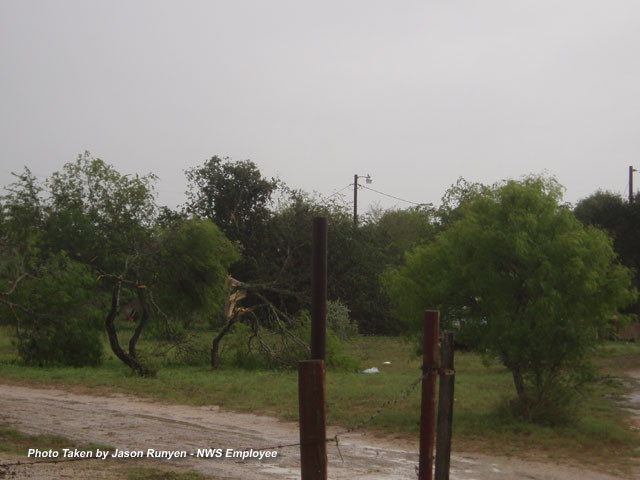
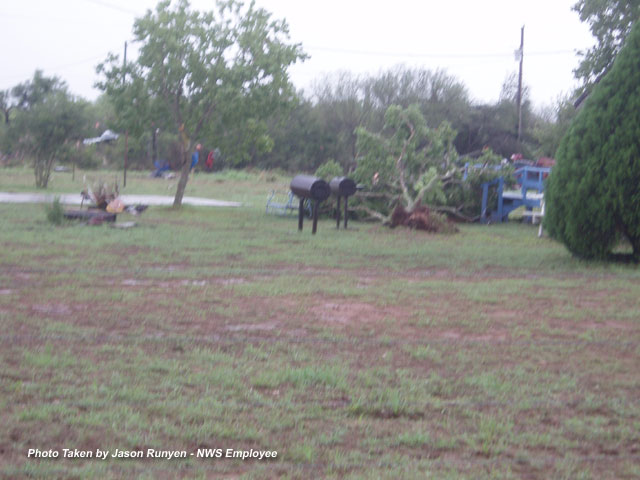
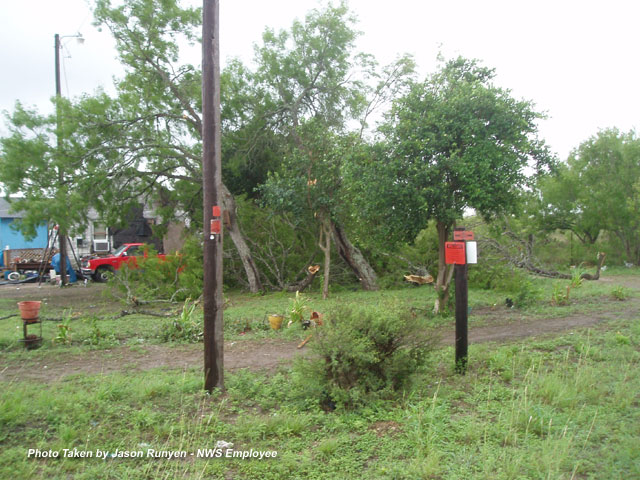
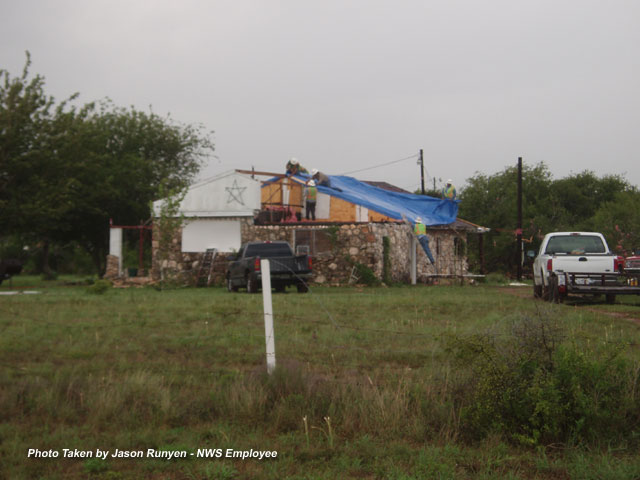
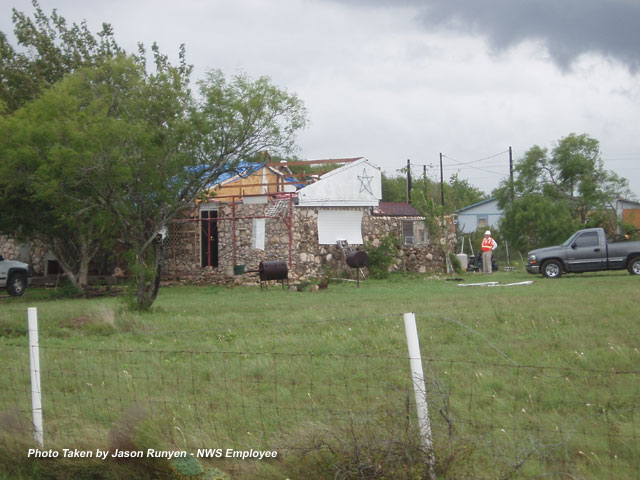
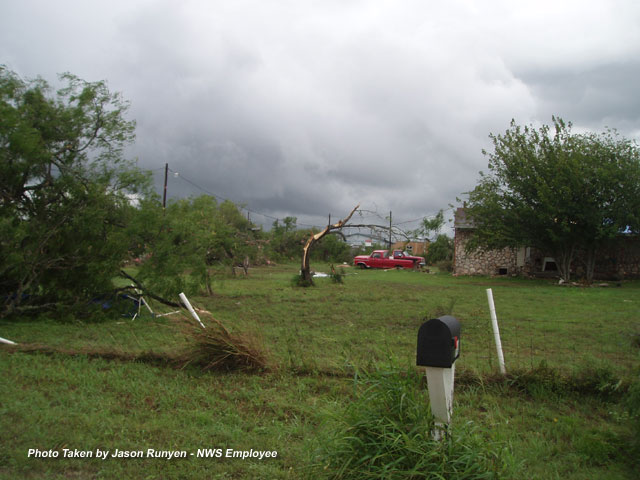
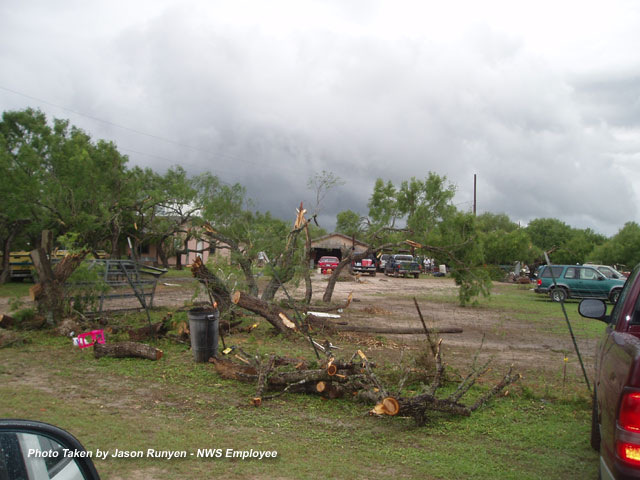
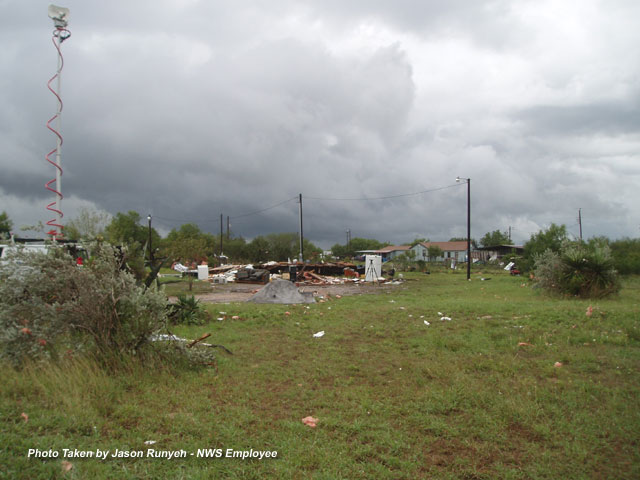
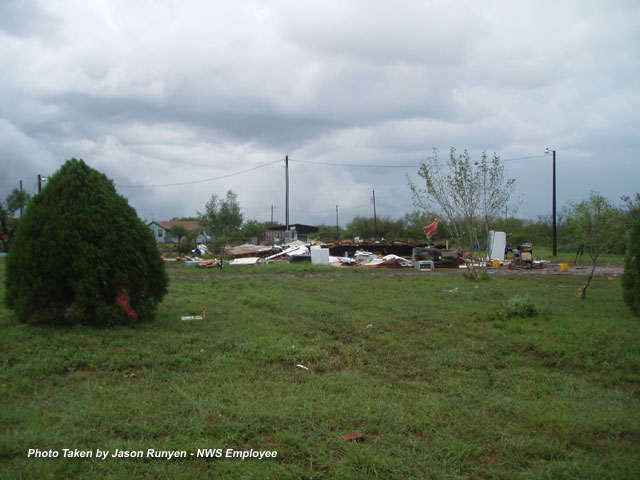
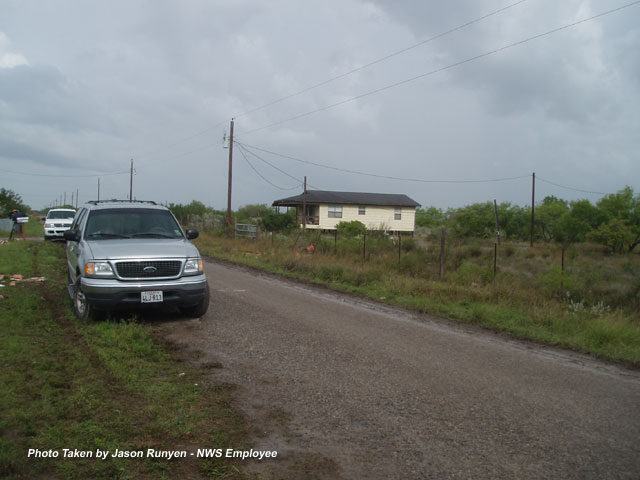
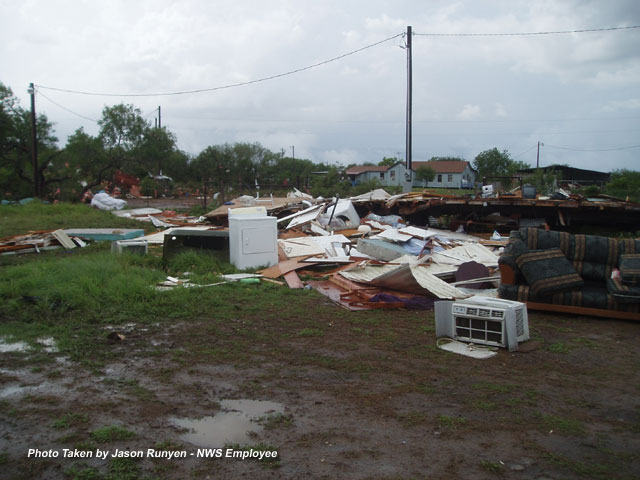
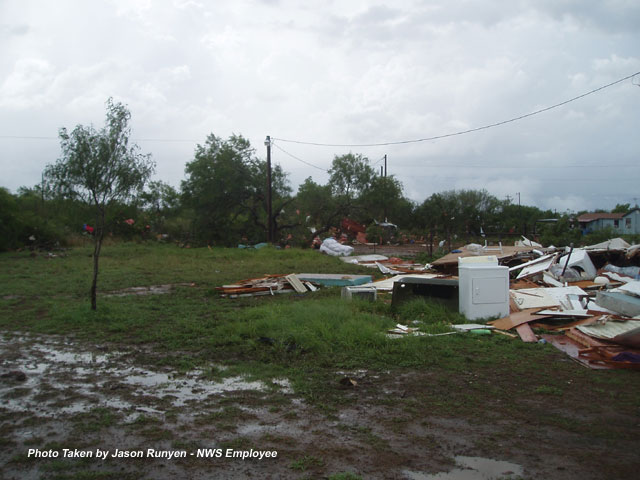
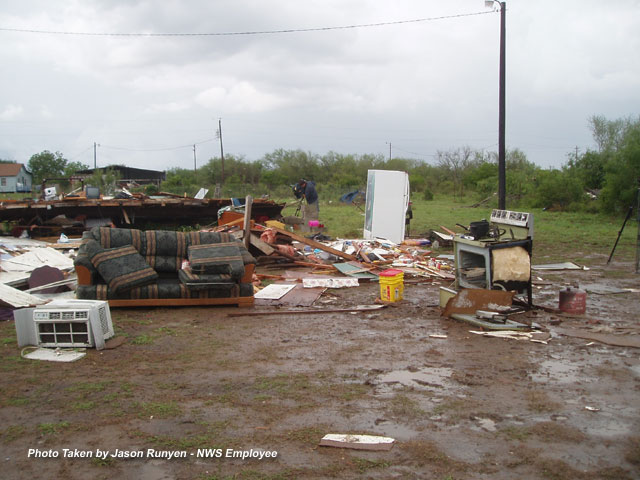
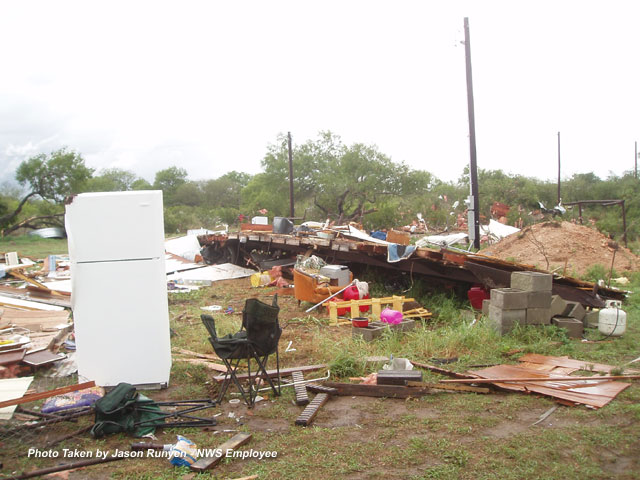
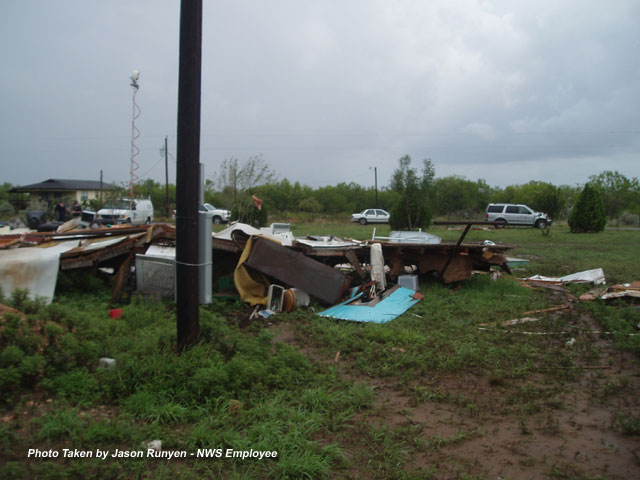
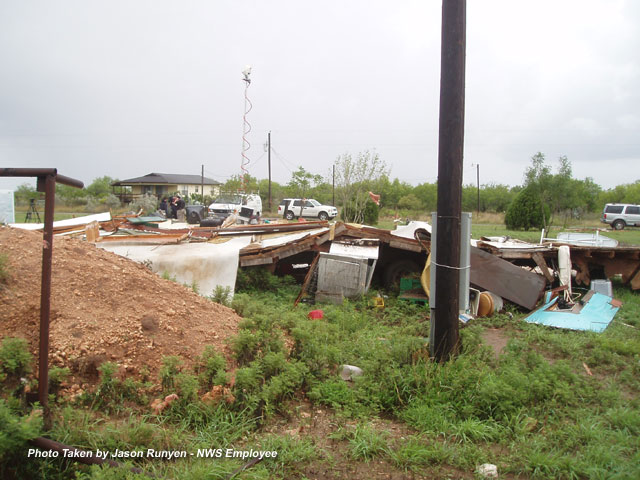
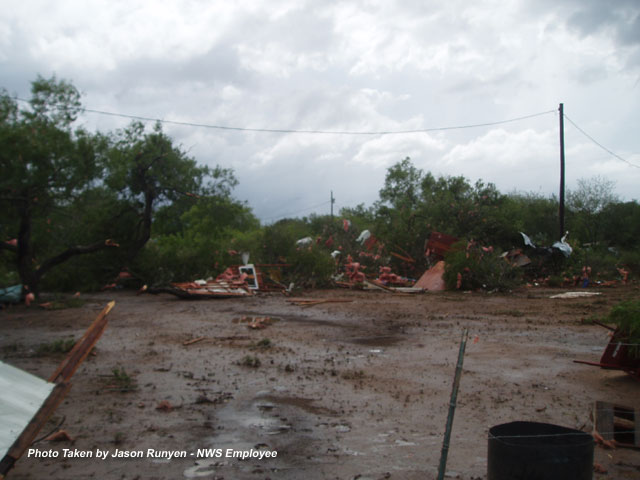
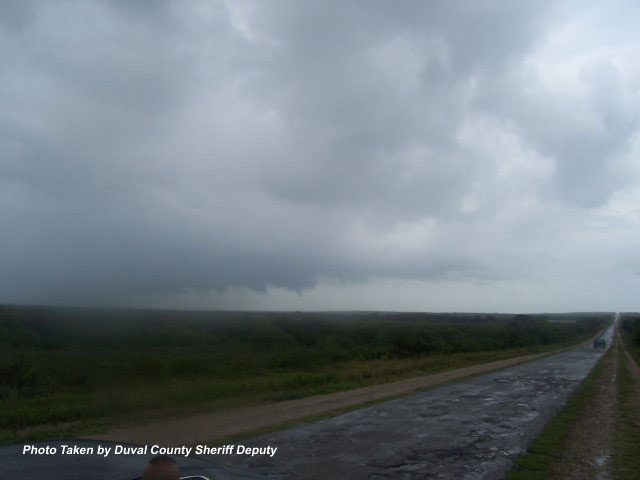
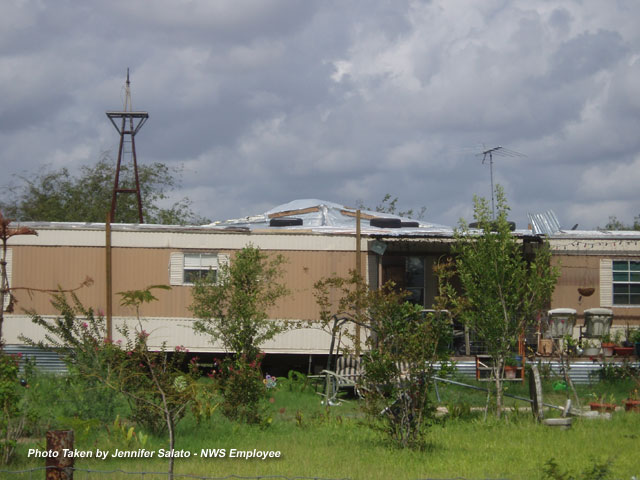
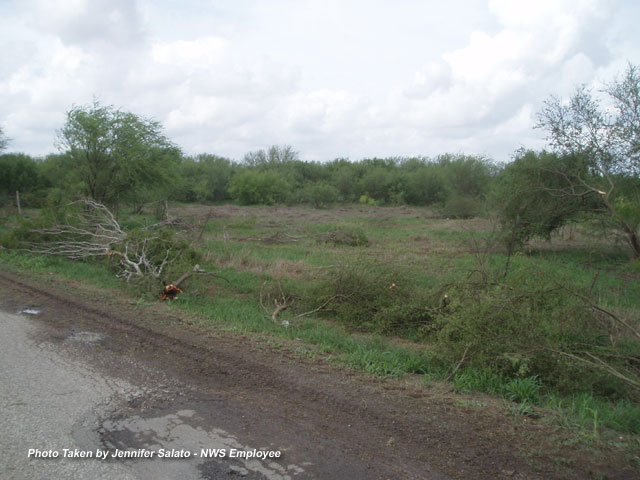
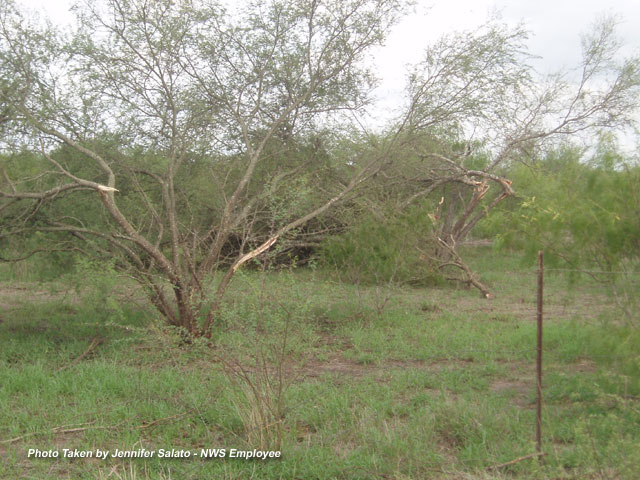
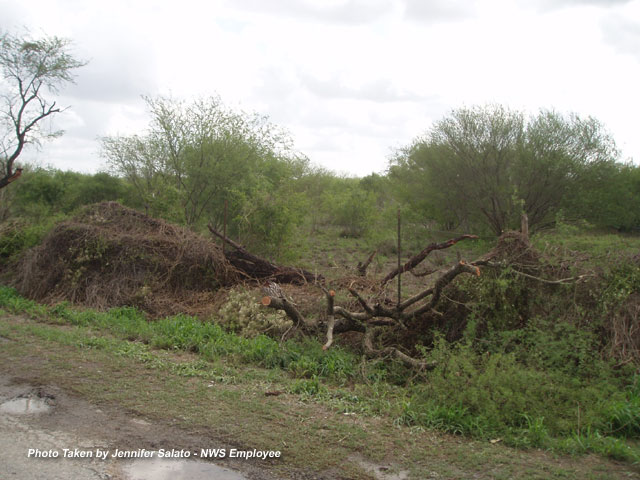
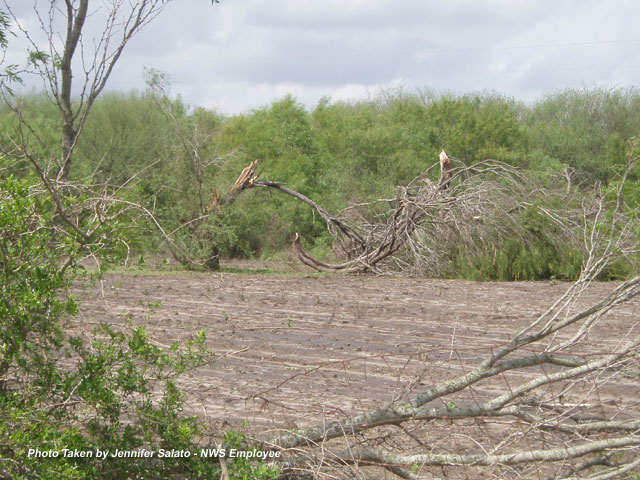
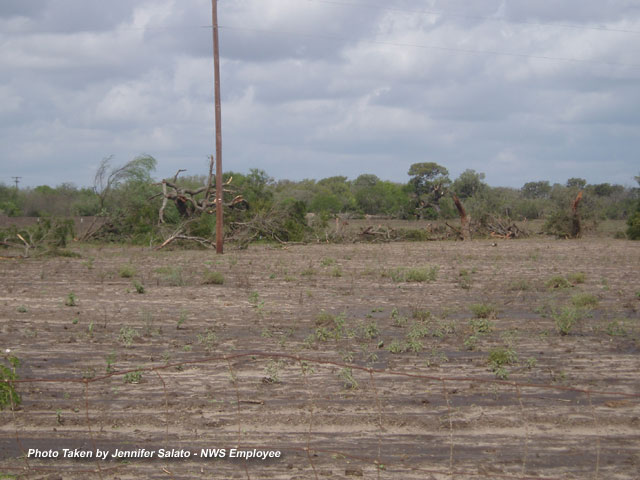
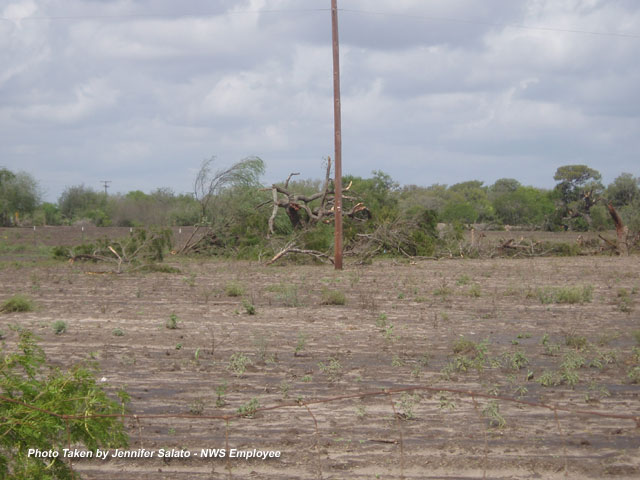
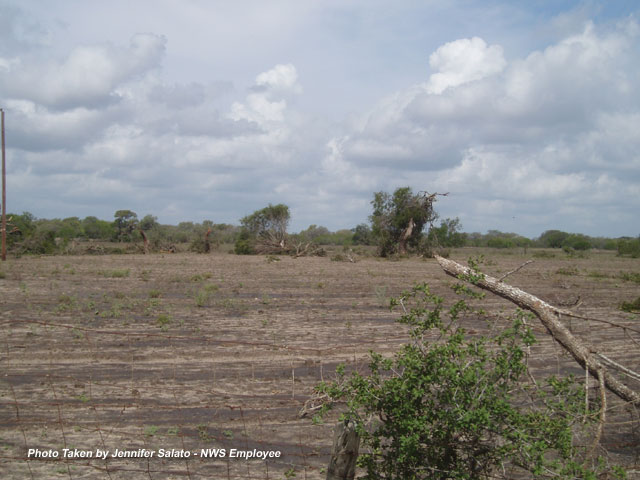
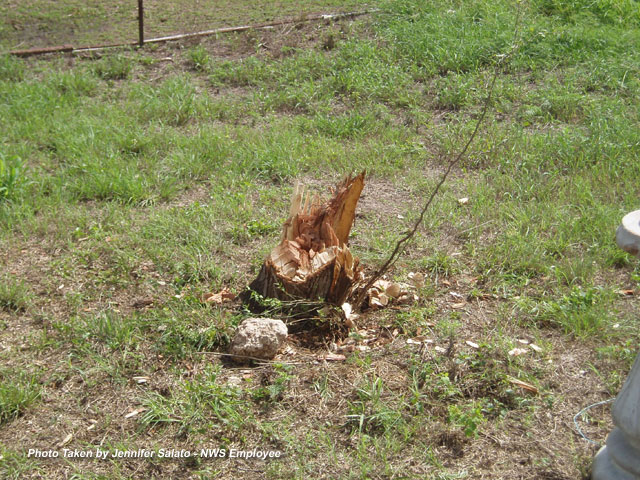
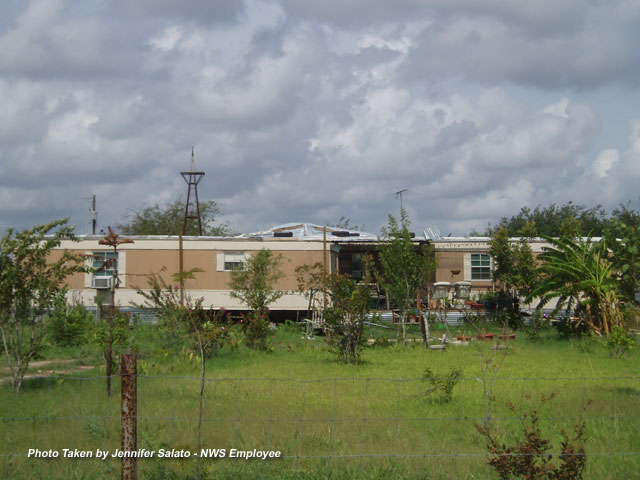
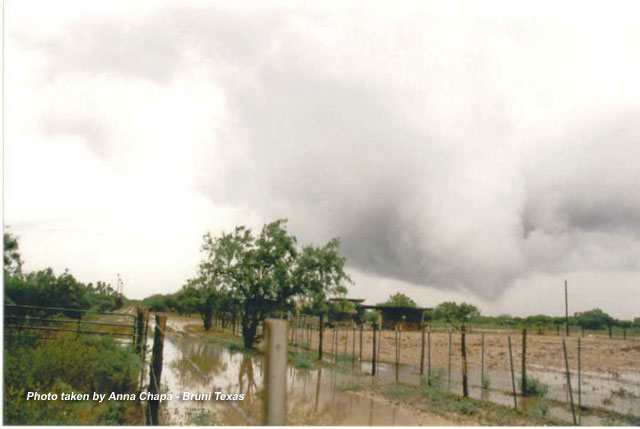
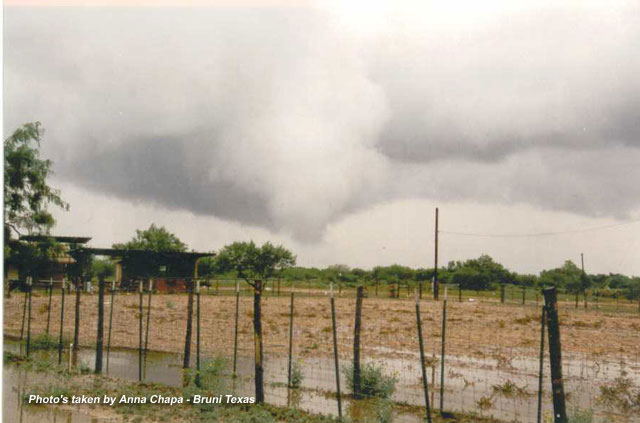
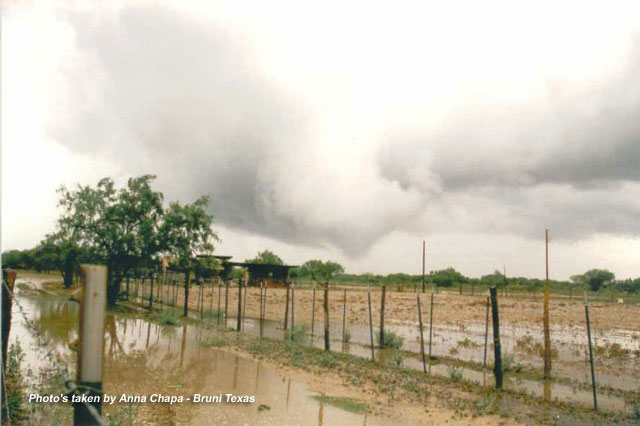
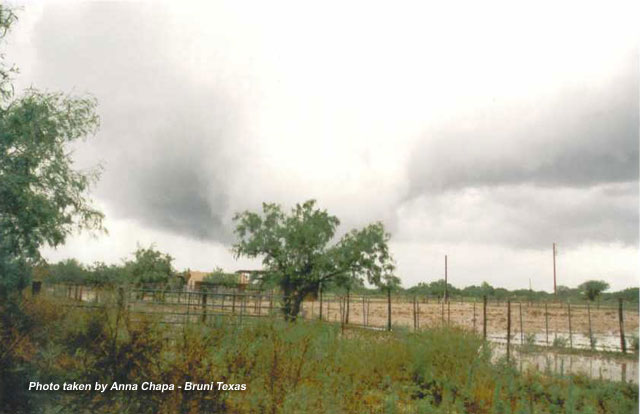
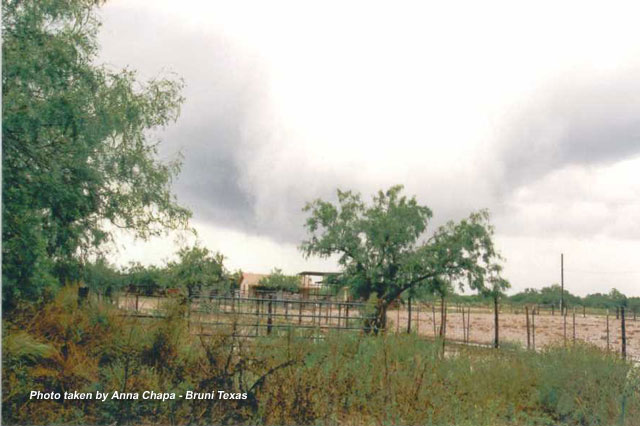
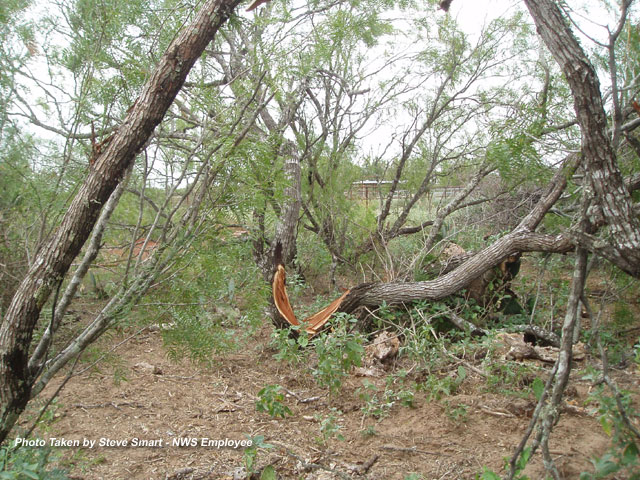
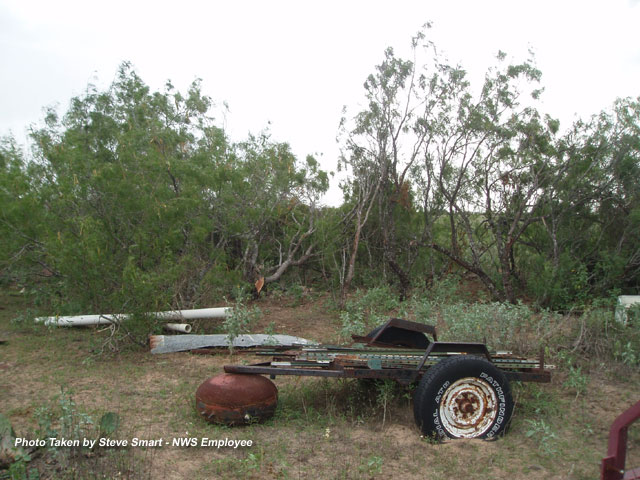
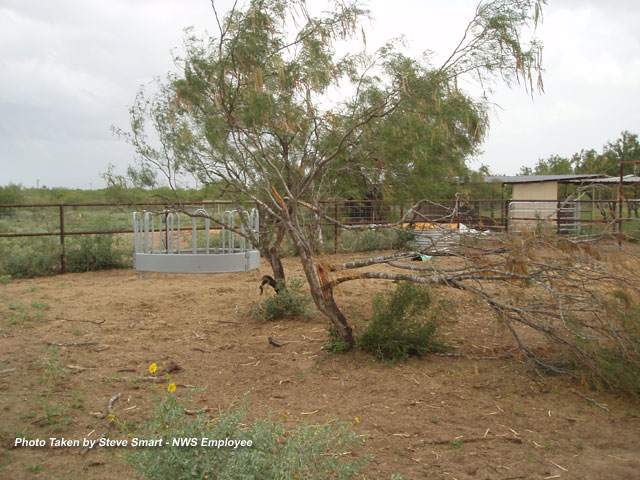
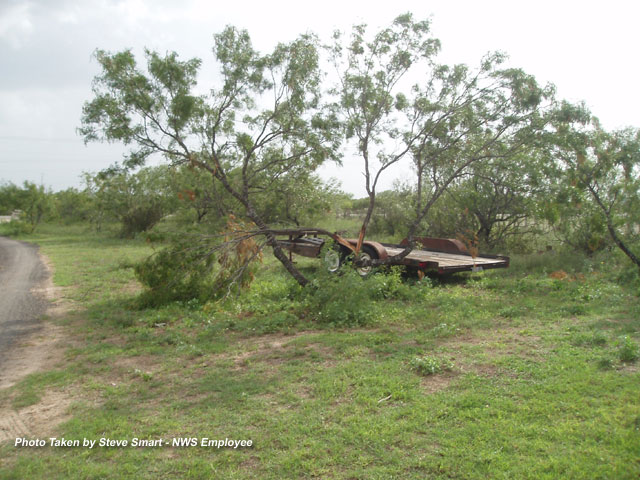
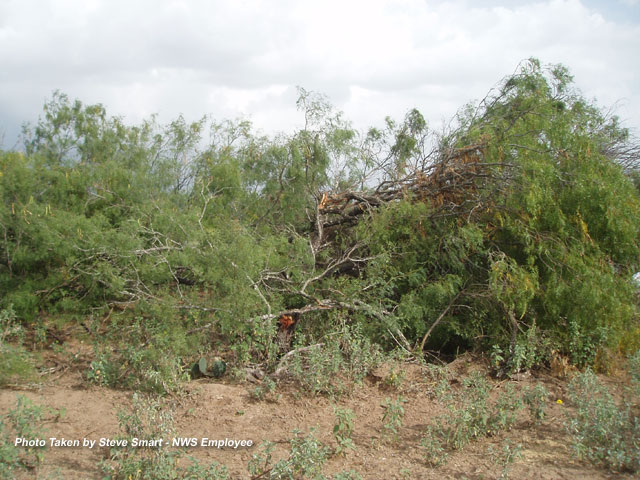
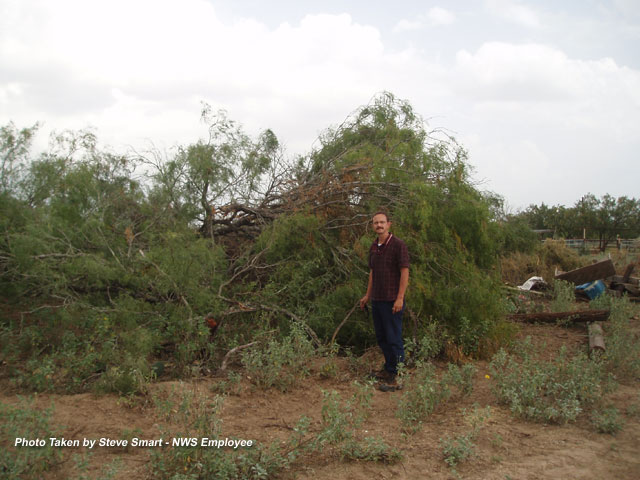
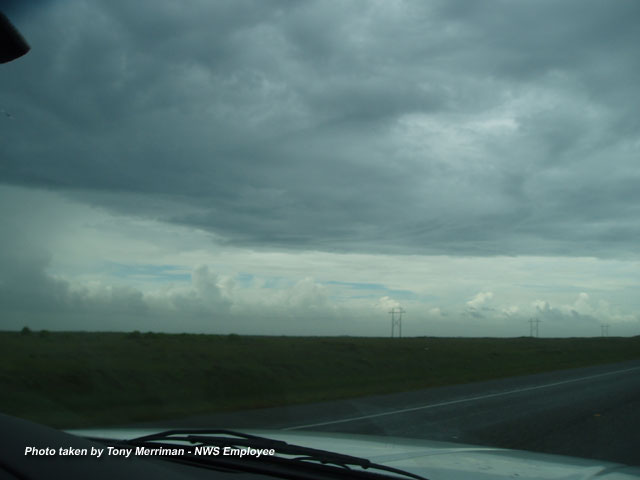
On the day of landfall, showers and thunderstorms, in the outer rainbands, became more intense and fanned a region from deep south Texas northward to the mid coast region. Strong low level wind shear combined with an increasingly unstable airmass resulted in an outbreak of tornadoes across the western Coastal Bend and Rio Grande Plains. Five tornadoes were confirmed to have touch down with several other unconfirmed tornadoes reported throughout the day. The strongest tornado, rated F1 (winds 73 to 112 mph) on the Fujita Scale, demolished a mobile home and tore the roof off a residence in north central Jim Wells County near the community of Tecolote. Trees were stripped of their limbs or uprooted along a 12 mile path from this tornado as it crossed into northern Duval County. Another tornado touched down in southern Jim Wells County near the town of Premont. This tornado ripped the roof off one home and damaged trees and electrical poles along a seven mile path into southern Duval County. The storm that produced this tornado eventually produced another tornado near the town of Bruni in southern Webb County about an hour later. In all, five tornadoes were confirmed. Fortunately, there were no injuries or fatalities.
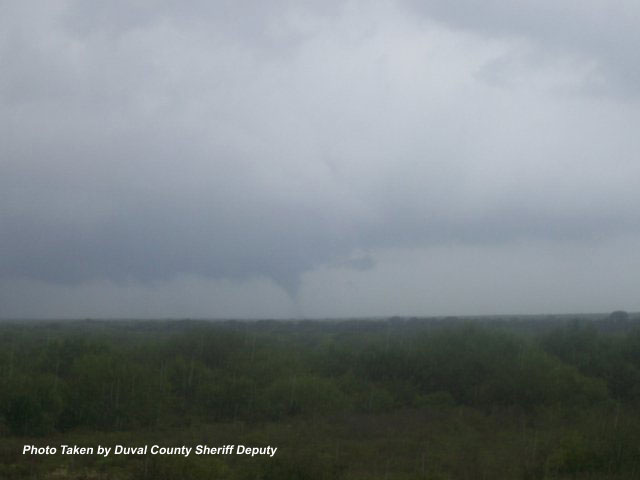
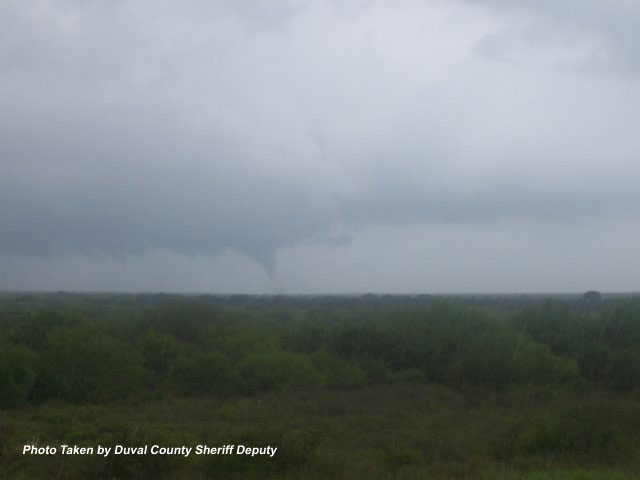
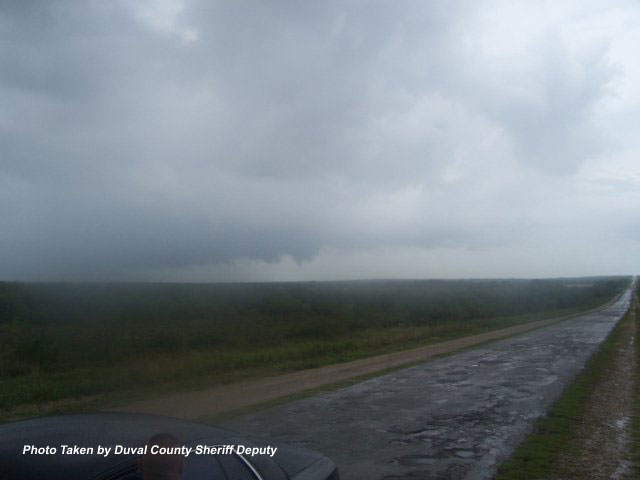
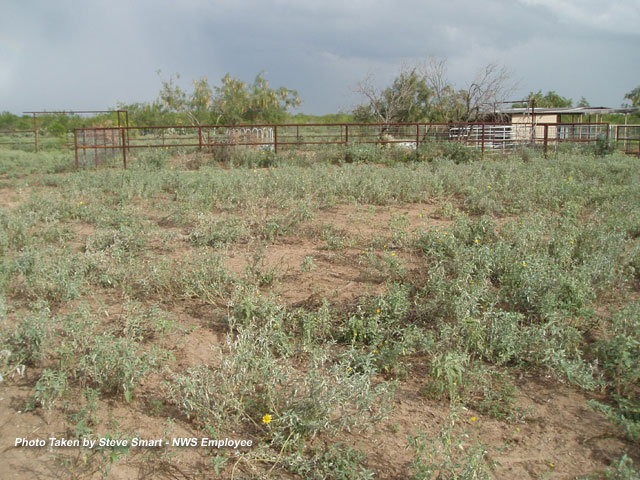
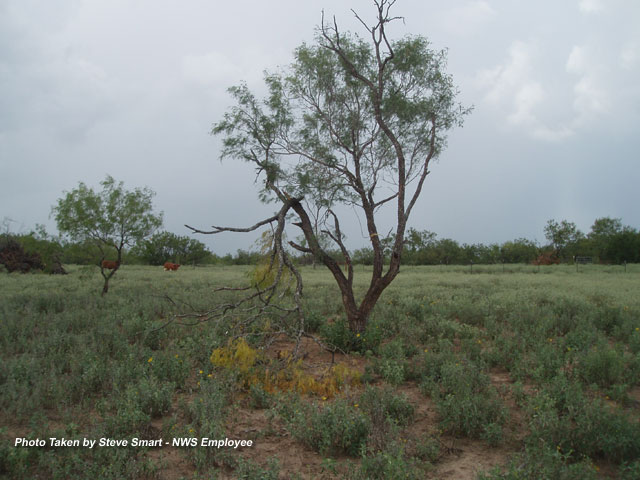
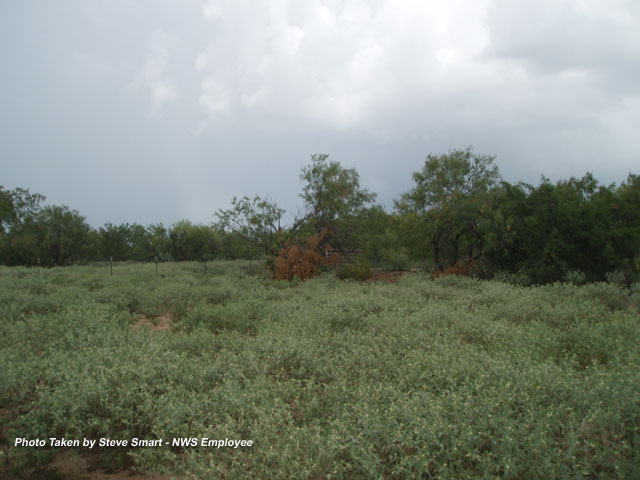
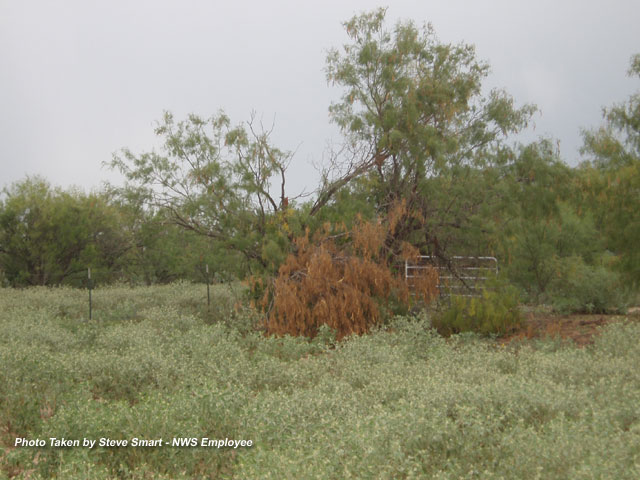
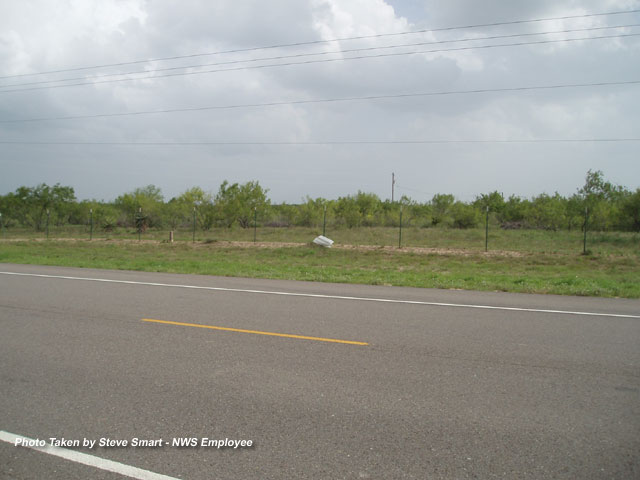
The Anna Rose Tornado was observed by several law enforcement officers. This tornado touched down in open brush country about 4 miles south of Anna Rosa. A NWS storm survey team found no visible damages from this tornado.
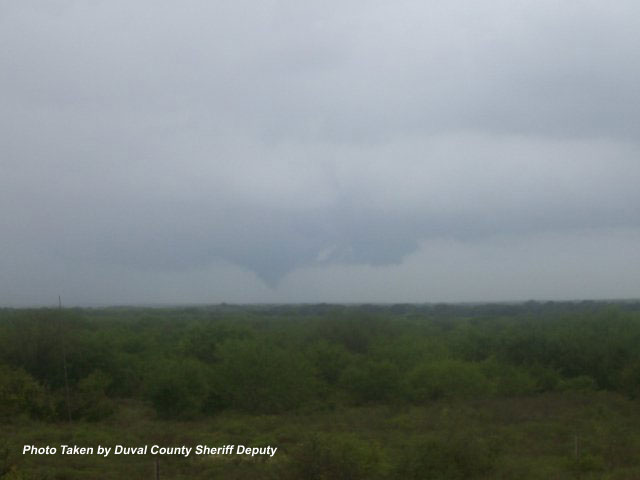
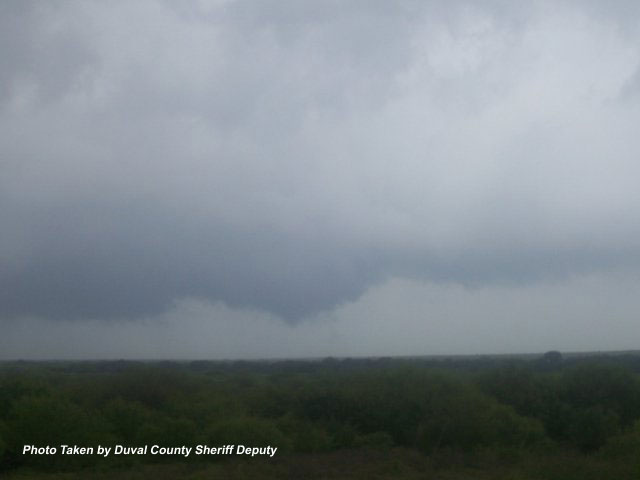
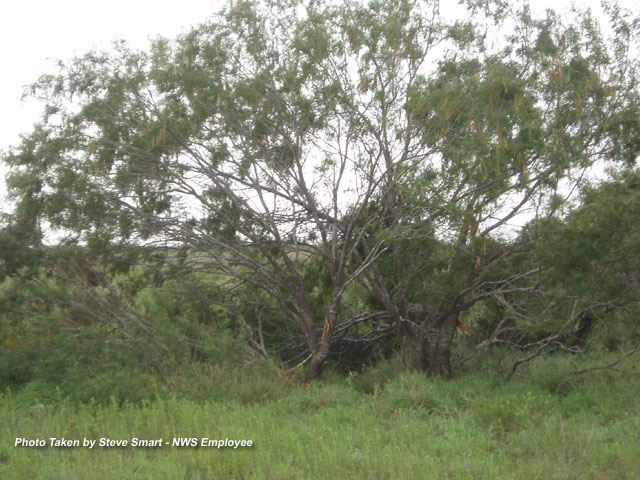
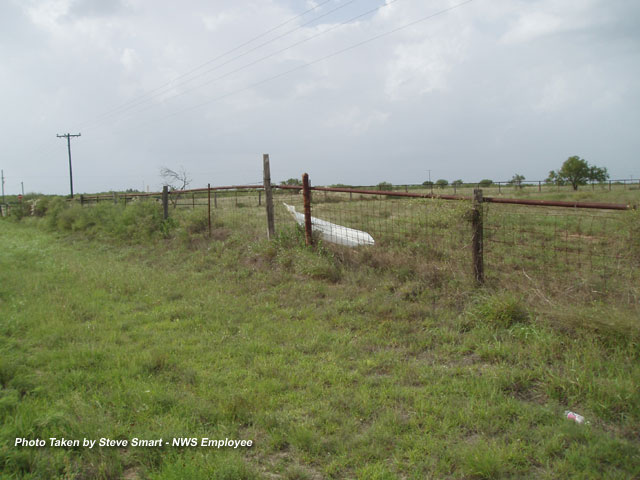
The Tynan Tornado was photographed by a citizen in Tynan. This tornado touched down in open country a couple miles south of Tynan. A NWS storm survey team found no visible damages from this tornado.


Tornadoes are common in Hurricanes and are generated in two areas: The eye wall region, and in the northeast quadrant of the hurricane, about 150 to 250 miles northeast of the center. The National Weather Service in Corpus Christi issued 34 tornado warnings on this day. Many of the residents in the path of the tornadoes sought shelter after hearing about these warnings on television. The NWS would like to thank the broadcast media for their help in getting this critical warning information out to the public.
 |
 |
| Reflectivity Loop of Tecolote Supercelll | Storm Relative Velocity Loop of Tecolote Supercell |
 |
 |
| Reflectivity Loop of Premont Supercelll | Storm Relative Velocity Loop of Premont Supercell |
 |
 |
 |
 |
 |
 |
 |
 |
 |
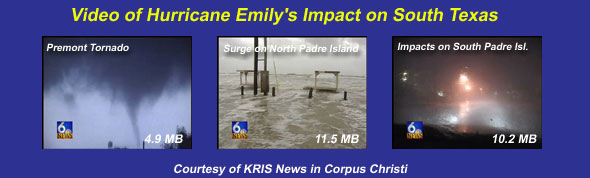
Click on images to download videos. Caution, video files are large.

