Overview
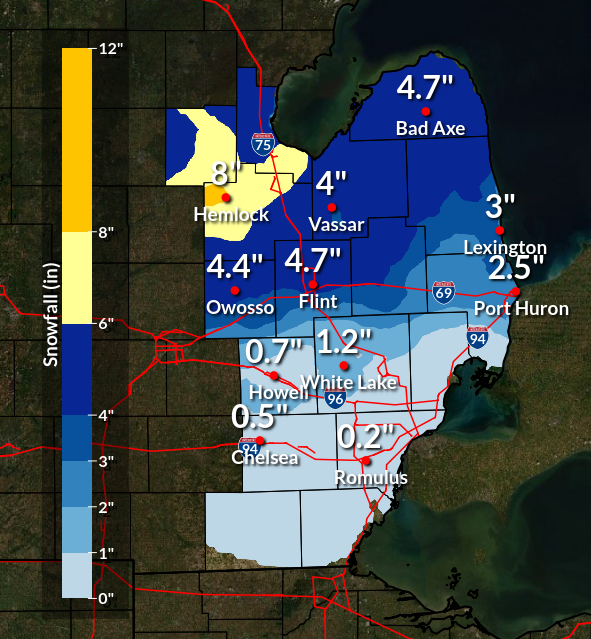
A low pressure system developed along a frontal boundary draped across the Midwest and moved northeastward through southeast Michigan on the morning of January 29th. As this system approached during the afternoon and evening of January 28th, a lead wing of isentropic ascent and warm air advection brought the onset of accumulating snowfall across central and northern portions of southeast Michigan. Throughout the night intensity of snowfall increased for areas north of I-69. A corridor of stronger frontal forcing along with thermal profiles conducive for periods of heavy snow developed moved into the Tri-Cities during the early morning hours bringing snowfall rates up to an inch per hour for several hours and reaching a storm total snowfall of 7-8 inches in parts of the Tri-Cities.
A sharp gradient in snowfall totals developed with a significant drop off for areas south of I-69 as dry air cut into the totals along and south of the rain/snow line. There were points mainly along and south of the I-94 corridor that experienced a period of light wintry mix and light freezing rain during the morning hours of January 29th as surface air temperatures held at or below freezing. Snowfall totals for areas south of I-69 were around an inch or less before precipitation ended during the mid-morning hours.
Snow Totals
STORM TOTAL SNOW REPORTS

LOCATION                  SNOWFALL     DURATION
                          (INCHES)      (HOURS)        LAT       LON

...MIDLAND COUNTY...
   2 E MIDLAND             M   7.0           16     43.62N    84.19W

...SAGINAW COUNTY...
   2 SW SAGINAW            M   6.0           16     43.40N    83.98W
   8 NW SAGINAW            M   6.2           24     43.50N    84.06W
   5 E HEMLOCK             M   8.0           16     43.42N    84.13W

...SANILAC COUNTY...
   2 W PECK                M   6.5           16     43.26N    82.86W

...BAY COUNTY...
   AUBURN                  M   4.5           24     43.60N    84.08W
   BAY CITY                M   4.5           14     43.59N    83.89W
   2 E BAY CITY            M   7.0           24     43.59N    83.85W

...GENESEE COUNTY...
   LINDEN                  M   1.0           24     42.82N    83.78W
   GOODRICH                M   2.3           24     42.92N    83.51W
   4 N BURTON              M   4.1           24     43.05N    83.62W
   5 SW FLINT              M   4.7           15     42.97N    83.76W

...HURON COUNTY...
   PORT AUSTIN             M   4.0           24     44.04N    83.00W
   BAY PORT                M   4.1           12     43.85N    83.37W
   5 NNW FILION            M   4.4           24     43.96N    83.04W
   BAD AXE                 M   4.7           24     43.80N    83.00W

...LAPEER COUNTY...
   5 W LAPEER              M   4.2           15     43.05N    83.42W

...MIDLAND COUNTY...
   4 W MIDLAND             M   5.2           13     43.62N    84.31W

...OAKLAND COUNTY...
   1 ESE DAVISBURG         M   1.0           24     42.75N    83.52W
   4 E WHITE LAKE          M   1.2           18     42.65N    83.43W
   2 S ORTONVILLE          M   1.4           24     42.82N    83.44W

...SAGINAW COUNTY...
   CHESANING               M   4.5           24     43.18N    84.12W
   5 WSW CHESANING         M   5.0           24     43.17N    84.21W
   SAGINAW                 M   5.5           24     43.42N    83.95W

...SANILAC COUNTY...
   LEXINGTON               M   3.0           24     43.27N    82.53W

...SHIAWASSEE COUNTY...
   DURAND                  M   3.0           24     42.91N    83.99W
   6 WNW DURAND            M   3.6           24     42.95N    84.10W
   OWOSSO                  M   4.4           24     43.00N    84.18W

...TUSCOLA COUNTY...
   CASS CITY               M   4.0           24     43.60N    83.18W
   VASSAR                  M   4.0           24     43.37N    83.58W


M = MEASURED
E = ESTIMATED

$$
Radar
|
|
| Radar: NEXRAD mosaic base reflectivity radar loop from 11 AM Jan 28, 2023 through 9 AM Jan 29, 2023. |
Environment
|
|
|
| Figure 1: Jan 28, 2023 7 PM DTX RAOB Sounding (top) and Jan 29, 2023 7 AM DTX RAOB Sounding (bottom). | Figure 2: Jan 28, 2023 7 PM WPC surface analysis map (top) and Jan 29, 2023 7 AM WPC surface analysis map (bottom). |
 |
Figure 3: Jan 29, 2023 4 AM 300 mb level height (black contours - m MSL), wind speed (fill - knots), and convergence (pink contours - 10^-5/s). |
 |
|
| Figure 4: Jan 29, 2023 12 AM Dendritic Growth Zone (-12C to -17Z) depth (contour - m) & RH (fill - %). | Figure 5: Jan 29, 2023 4 AM low-level (925-850 mb) 2D FGEN (purple contours - K/100 km/3 hr) mean layer height (black contours- m), and mean layer temperature (dashed contours - C). |
 |
Media use of NWS Web News Stories is encouraged! Please acknowledge the NWS as the source of any news information accessed from this site. |
|