Overview
The remnants of a moisture-laden low pressure system that caused historic flooding in Louisiana tracked into the Great Lakes region late on August 15 into the 16th, bringing heavy rainfall to much of Southeast Michigan during the overnight and early morning hours of the 16th. Rainfall amounts of 1 to 3 inches were common, with isolated totals in excess of 3.5 inches. Flooding closed several major roads in the Metro Detroit and Tri-Cities areas, and the Clinton River briefly reached minor flood stage.Radar:
.gif) |
| Radar Loop 8 pm August 15 to 10 am August 16 |
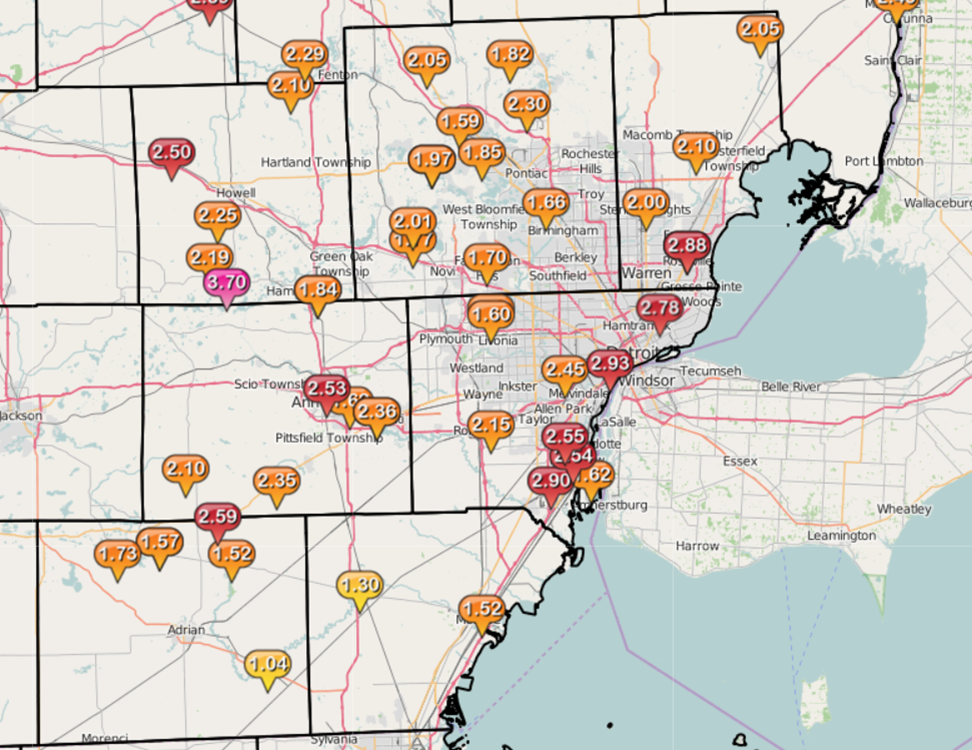
Rain Reports
 |
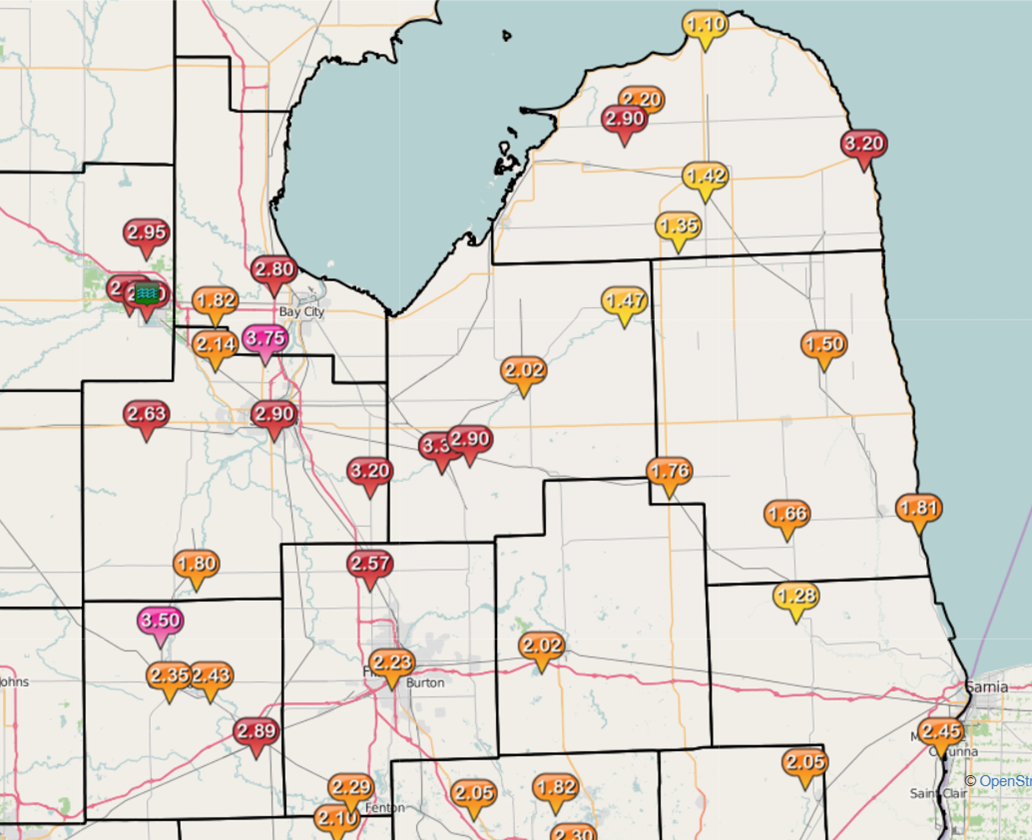 |
| Rainfall Reports - Metro Detroit | Rainfall Reports - Flint/Tri-Cities/Thumb |
Public Information Statement...Storm Totals
National Weather Service Detroit/Pontiac MI
535 PM EDT Tue Aug 16 2016


STORM TOTAL HEAVY RAIN REPORTS

Location                   Precip      Duration
                          (Inches)      (Hours)        Lat       Lon

...Bay County...
   Auburn                  M  1.82           24     43.60N    84.08W
   Kawkawlin               M  2.80           12     43.65N    83.95W
   5 SW Bay City           M  3.75            9     43.54N    83.97W

...Genesee County...
   Flint                   M  2.23           24     43.02N    83.69W
   Linden                  M  2.29           24     42.82N    83.78W
   Sw Clio                 M  2.57           24     43.18N    83.74W

...Huron County...
   Port Austin             M  1.10           24     44.04N    83.00W
   2 ENE Ivanhoe           M  1.35           24     43.72N    83.06W
   Bad Axe                 M  1.42           24     43.80N    83.00W
   2 WSW Pinnebog          M  2.20            8     43.92N    83.14W
   5 N Elkton              M  2.90           10     43.89N    83.18W
   Harbor Beach            M  3.20            9     43.85N    82.65W

...Lapeer County...
   2 W Lapeer              M  2.02          8.5     43.05N    83.36W

...Lenawee County...
   Blissfield              M  1.04            9     41.83N    83.86W
   Tecumseh                M  1.52            9     42.01N    83.94W
   2 WNW Tipton            M  1.57            9     42.03N    84.10W
   Onsted                  M  1.73            8     42.01N    84.19W
   Clinton                 M  2.59           12     42.07N    83.97W

...Livingston County...
   1 N Whitmore Lake       M  1.84           24     42.44N    83.75W
   5 WSW Fenton            M  2.10           10     42.77N    83.81W
   3 NW Pinckney           M  2.19           10     42.49N    83.99W
   4 SSW Howell            M  2.25            6     42.56N    83.97W
   Fowlerville             M  2.50           24     42.66N    84.07W

...Macomb County...
   Roseville               M  1.93            5     42.51N    82.94W
   Nw Sterling Heights     M  2.00            6     42.58N    83.03W
   4 NNW Richmond          M  2.05           24     42.86N    82.78W
   Macomb Township         M  2.10            8     42.67N    82.92W
   S Roseville             M  2.30          6.5     42.51N    82.94W
   Roseville               M  2.88           10     42.51N    82.94W

...Midland County...
   2 W Midland             M  2.72           24     43.62N    84.27W
   1 S Midland             M  2.90            6     43.61N    84.23W
   6 N Midland             M  2.95           12     43.71N    84.23W

...Monroe County...
   Dundee                  M  1.30           24     41.96N    83.66W
   Monroe                  M  1.52         10.5     41.92N    83.39W

...Oakland County...
   2 SSW Clarkston         M  1.59            5     42.71N    83.44W
   Bloomfield Hills        M  1.66            6     42.58N    83.25W
   Farmington Hills        M  1.70           12     42.49N    83.38W
   Wixom                   M  1.77            6     42.52N    83.54W
   4 W Oxford              M  1.82           10     42.82N    83.33W
   Waterford               M  1.85            9     42.66N    83.39W
   White Lake              M  1.97           18     42.65N    83.50W
   2 N Wixom               M  2.01            9     42.55N    83.54W
   4 NNE Davisburg         M  2.05           24     42.81N    83.51W
   4 SW Lake Orion         M  2.30            8     42.74N    83.29W

...Saginaw County...
   Chesaning               M  1.80           24     43.18N    84.12W
   5 S Auburn              M  2.14           24     43.53N    84.08W
   Hemlock                 M  2.63          9.5     43.42N    84.23W
   E Saginaw               M  2.90            6     43.42N    83.95W
   N Frankenmuth           M  3.20            7     43.33N    83.74W

...Sanilac County...
   Deckerville             M  1.50            6     43.53N    82.74W
   W Peck                  M  1.66           10     43.26N    82.82W
   Marlette                M  1.76           10     43.33N    83.08W
   Lexington               M  1.81            6     43.27N    82.53W

...Shiawassee County...
   Owosso                  M  2.35           24     43.00N    84.18W
   2 NE Corunna            M  2.43           24     43.00N    84.09W
   Durand                  M  2.89           24     42.91N    83.99W
   Henderson               M  3.50           10     43.09N    84.20W

...St. Clair County...
   Yale                    M  1.28           24     43.13N    82.80W
   Marysville              M  2.45           24     42.91N    82.48W

...Tuscola County...
   Cass City               M  1.47           24     43.60N    83.18W
   Caro                    M  2.02           24     43.49N    83.40W
   Vassar                  M  2.52           24     43.37N    83.58W
   3 ENE Vassar            M  2.90           12     43.38N    83.52W
   Vassar                  M  3.30           11     43.37N    83.58W

...Washtenaw County...
   Manchester              M  2.10           24     42.15N    84.04W
   Se Ypsilanti            M  2.30           24     42.24N    83.62W
   4 SW Saline             M  2.35           24     42.13N    83.84W
   Ypsilanti               M  2.36            6     42.24N    83.62W
   Ann Arbor               M  2.53           24     42.28N    83.73W

...Wayne County...
   1 N Livonia             M  1.50            7     42.41N    83.37W
   Livonia                 M  1.60           12     42.40N    83.37W
   1 N Grosse Ile          M  1.62           24     42.14N    83.15W
   Romulus                 M  2.15           24     42.22N    83.37W
   Dearborn                M  2.45           24     42.31N    83.21W
   Riverview               M  2.54          7.5     42.17N    83.19W
   Southgate               M  2.55            7     42.20N    83.21W
   5 WNW Grosse Pointe     M  2.78           24     42.41N    83.00W
   Wnw Woodhaven           M  2.90           24     42.13N    83.24W
   4 S Detroit             E  2.93           24     42.32N    83.11W


M = Measured
E = Estimated
Environment
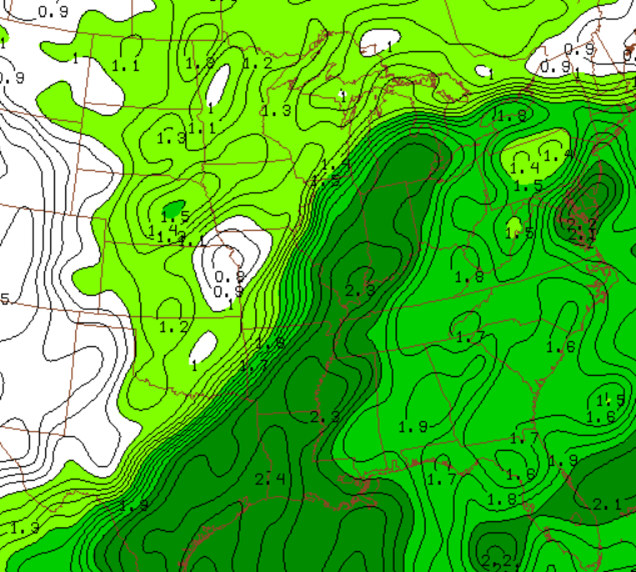
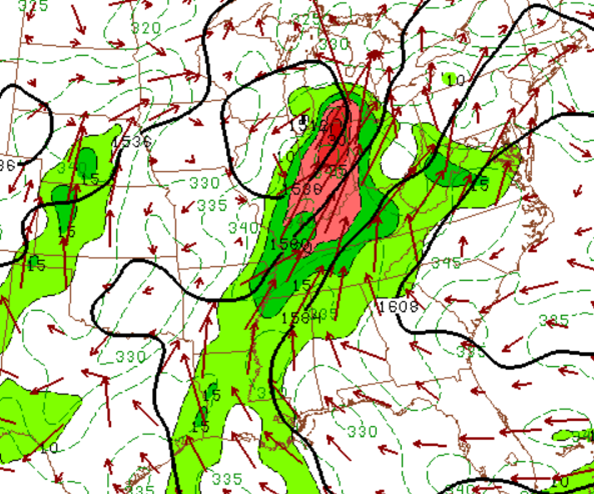
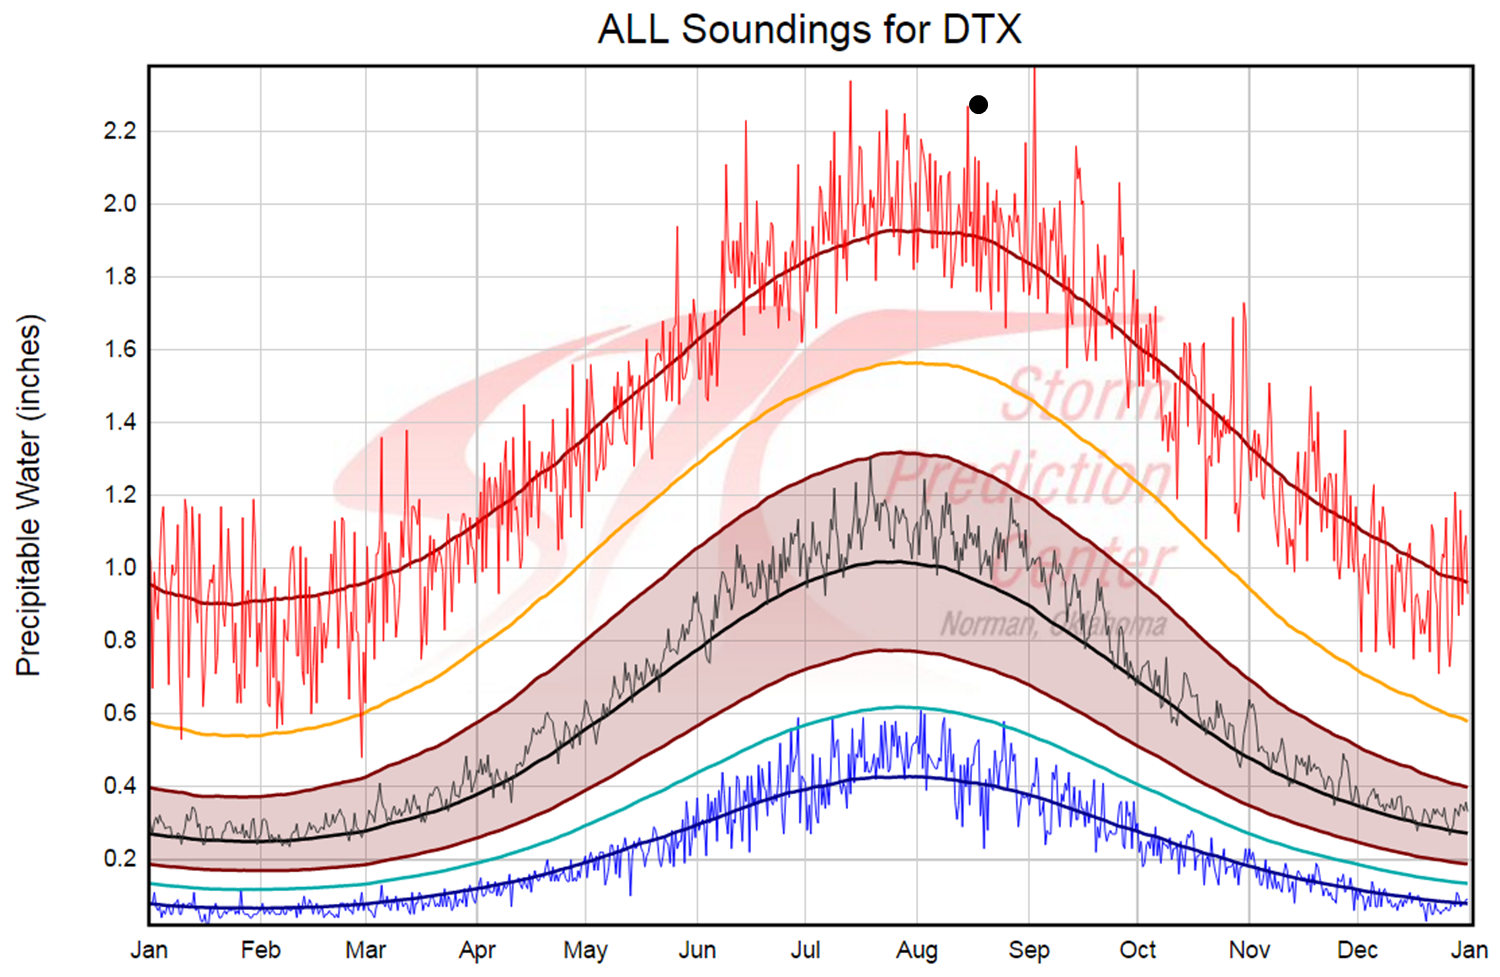
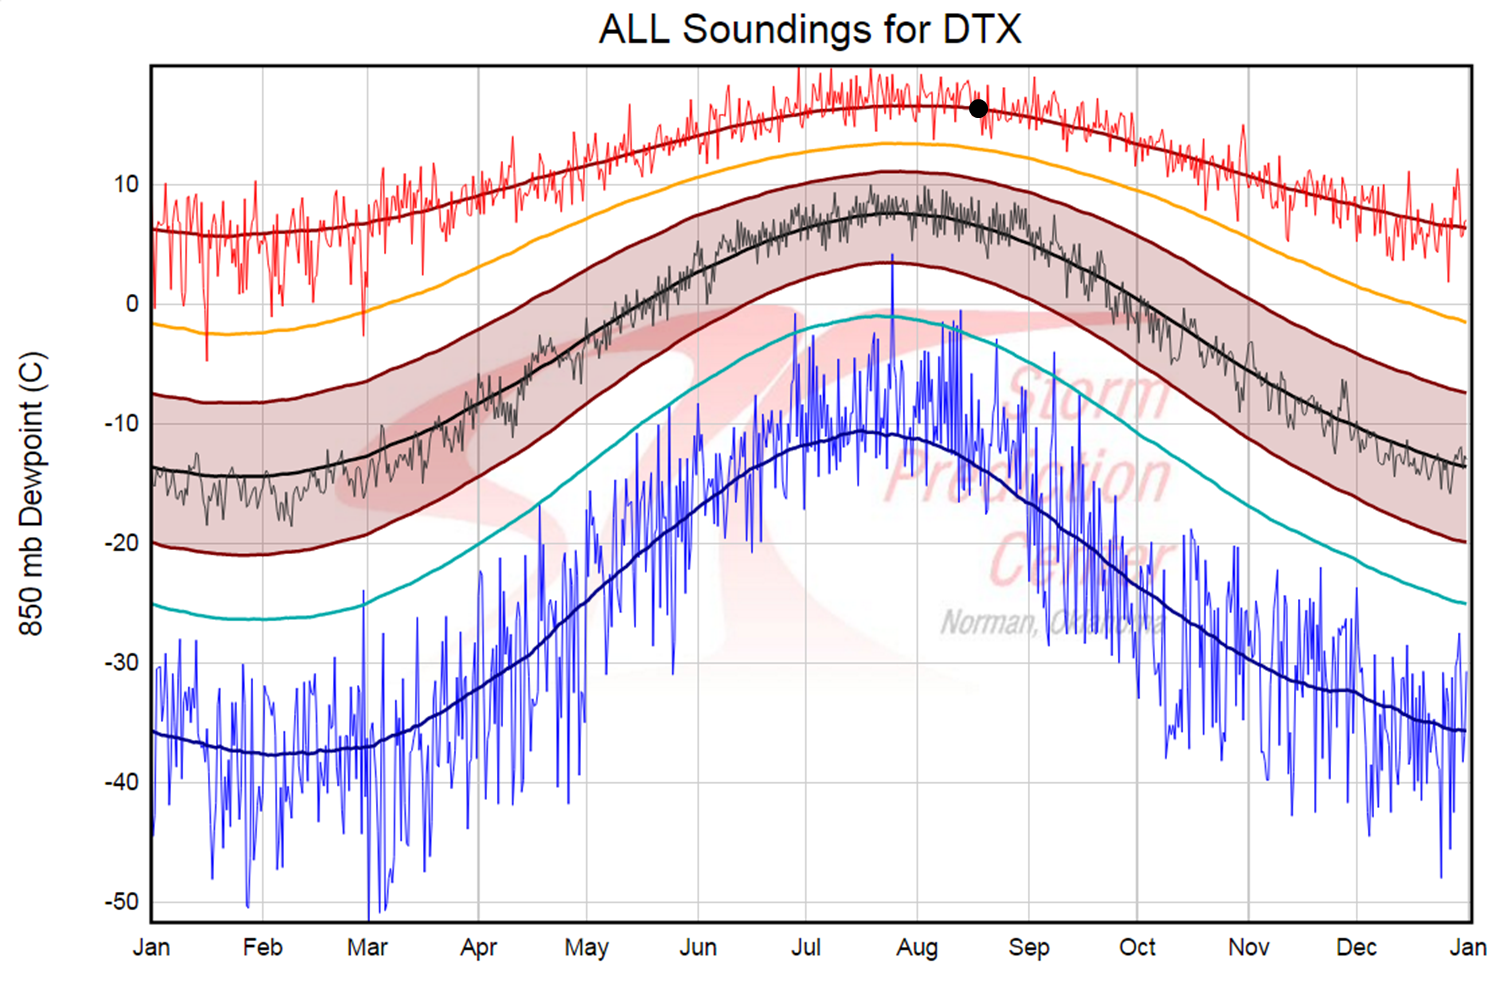
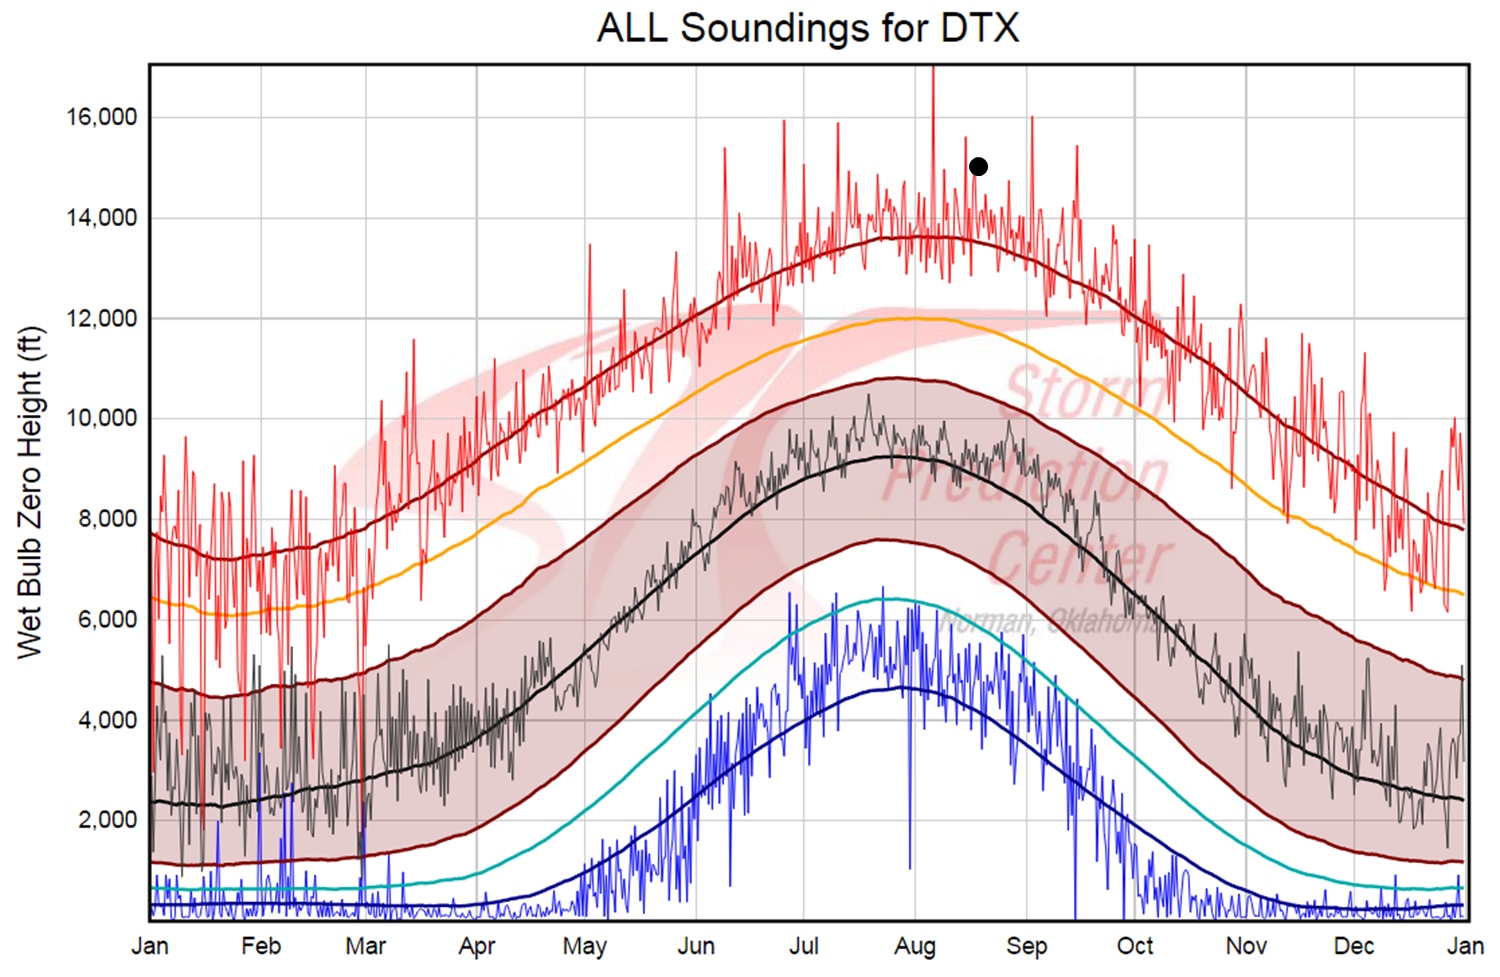
The August 16, 2016 heavy rain event originated as the system that brought historic flooding to Louisiana a few days earlier. As such, the system had copious tropical moisture to work with. This is illustrated by a plume of 2"+ precipitable water (Fig. 1) extending from the Gulf of America into the Great Lakes. This moisture was transported ahead of a low-level circulation that tracked northward across the upper Midwest into the Great Lakes region (Fig. 2). The moisture quality was sampled by the 12Z Aug. 16 KDTX RAOB (Fig. 3), which included a precipitable water value of 2.24", 850 mb and 700 mb dewpoints of 16.4 and 8.8 degrees Celsius, respectively, and a wet-bulb zero height of 14.9 kft. All of these parameters were at or above the daily maximum moving average per the SPC climatology (Figs. 4-7). Heavy rainfall occurred as this moisture converged on the nose of a 30-45 kt low level jet, and also within the deformation region northwest of the low-level cyclone (Figs. 8-9) that tracked from roughly the southern tip of Lake Michigan into the Thumb of Michigan. The system moved fairly quickly, which mitigated any major flooding threat.
 |
 |
 |
| Figure 1: 1-h RAP forecast of precipitable water (in) valid 0800Z (4:00 am) 16 Aug 2016 | Figure 2: 1-h RAP forecast of 850 mb heights (solid), theta-e (dashed), and moisture transport (fill and vector) valid 0500Z (1:00 am) 16 Aug 2016 | Figure 3: 12Z (8:00 am) 16 Aug 2016 KDTX RAOB |
 |
 |
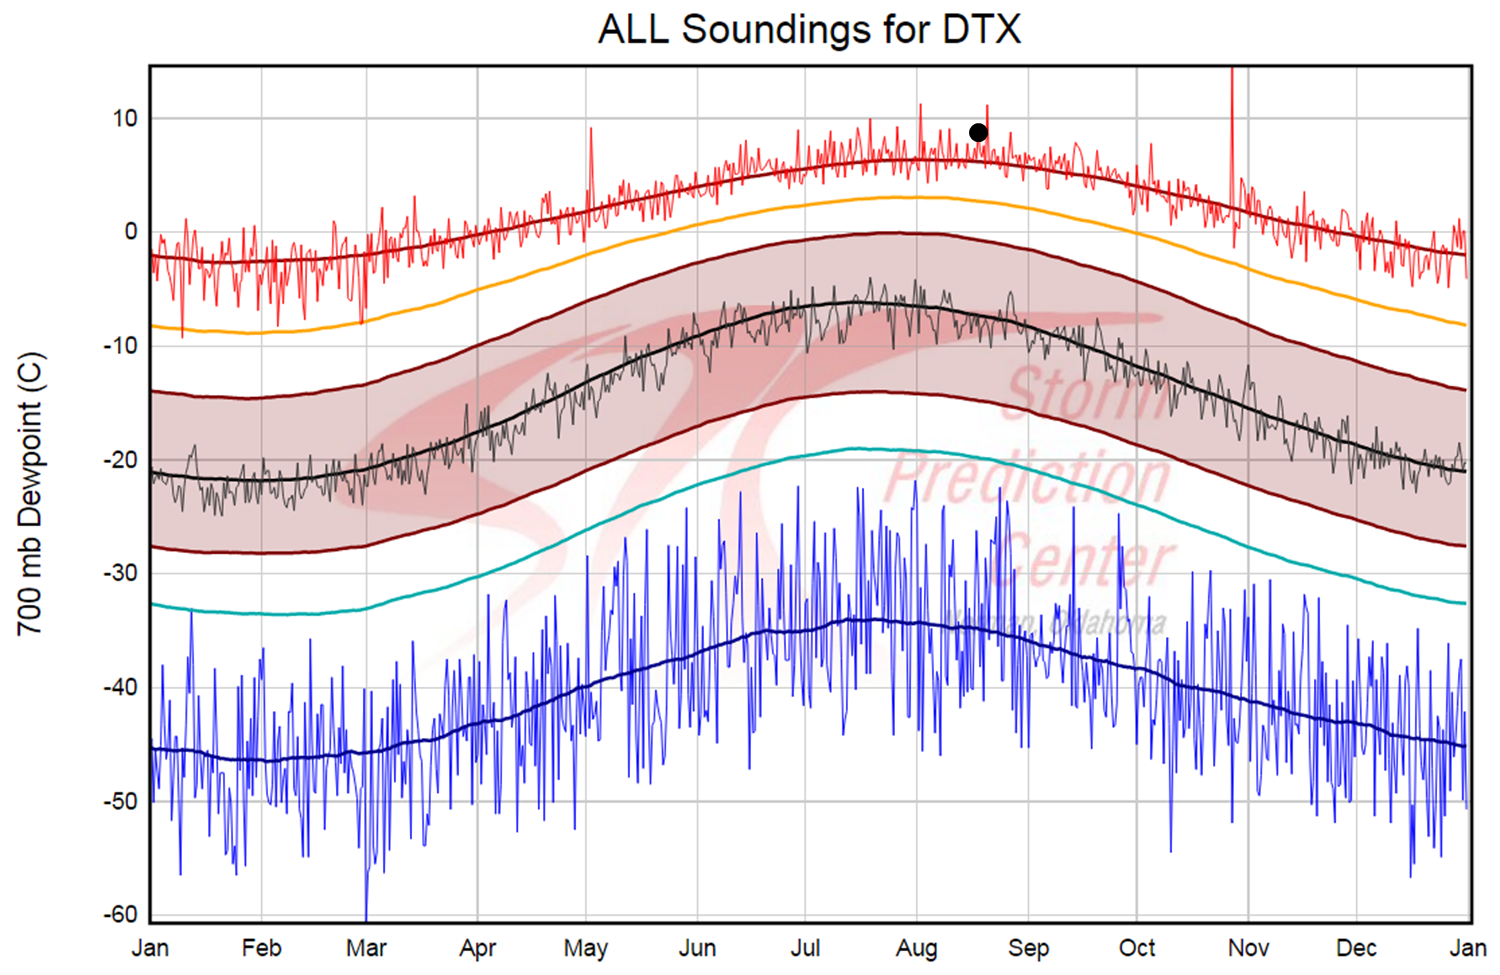 |
| Figure 4: Precipitable water climatology derived from KDTX RAOBs plotted according to the convention in http://www.spc.noaa.gov/exper/soundingclimo/. Top smooth line is the 91-day running average of the daily maximum value. Dot denotes value of the 12Z 16 Aug 2016 value | Figure 5: As in Fig. 4 but for 850 mb dewpoint | Figure 6: As in Fig. 4 but for 700 mb dewpoint |
 |
 |
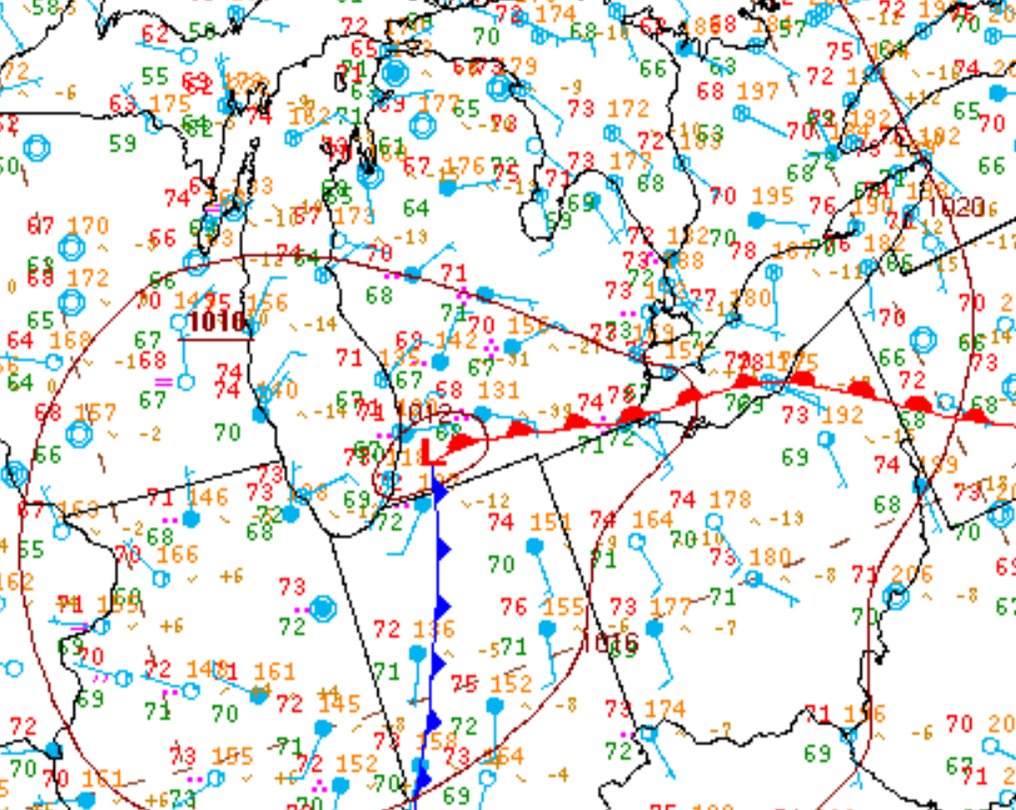 |
| Figure 7: As in Fig. 4 but for wet-bulb zero height | Figure 8: WPC surface analysis and radar composite valid 0600Z (2:00 am) 16 Aug 2016 | Figure 9: WPC surface analysis and surface observations valid 0600Z (2:00 am) 16 Aug 2016 |
 |
Media use of NWS Web News Stories is encouraged! Please acknowledge the NWS as the source of any news information accessed from this site. |
|

