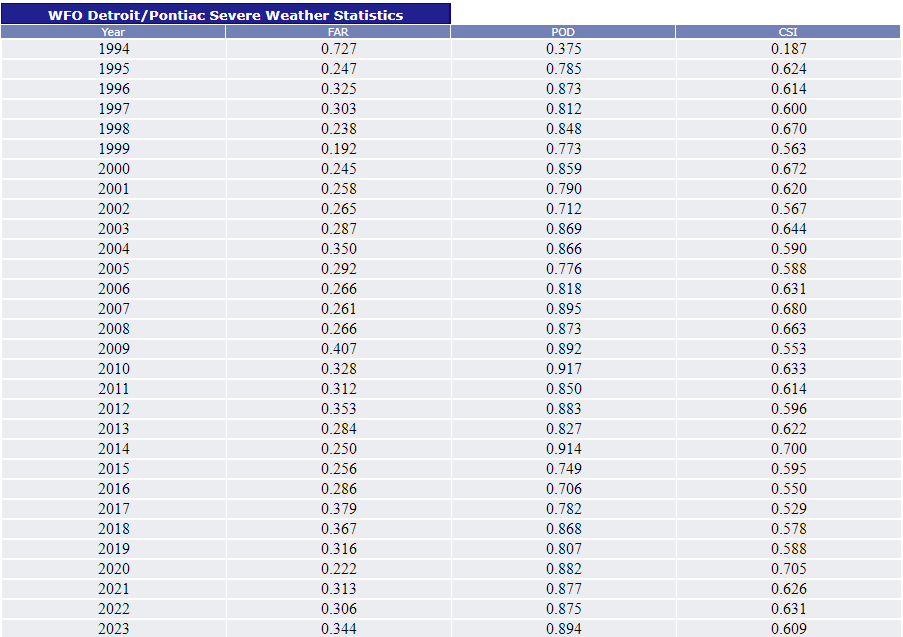
WFO Detroit/Pontiac Severe Weather Statistics |
|
Year |
FAR |
POD |
CSI |
*1994* |
0.727 |
0.375 |
0.187 |
1995 |
0.247 |
0.785 |
0.624 |
1996 |
0.325 |
0.873 |
0.614 |
1997 |
0.303 |
0.812 |
0.600 |
1998 |
0.238 |
0.848 |
0.670 |
1999 |
0.192 |
0.773 |
0.563 |
2000 |
0.245 |
0.859 |
0.672 |
2001 |
0.258 |
0.790 |
0.620 |
2002 |
0.265 |
0.712 |
0.567 |
2003 |
0.287 |
0.869 |
0.644 |
2004 |
0.350 |
0.866 |
0.590 |
2005 |
0.292 |
0.776 |
0.588 |
2006 |
0.266 |
0.818 |
0.631 |
2007 |
0.261 |
0.895 |
0.680 |
2008 |
0.266 |
0.873 |
0.663 |
2009 |
0.407 |
0.892 |
0.553 |
2010 |
0.328 |
0.917 |
0.633 |
2011 |
0.312 |
0.850 |
0.614 |
2012 |
0.353 |
0.883 |
0.596 |
2013 |
0.284 |
0.827 |
0.622 |
2014 |
0.250 |
0.914 |
0.700 |
2015 |
0.256 |
0.749 |
0.595 |
2016 |
0.286 |
0.706 |
0.550 |
2017 |
0.379 |
0.782 |
0.529 |
2018 |
0.367 |
0.868 |
0.578 |
2019 |
0.316 |
0.807 |
0.588 |
2020 |
0..222 |
0.882 |
0.705 |
Year |
FAR |
POD |
CSI |
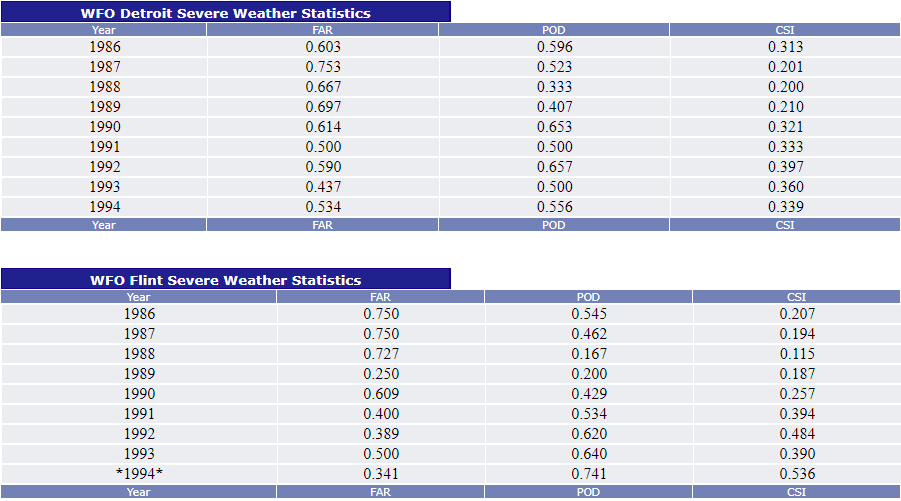
WFO Detroit Severe Weather Statistics |
|
Year |
FAR |
POD |
CSI |
1986 |
0.603 |
0.596 |
0.313 |
1987 |
0.753 |
0.523 |
0.201 |
1988 |
0.667 |
0.333 |
0.200 |
1989 |
0.697 |
0.407 |
0.210 |
1990 |
0.614 |
0.653 |
0.321 |
1991 |
0.500 |
0.500 |
0.333 |
1992 |
0.590 |
0.657 |
0.397 |
1993 |
0.437 |
0.500 |
0.360 |
*1994* |
0.534 |
0.556 |
0.339 |
Year |
FAR |
POD |
CSI |
WFO Flint Severe Weather Statistics |
|
Year |
FAR |
POD |
CSI |
1986 |
0.750 |
0.545 |
0.207 |
1987 |
0.750 |
0.462 |
0.194 |
1988 |
0.727 |
0.167 |
0.115 |
1989 |
0.250 |
0.200 |
0.187 |
1990 |
0.609 |
0.429 |
0.257 |
1991 |
0.400 |
0.534 |
0.394 |
1992 |
0.389 |
0.620 |
0.484 |
1993 |
0.500 |
0.640 |
0.390 |
*1994* |
0.341 |
0.741 |
0.536 |
Year |
FAR |
POD |
CSI |
* White Lake forecast office assumed County Warning responsibility for the WSO Detroit and Flint areas on July 23 1994.
False Alarm Ratio (FAR): This ratio measures how often we issue false alarms, in other words, a measure of crying wolf. Ideally we want this to be 0.0%.
FAR = Unverified warnings / (verified warnings + Unverified warnings)
Probability of Detection (POD): This is the percentage of all events which were warned events, a perfect score would be 100%.
POD= Warned events / (warned events + unwarned events)
Critical Success Index (CSI): CSI is the ratio of warned events to the total number of events + the number of unwarned events. As with the POD, 100% is a perfect score.
CSI = Warned events / (warned events + unwarned events + unverified warnings)