Overview
|
A very warm and humid airmass supported the development of thunderstorms. Weak winds aloft limited storm motion speeds leading to some stationary storms that produced flooding. One storm developed right over Metro Airport, producing 2.68" of rainfall in 2.5 hours. In other areas, cells clustered together and formed linear segments which produced loclaized areas of stronger to damagining wind gusts. |
Radar
  |
 |
| Radar loop courtesy of Iowa Environmental Mesonet (IEM) |
Photos
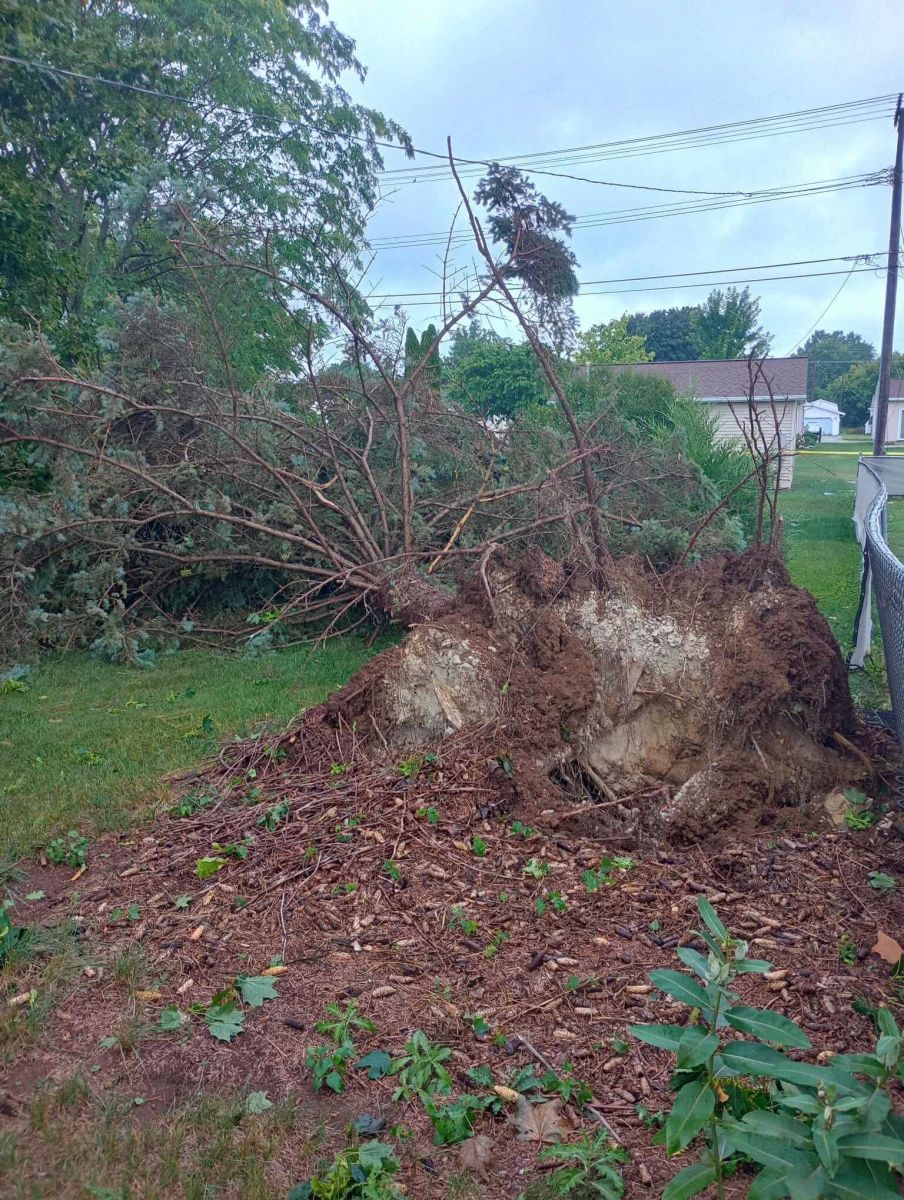
Wind Damage Photos
 |
 |
 |
| Tree uprooted in Bad Axe, near M-53 and Pine, courtesy of WNEM | Tree down in Kawkawlin, courtesy of WNEM | Tree down in Pinconning, courtesy of WNEM |
Flooding Photos
 |
||
| Road flooding in Roseville at 14 Mile & Groesbeck, courtesy of @DetroitScanner |
Storm Reports
Public Information Statement...Summary
National Weather Service Detroit/Pontiac MI
931 AM EDT Tue Jul 29 2025

STORM TOTAL RAIN REPORTS

Location                   Precip      Duration
                          (Inches)      (Hours)        Lat       Lon

...Huron County...
   3 S Bloomfield Township M  1.69           24     43.86N    82.84W

...Macomb County...
   Se Shelby Township      M  1.62           24     42.67N    83.03W
   Warren                  M  2.20           24     42.49N    83.03W
   3 SW Shelby Township    M  2.34           24     42.64N    83.07W
   Roseville               M  3.01            3     42.50N    82.94W
   1 SW Waldenburg         M  3.57            2     42.64N    82.96W
   Saint Clair Shores      M  4.00            2     42.50N    82.89W

...Oakland County...
   3 NNE Southfield        M  2.38           24     42.48N    83.26W
   Beverly Hills           M  2.85          3.5     42.52N    83.22W

...Washtenaw County...
   2 SE Dexter             M  1.36           24     42.31N    83.85W
   Manchester              M  1.40           24     42.15N    84.04W
   4 SW Saline             M  2.83           24     42.13N    83.84W
   7 W Ann Arbor           M  2.85            6     42.28N    83.87W

...Wayne County...
   2 NE Livonia            M  1.00           24     42.42N    83.34W
   2 NW Dearborn Heights   M  1.47           24     42.36N    83.30W
   Detroit Metro Airport   M  2.68            4     42.20N    83.34W
   Romulus                 M  3.31          1.5     42.22N    83.37W
M = Measured
E = Estimated
Observations are collected from a variety of sources with varying
equipment and exposures. We thank all volunteer weather observers
for their dedication. Not all data listed are considered official.
 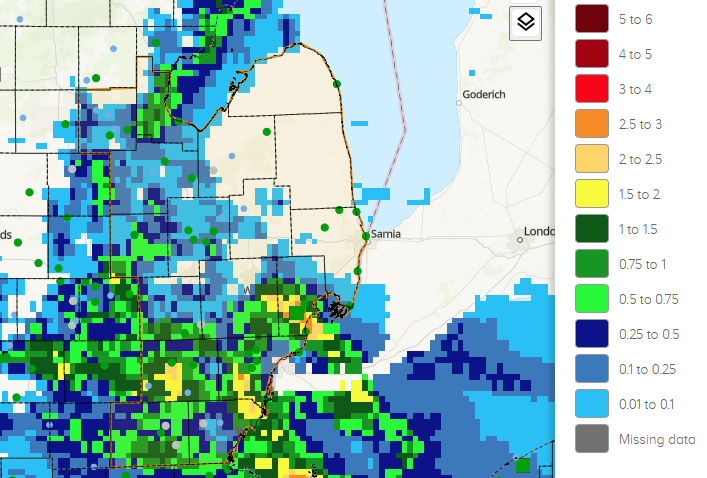 |
| Rainfall estimates via National Water Prediction Service: water.noaa.gov |
Preliminary Local Storm Report...Summary
National Weather Service Detroit/Pontiac MI
930 AM EDT Tue Jul 29 2025

..TIME...   ...EVENT...      ...CITY LOCATION...     ...LAT.LON...
..DATE...   ....MAG....      ..COUNTY LOCATION..ST.. ...SOURCE....
            ..REMARKS..

0336 PM     Tstm Wnd Dmg     Romulus                 42.22N  83.37W
07/28/2025                   Wayne              MI   County Official

            Numerous downed power lines in the Romulus area.

0400 PM     Flash Flood      Romulus                 42.22N  83.37W
07/28/2025                   Wayne              MI   Broadcast Media

            Mulitple reports of flooding covering roadways and
            vehicles stranded.

0420 PM     Flash Flood      1 SE Romulus            42.21N  83.35W
07/28/2025                   Wayne              MI   Public

            Multiple roads closed due to flooding throughout
            Detroit Metro Airport.

0430 PM     Flash Flood      Fraser                  42.54N  82.95W
07/28/2025                   Macomb             MI   Public

            Numerous roadways completely flooded.

0430 PM     Flash Flood      Sterling Heights        42.58N  83.03W
07/28/2025                   Macomb             MI   Trained Spotter

            Numerous roadways completely flooded.

0437 PM     Marine Tstm Wind Grosse Pointe YC        42.43N  82.87W
07/28/2025  M40 mph          Wayne              MI   Mesonet

0448 PM     Marine Tstm Wind Peche Island Light      42.36N  82.91W
07/28/2025  M40 mph          LCZ460             MI   Mesonet

0450 PM     Marine Tstm Wind SC S Harbor             42.47N  82.88W
07/28/2025  M44 mph          LCZ460             MI   C-Man Station

0600 PM     Flood            1 E Fraser              42.54N  82.94W
07/28/2025                   Macomb             MI   Trained Spotter

            Roadway completely flooded.

0630 PM     Marine Tstm Wind 11 NW Sand Point        44.02N  83.54W
07/28/2025  M52 mph          LHZ421             MI   C-Man Station

            Measured at Gravelly Shoal Light.

0724 PM     Tstm Wnd Dmg     Linwood                 43.74N  83.98W
07/28/2025                   Bay                MI   Public

            Numerous trees and powers lines down.

0730 PM     Tstm Wnd Gst     Killarney Beach         43.69N  83.92W
07/28/2025  M66 mph          Bay                MI   Mesonet
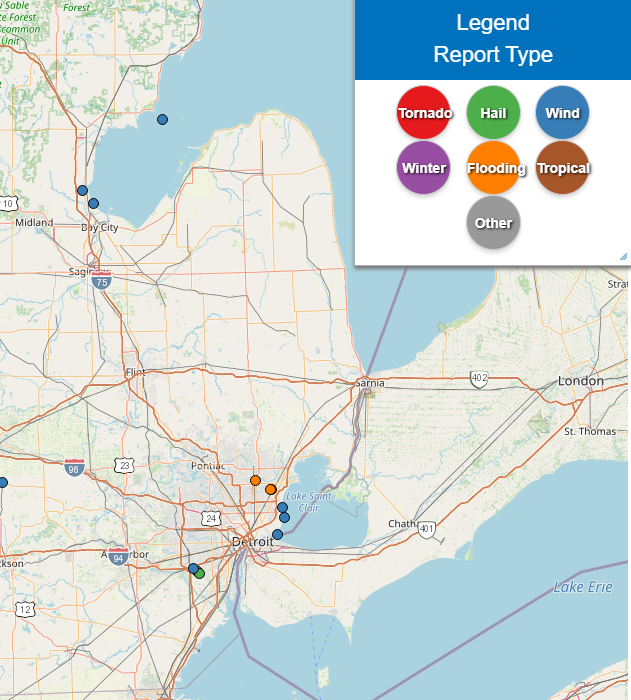 |
| Storm reports map via NWS CRH: https://www.weather.gov/source/crh/lsrmap.html |
Environment
Warm and dry mid levels were in-place over Southeast Michigan, as 12Z DTX sounding (Fig. 2) came in with a 700 mb temperature of 10C and 22C dew point depression. At the surface, a humid airmass had dew points residing in the mid 70s (Fig. 1 & 6). A cold front sank south through the central Great Lakes during the evening and overnight hours. The pooling of low-level moisture and 850 mb Theta-e ridge generated moderate instability which touched off numerous showers and thunderstorms, some which produced flooding as PWATs apporached 2.00 inches (Fig. 4). The approach of the main cold front was the other focus for additional showers and storms during the evening due to low-level convergence enhancement. Low-level wind fields generally remained weak. Several strong and damainging downburst winds were attributed to DCAPE values over 1000 J/kg and MLCAPEs 1500-2500 J/kg (Fig. 5). Displaced right entrance upper-level jet (Fig. 3) kept dynamic contribution to a minimum.
 |
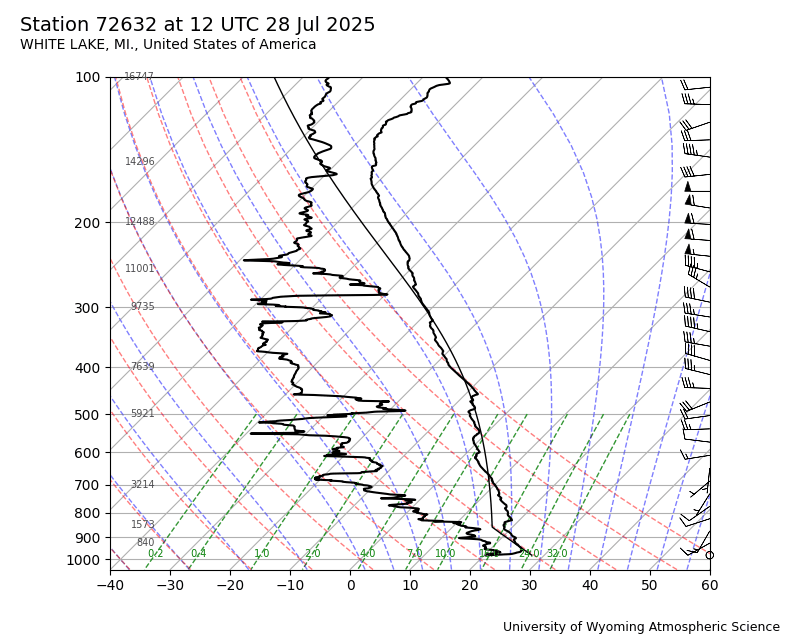 |
 |
| Figure 1: WPC Surface Analysis, valid 18 UTC 28 July 2025 | Figure 2: DTX Sounding, valid 12 UTC 28 July 2025 | Figure 3: 300 mb Level Analysis, valid 18 UTC 28 July 2025 |
 |
 |
 |
| Figure 4: Precipitable Water (in) in lowest 400mb, valid 18 UTC 28 July 20225 | Figure 5: MLCAPE, MLCIN, and Effective Bulk Shear, valid 18 UTC 28 July 2025 | Figure 6: Surface dewpoint and 700-500 mb lapse rate, valid 18 UTC 28 July 2025 |
 |
Media use of NWS Web News Stories is encouraged! Please acknowledge the NWS as the source of any news information accessed from this site. |
|

