| Overview | Radar | Damage Surveys | SPC Products | Meteorology |
Temperatures soaring into the lower 90s across much of Southeast Michigan set the stage for severe storms as a strong cold front dropped south into southern Lower Michigan yesterday evening. First round of storms developed near Saginaw Bay during the early afternoon hours. A second round of storms arrived during the evening hours, spawning an EF1 tornado in Owendale in western Huron County. The solid line of storms then tracked south through all of southeast Michigan, exiting the State shortly after midnight. Sporadic wind damage occurred, leaving over 60,000 DTE customers without power. Rainfall totals exceeded 2 inches in isolated spots. There was also golf ball size hail reported near Saginaw.
| Radar loop courtesy of Iowa Environmental Mesonet (IEM). |
Radar snapshot during the tornado - Clockwise from upper right: storm-relative velocity, normalized rotation (nrot), correlation coefficient, base reflectivity. All data from the 0.5 degree scan. Click image for larger version.
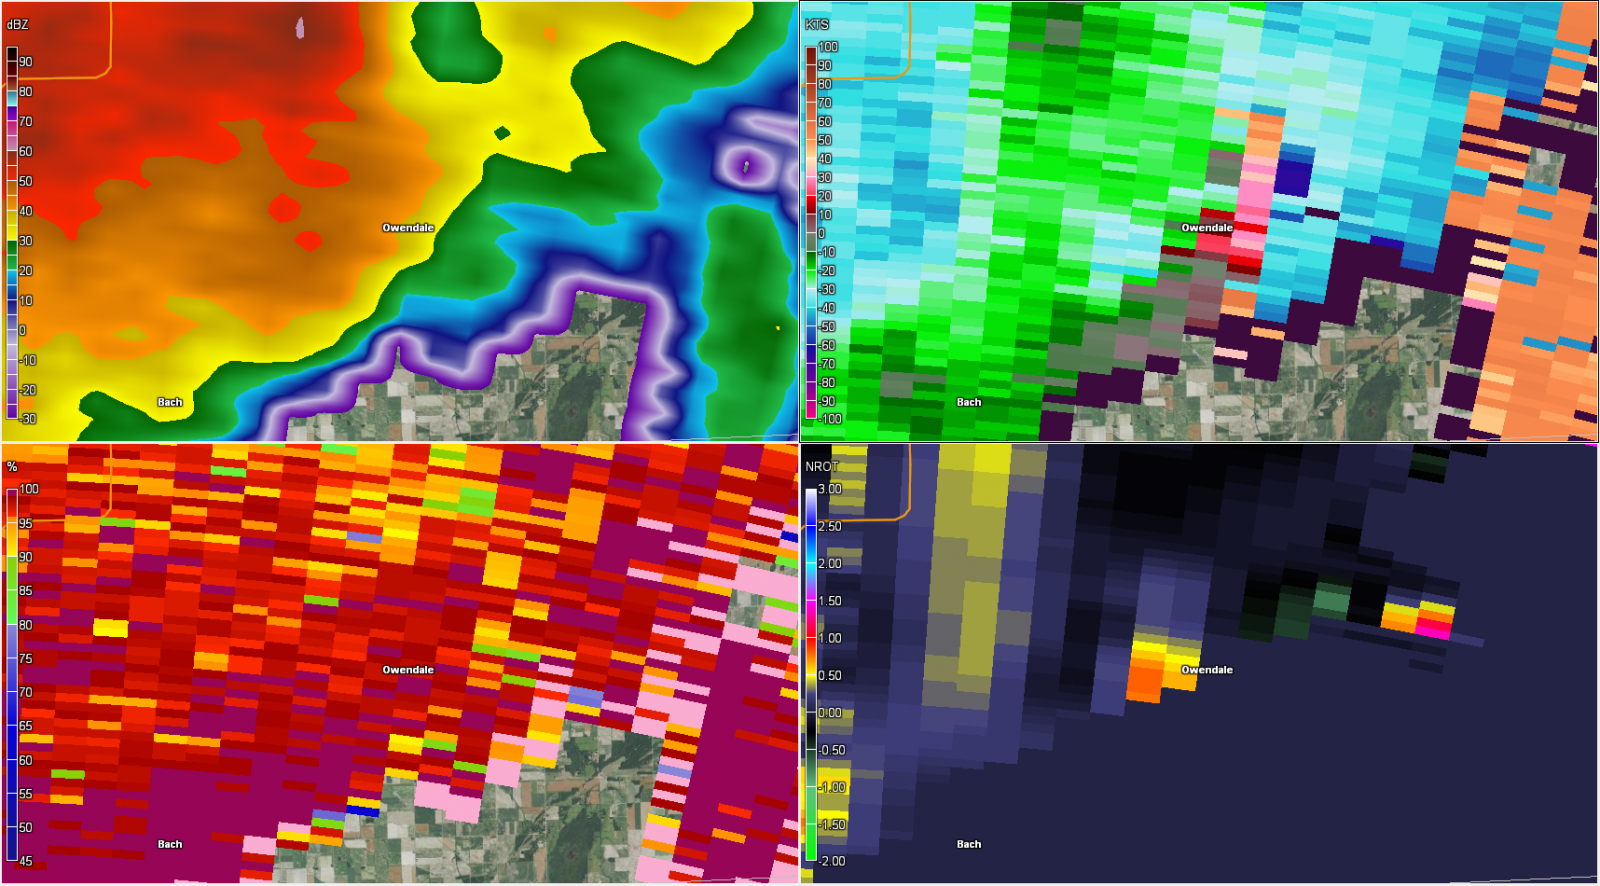 |
| 6:41 pm (tornado near Owendale) |
|
|
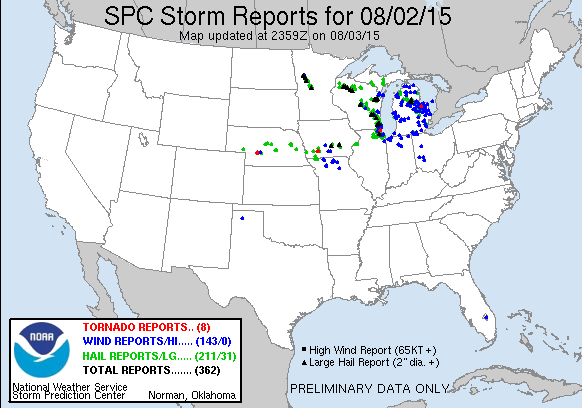
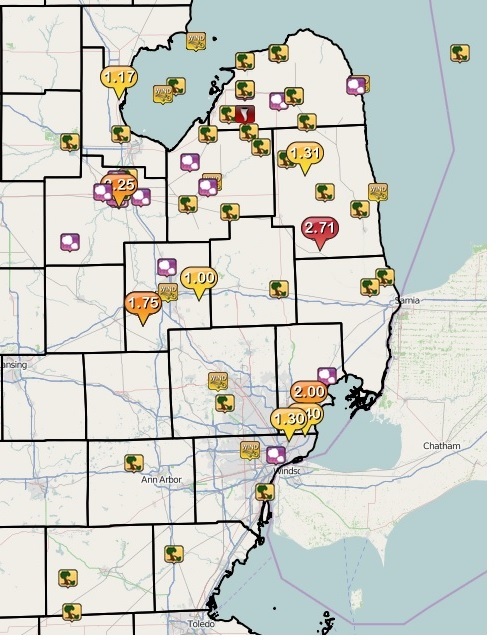
| Image courtesy of Iowa Environmental Mesonet (IEM). Local Storm Reports (LSR) are also shown plotted on the map. |
|
|
Text Summary of Local Storm Reports
Radar estimated rainfall (inches)
Text Listing of Rainfall Reports
Back to top
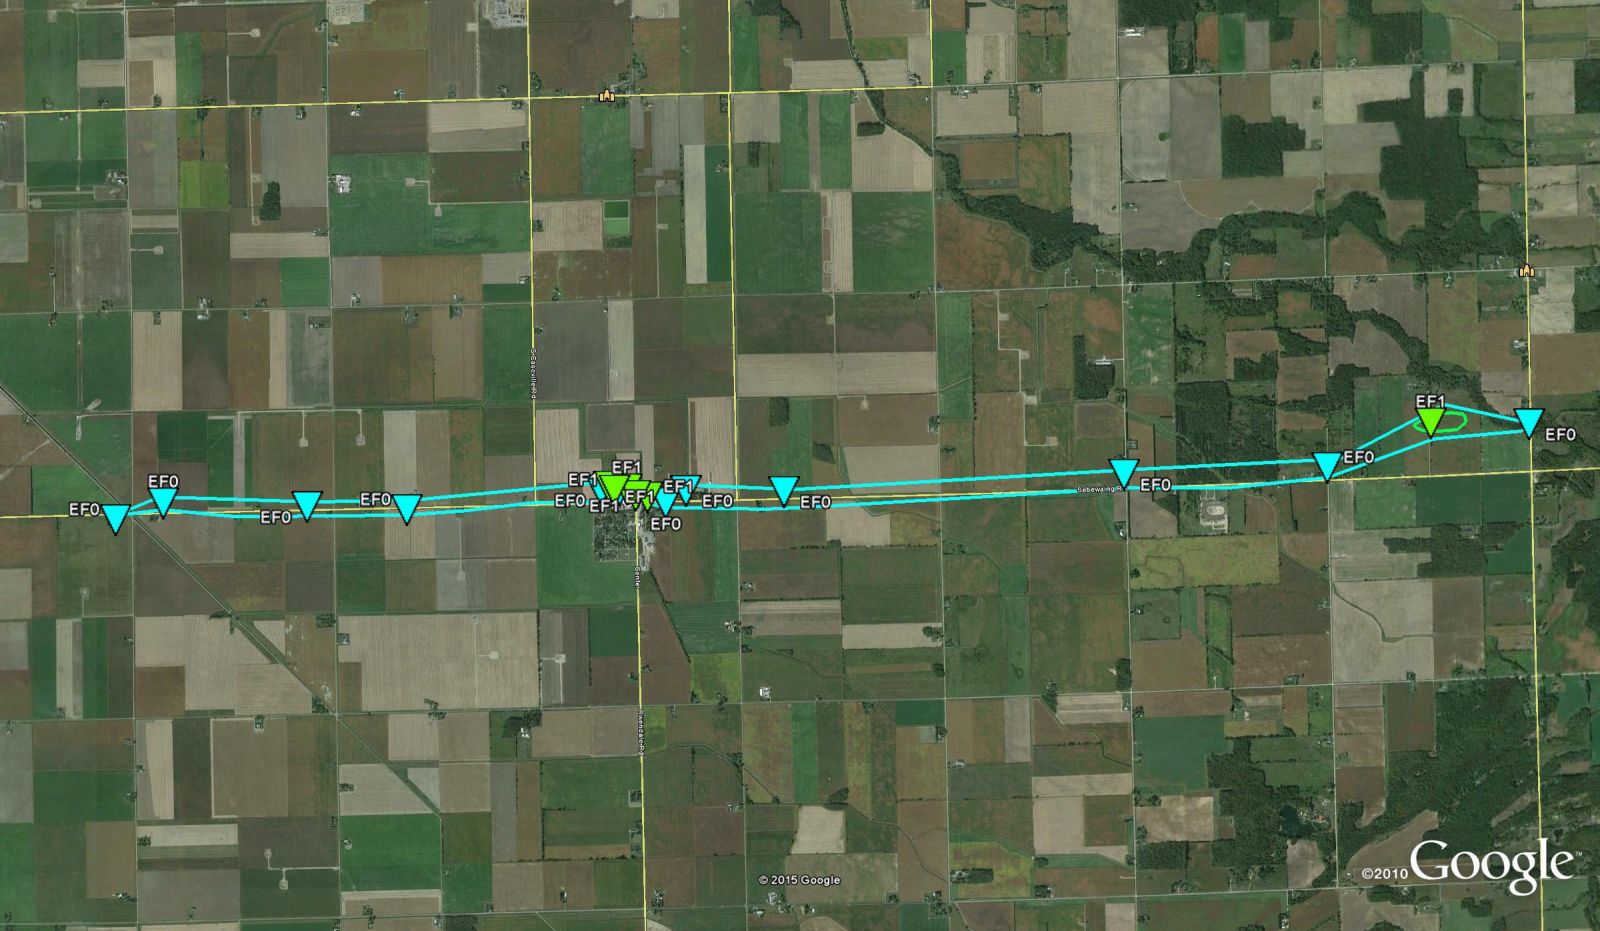
An EF1 tornado was confirmed in Owendale, MI (Huron County)
Tornado Track:
 |
 |
 |
 |
 |
 |
Back to top
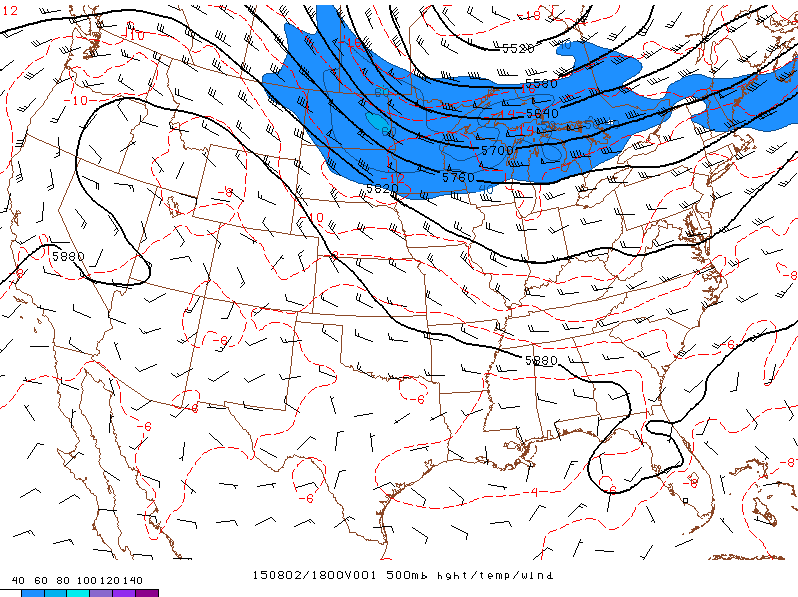
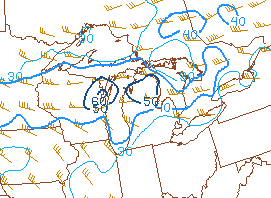
Strong flow of 45-60 kt at 500 mb existed across the Northern Plains into the Western Great Lakes along the southern periphery of a deep upper low centered over Hudson Bay (Fig. 1). At the surface, at 2 pm, an area of low pressure was centered over the western U.P. with a cold front extending southwestward and a warm front extending eastward (Fig. 2). Strong southwesterly winds in the warm sector and rather deep mixing allowed temperatures over Southeast Michigan to surge into the upper 80s and low 90s, with dewpoints in the low to mid-60s. An uncapped environment with ample instability was seen on the 18Z DTX sounding, as well as strong winds just off the surface (Fig. 3).
Storms developed along the warm front and ahead of the cold front across eastern Wisconsin and northern Lower Michigan. Multiple rounds of severe weather occurred across northern Michigan, including widespread damaging winds and hail up to softball size (the largest hail observed in northern Michigan since records began in 1950 - see the summary from WFO Gaylord). Closer to home, some severe storms developed across the Saginaw Valley and northern Thumb in the uncapped environment. These storms formed along an outflow boundary laid out from previous storms across northern Lower Michigan. These storms produced damaging wind and hail up to golf ball size.
Later in the afternoon, another large complex of storms pushed across northern Lower Michigan. This system had ample mixed-layer CAPE (1500-2500 J/kg, Fig. 4) and bulk shear (40-50 kt, Fig. 5) to remain organized. These storms were especially intense as they pushed across Saginaw Bay and the northern Thumb, leading to widespread wind damage as a bowing segment pushed ashore. A brief EF1 tornado spun up on the leading edge of this line (radar grab), affecting Owendale in western Huron County. 0-3 km storm-relative helicity was maximized over the Thumb, reaching 400+ m^2/s^2 (Fig. 6).
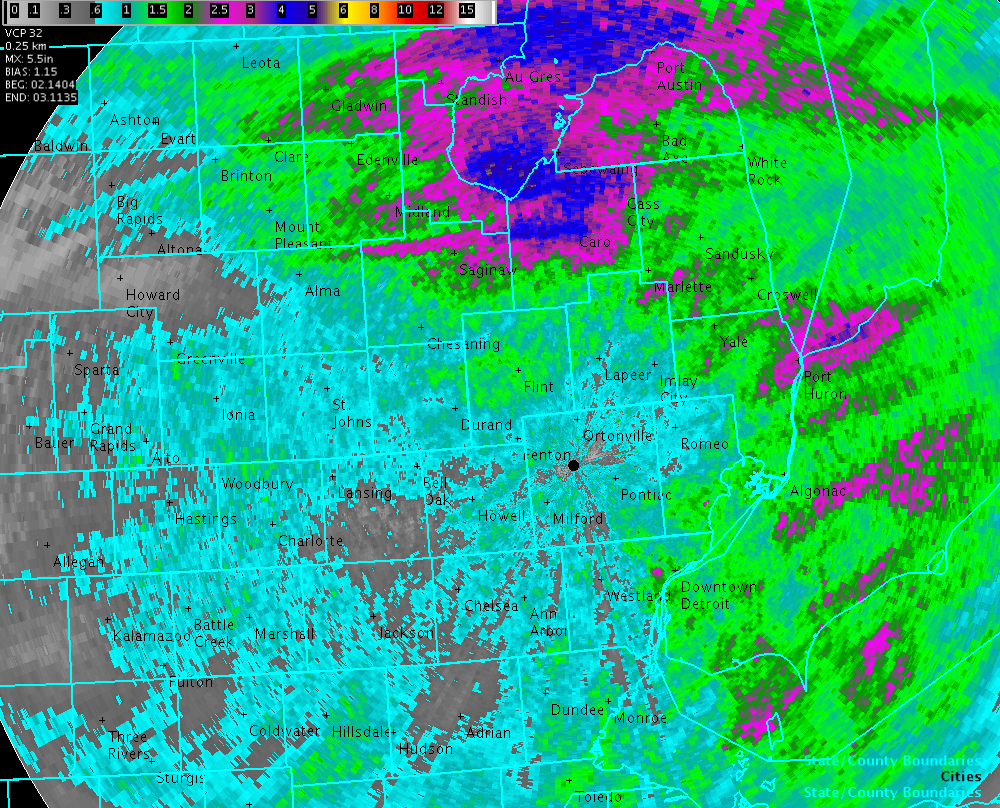
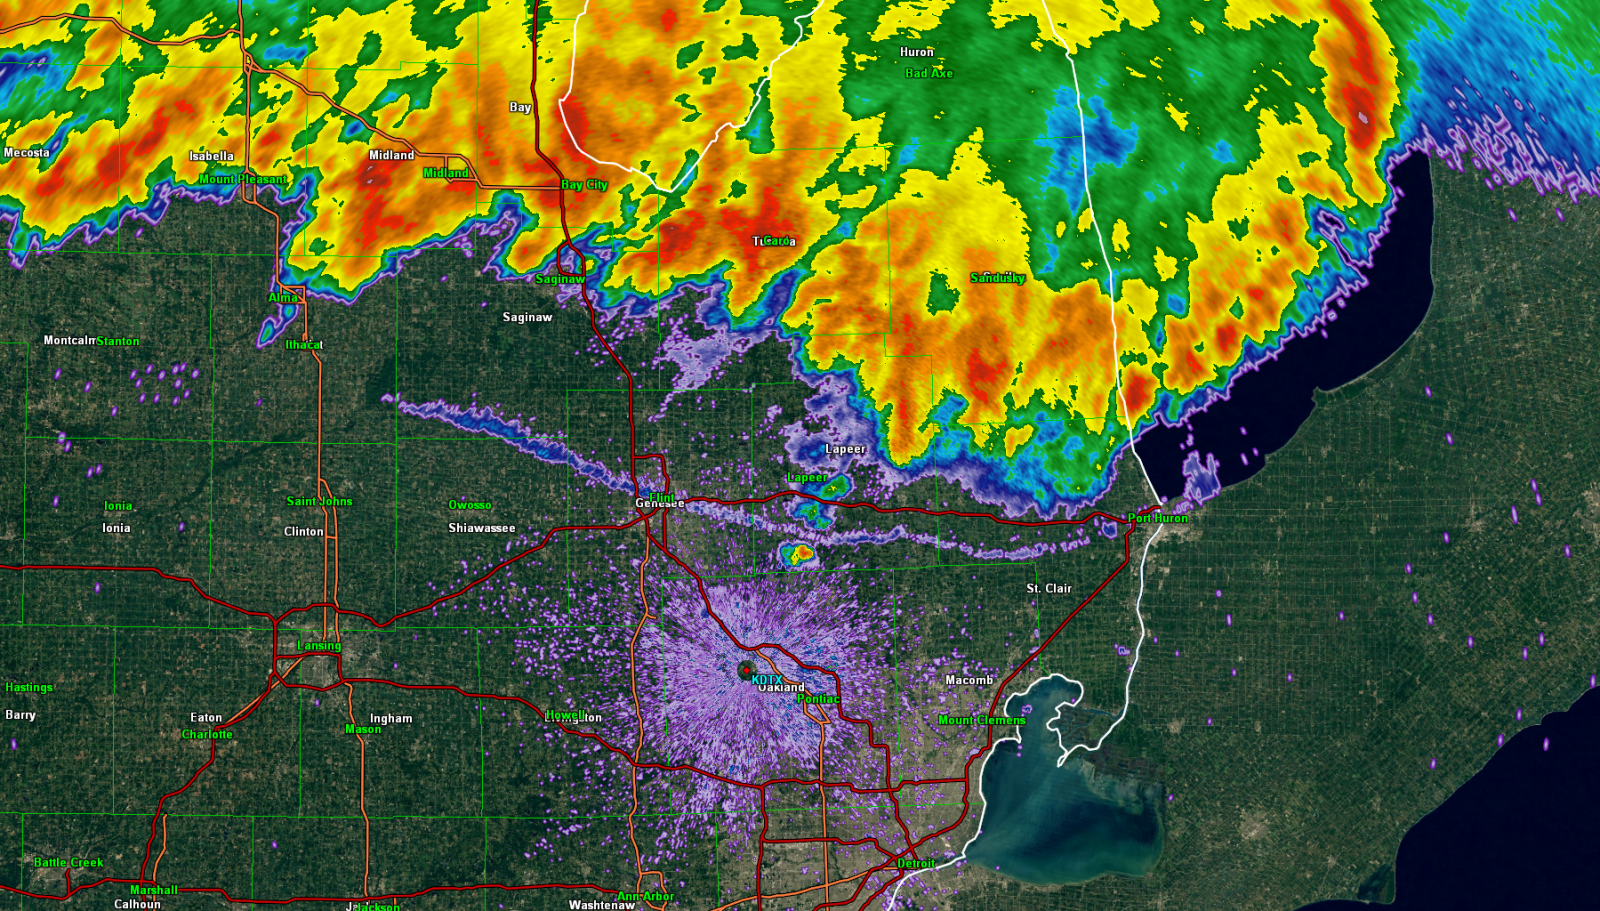
As this line continued south, its gust front raced out ahead of the main line of storms, leading to a weakening trend (Fig. 7). However, 40-60 mph winds occurred along the gust front, with isolated wind damage. The portion of the line in western Michigan eventually caught up to the gust front, leading to some strengthening of the storms over Metro Detroit, where a few reports of wind damage and hail occurred.
Click images for larger version.
 |
 |
 |
| Fig. 1. RAP 1-h forecast of 500 mb height (solid lines, m), temp (dashed lines, °C), wind (barbs, kt), wind speed (fills, kt) valid 1800 UTC (2 pm EDT). | Fig. 2. Surface observations and WPC analysis valid 1800 UTC (2 pm EDT). | Fig. 3. 1800 UTC (2 pm EDT) KDTX sounding. |
 |
 |
 |
| Fig. 4. RAP 1-h forecast of mixed-layer CAPE (J/kg) valid 2100 UTC (5 pm EDT). | Fig. 5. RAP 1-h forecast of effective bulk shear (kt) valid 2100 UTC (5 pm EDT). | Fig. 6. RAP 1-h forecast of 0-3 km storm-relative helicity (m2/s2) valid 2200 UTC (6 pm EDT). |
 |
||
| Fig. 7. 0.5° KDTX reflectivity at 0001 UTC 3 Aug (8:01 pm 2 Aug). |
Back to top


