Overview
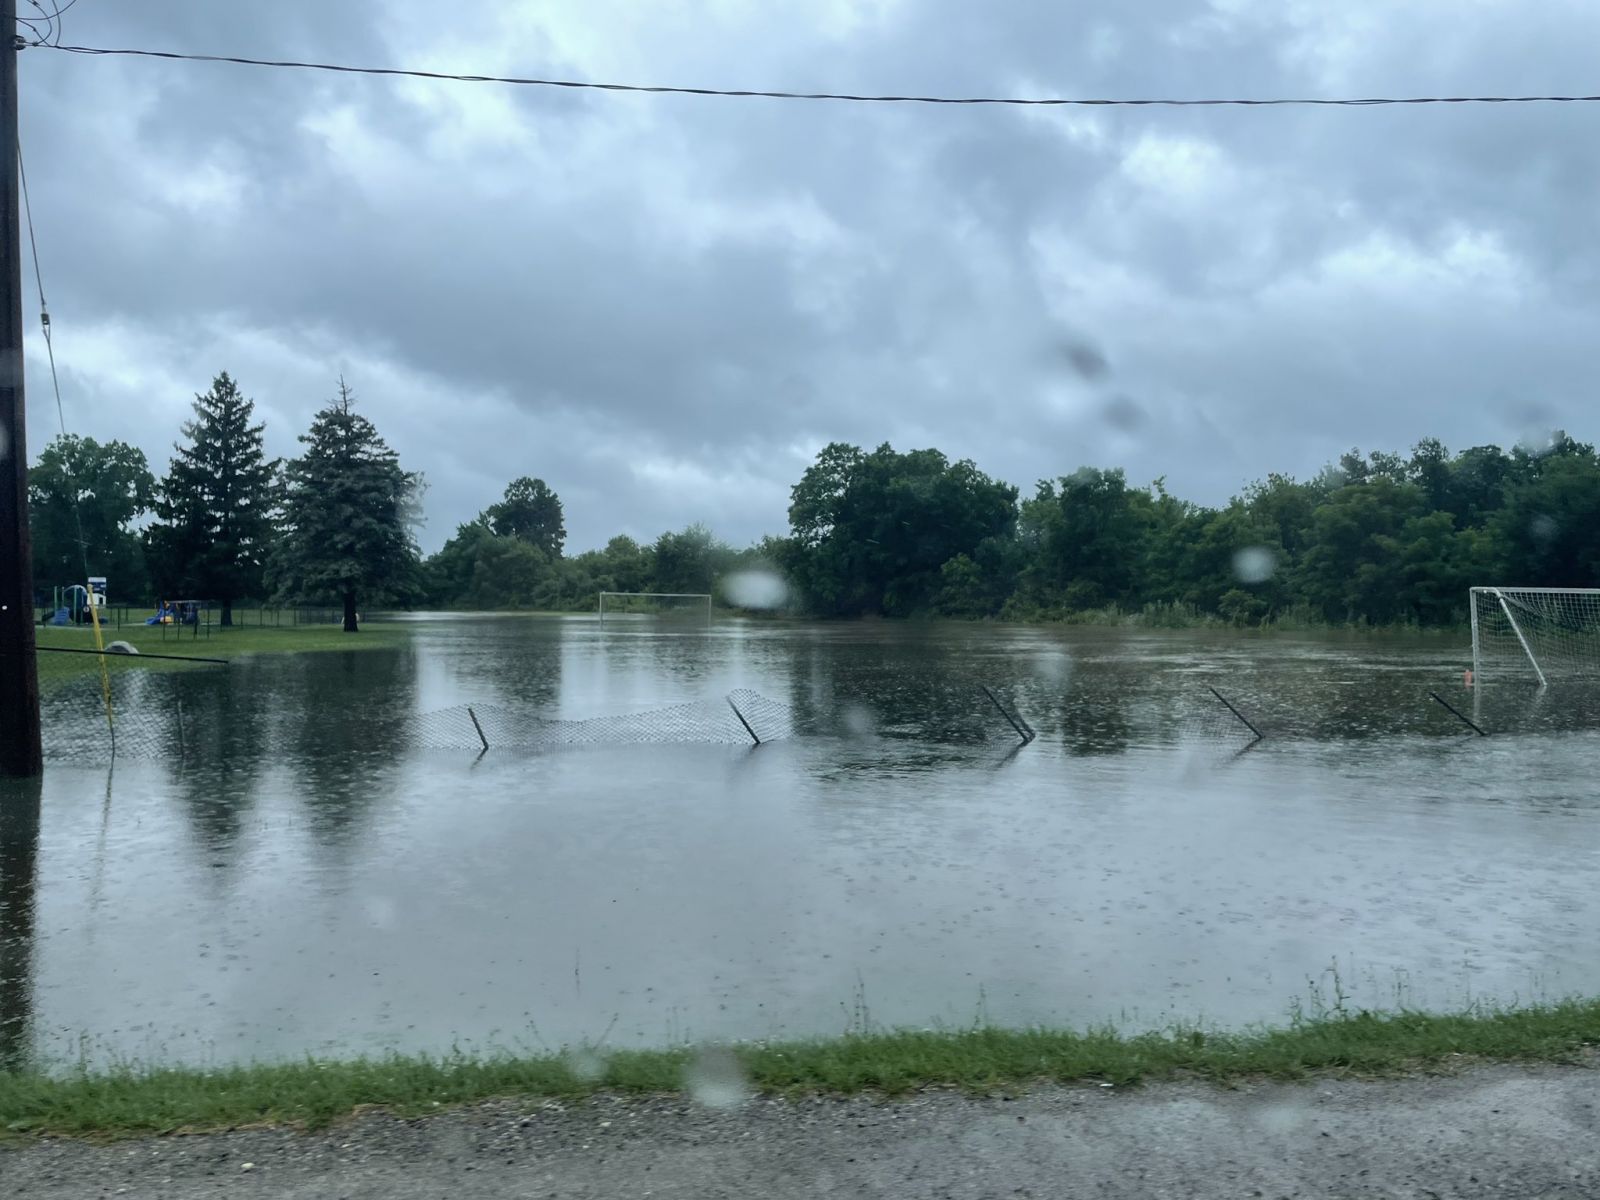
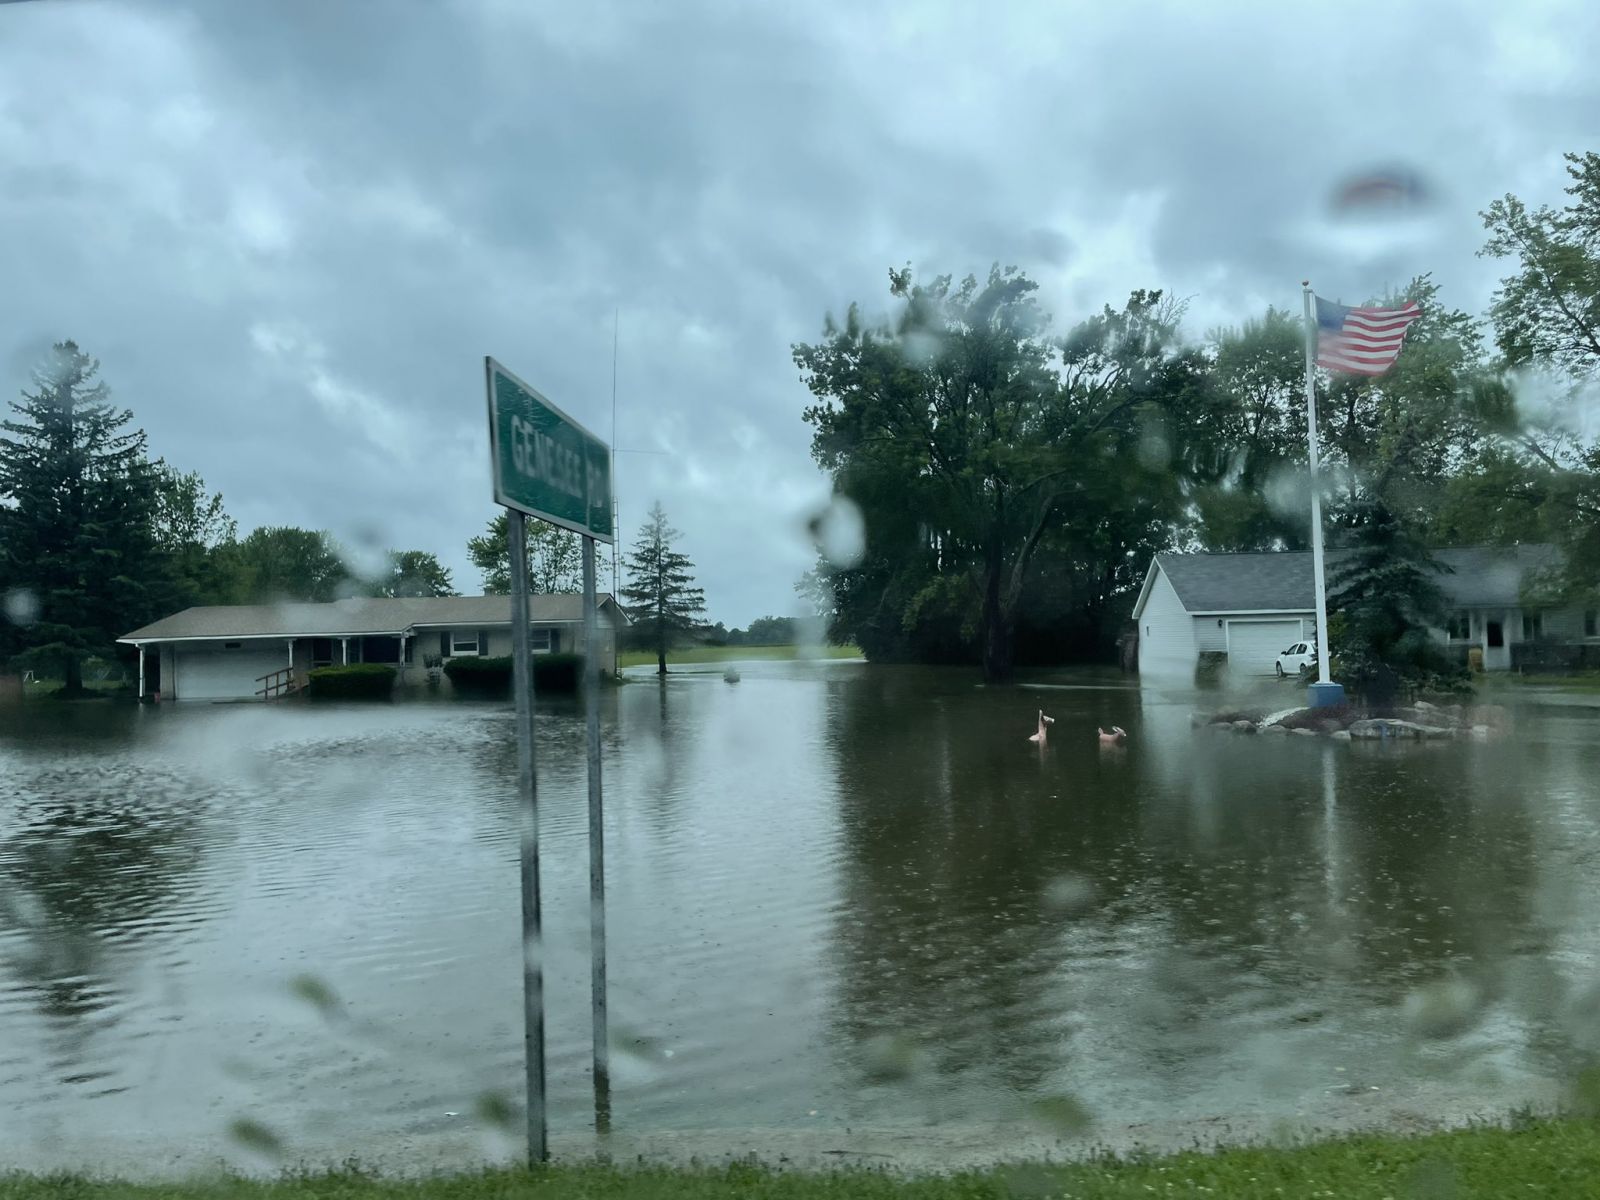
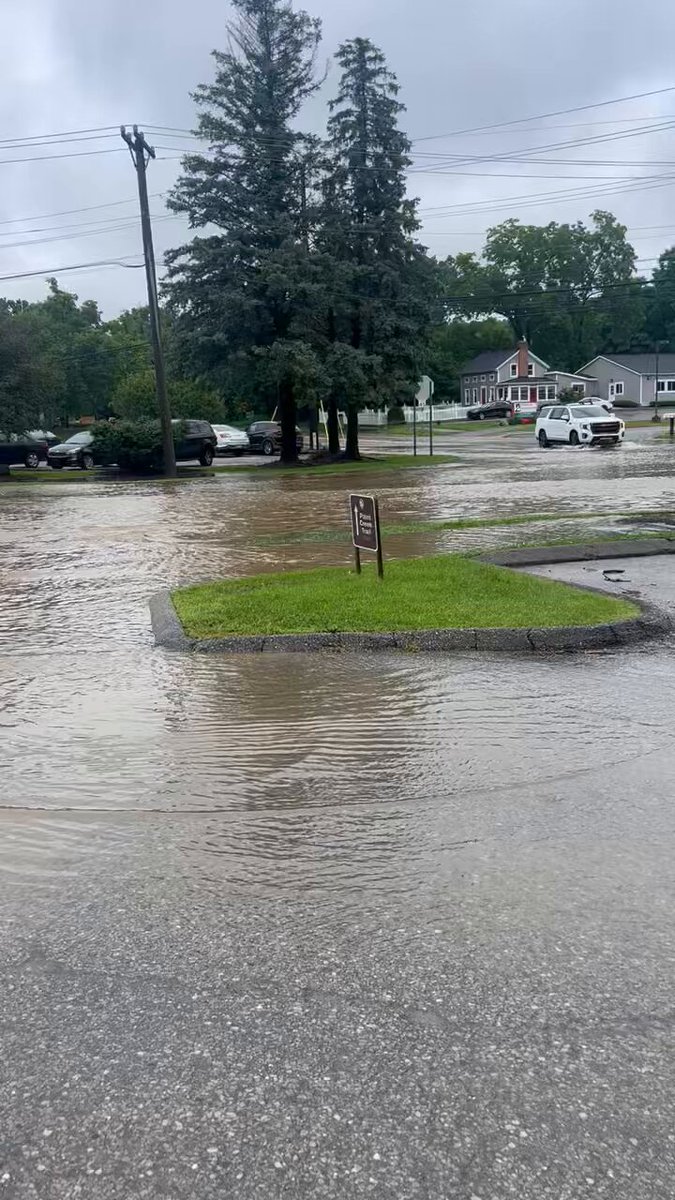
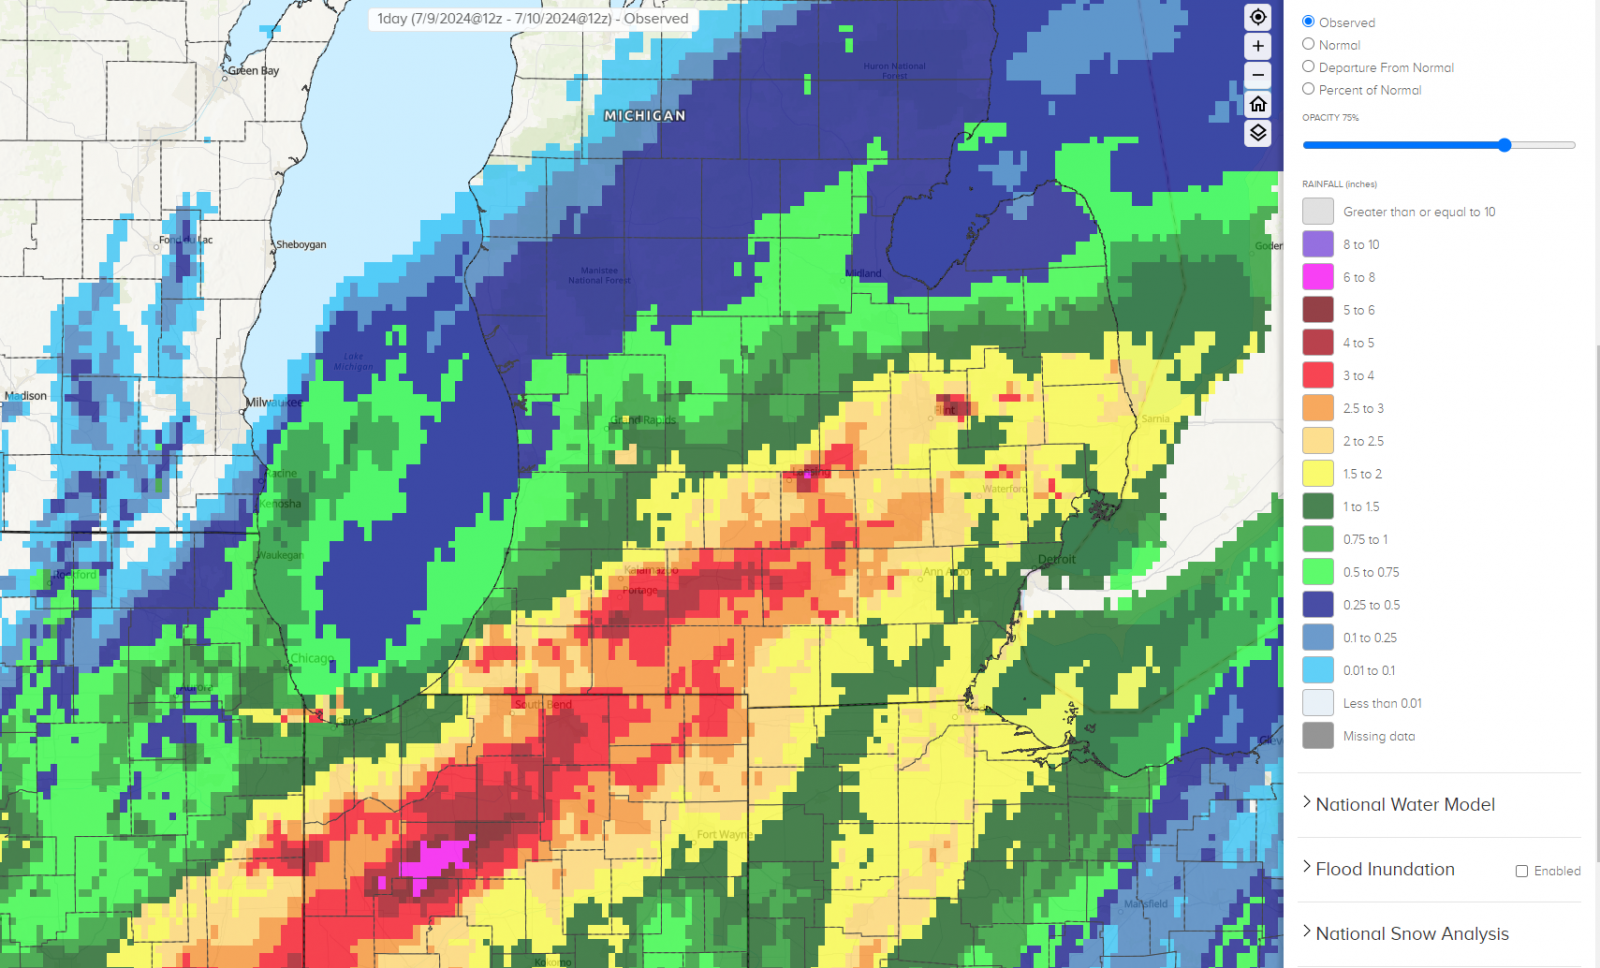
Tropical moisture, brought up by the remnants of Hurricane Beryl, dropped quite a bit of rain over Southeast Michigan over a 48-hour timeframe. Rain began across parts of the county warning area (CWA) on Tuesday, July 9th and continued through the day on Wednesday, July 10th. By the time the remnants of Hurricane Beryl moved off to the east, measured rainfall amounts were in the 2 to 6 inch range, with the highest amount of 7 inches east of Flint in Genesee County. The center of the post-tropical system tracked just to the south of Southeast Michigan as it made its way off to the northeast. Winds also accompanied the system, with wind gusts in the 30-35 mph range.
The official climate site at Flint Bishop Airport, broke their daily (24-hour) rainfall total on July 10th with 3.27 inches breaking the previous record of 1.63 inches set back in 1970.
This is the first post-tropical system to impact the local area since the remnants of Tropical Storm Cristobal in 2020. Other past tropical impacts are listed here.
Photos
 |
 |
 |
|
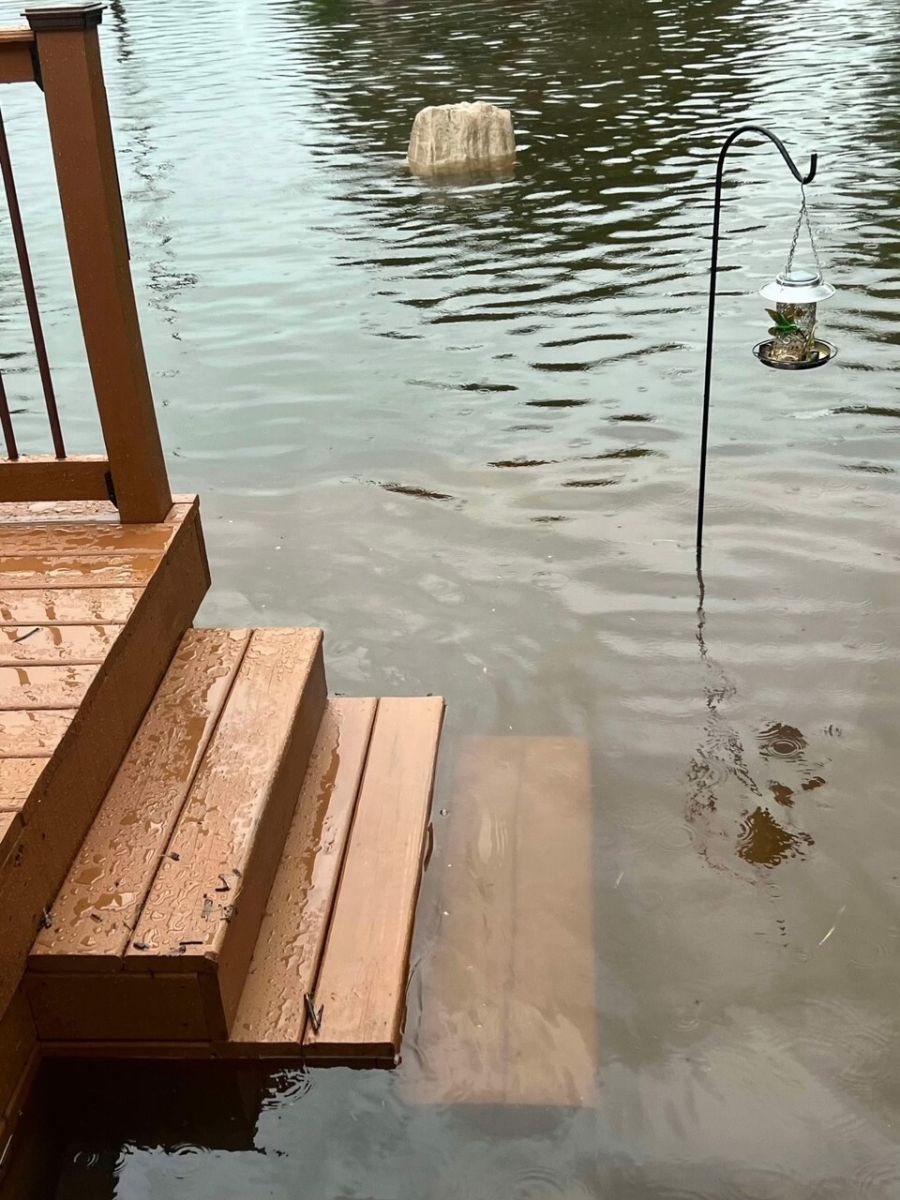
Davison Township, MI Credit: WNEM-TV |
Davison Township, MI Credit: WNEM-TV |
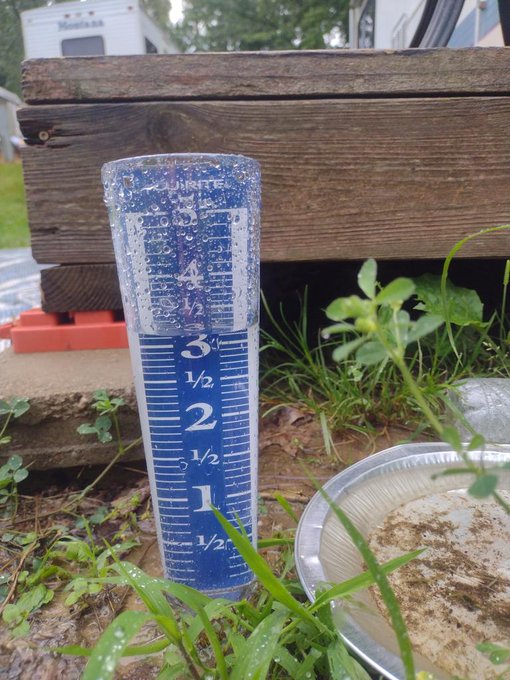
Otisville, MI Credit: TA515 (Twitter) |
 |
 |
 |
|
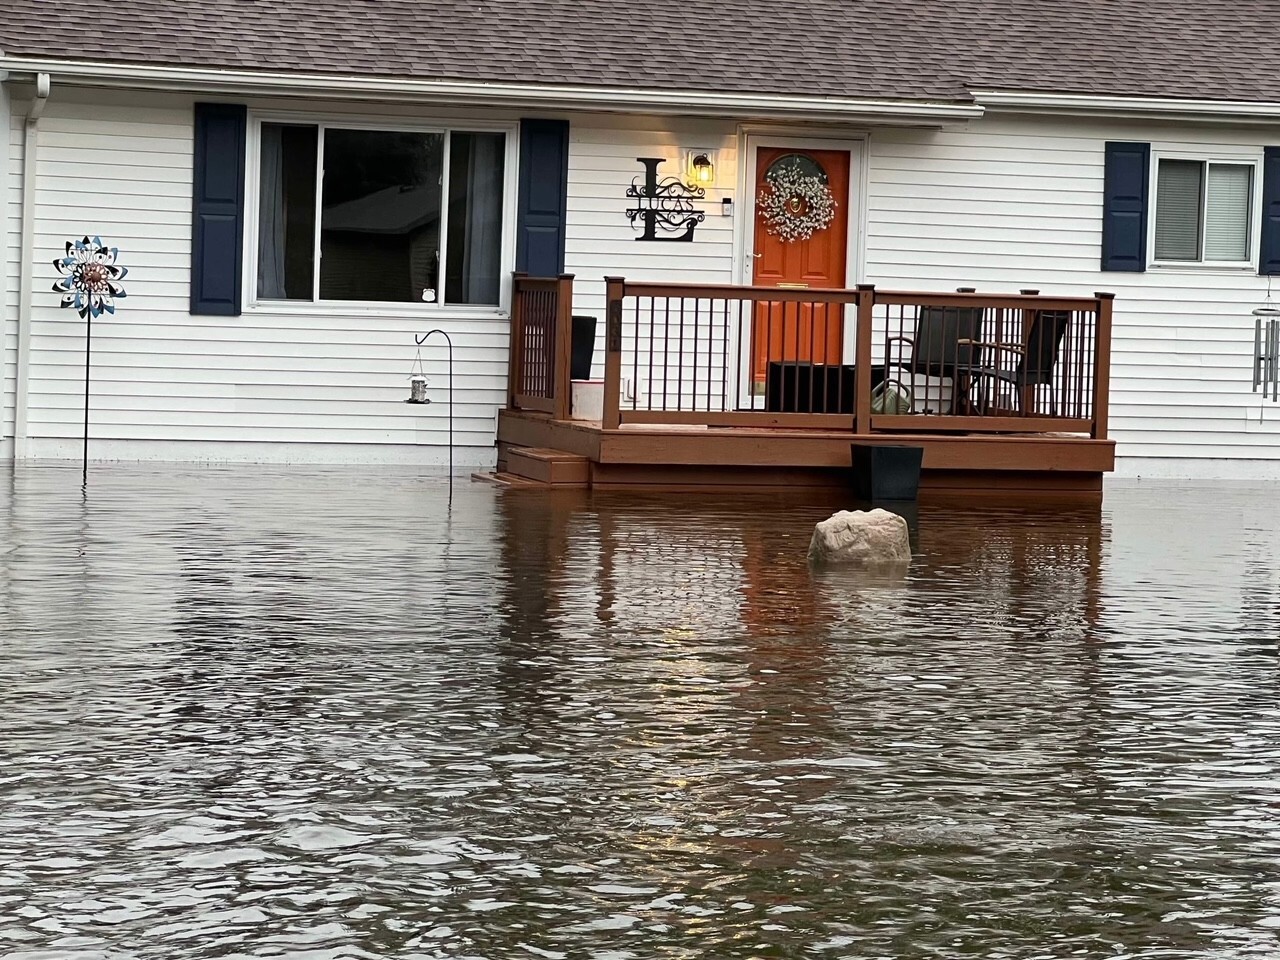
Burton, MI Credit: Easton (Twitter) |
Burton, MI Credit: Easton (Twitter) |
Burton, MI Credit: Easton (Twitter) |
 |
||
|
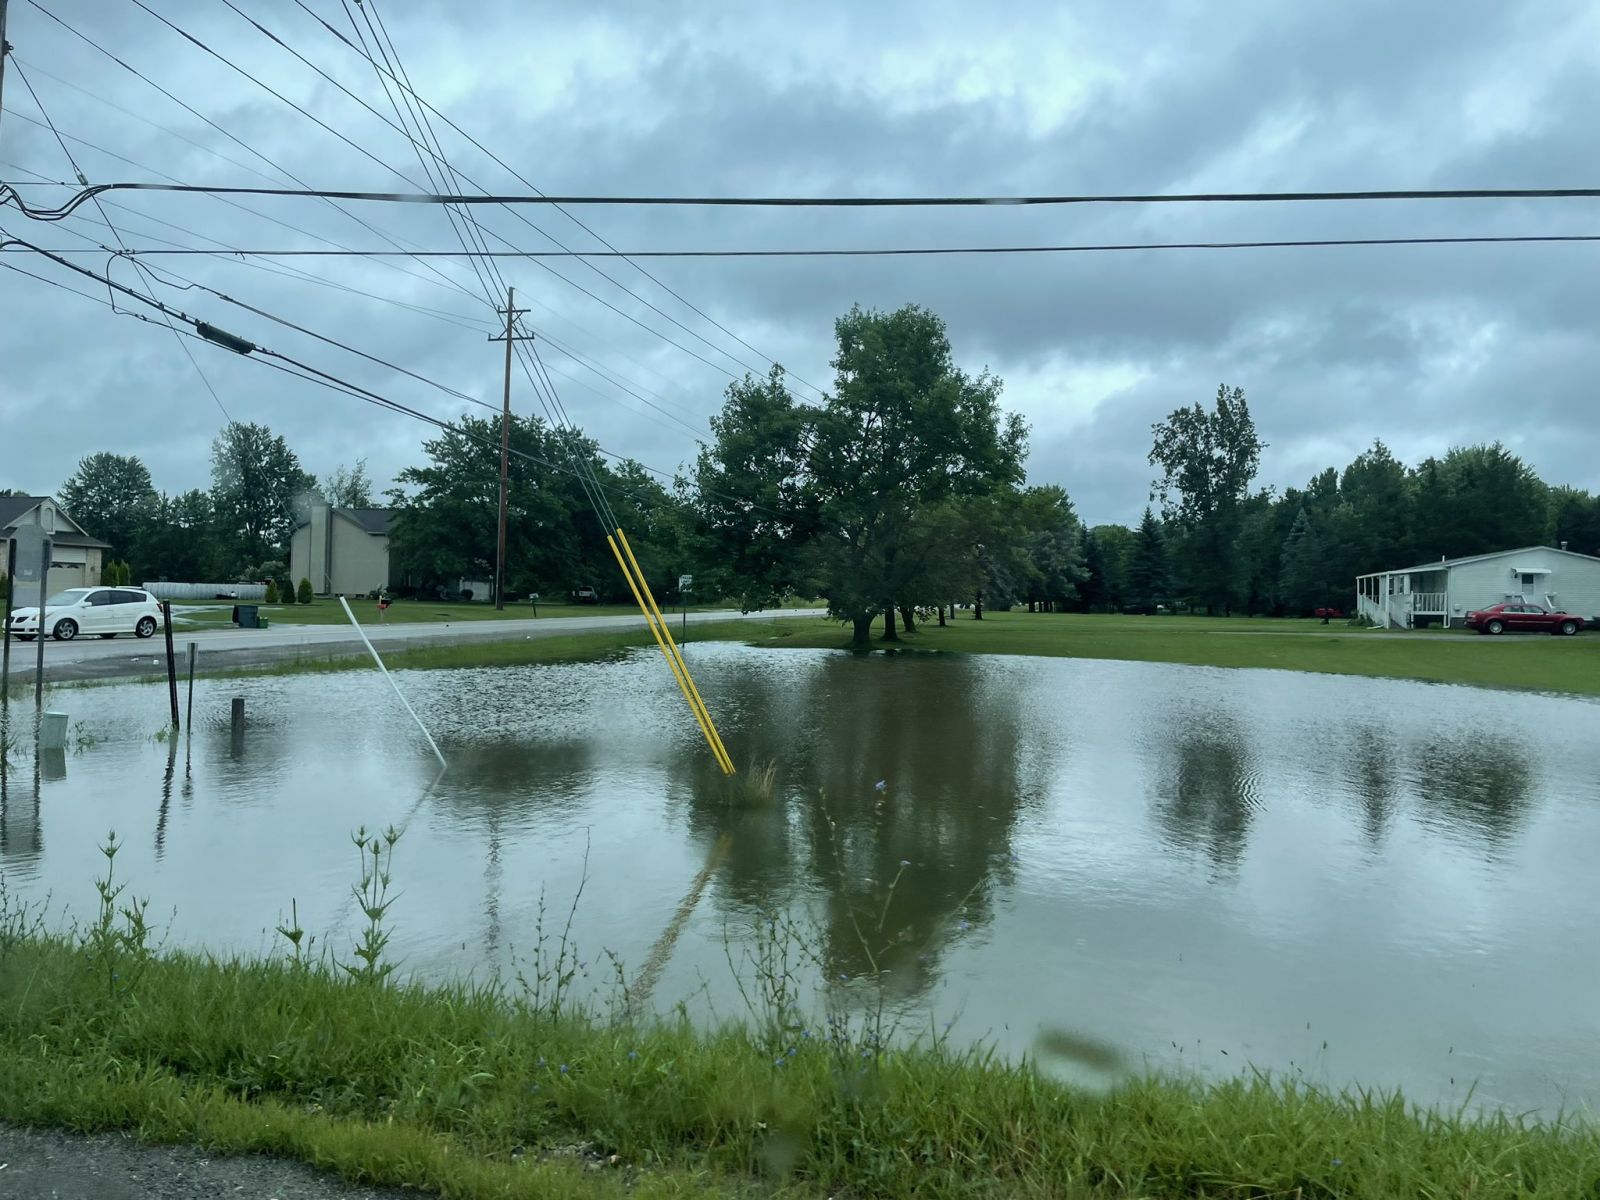
Oakland Charter Township, MI Credit: Aria (Twitter) |
Radar
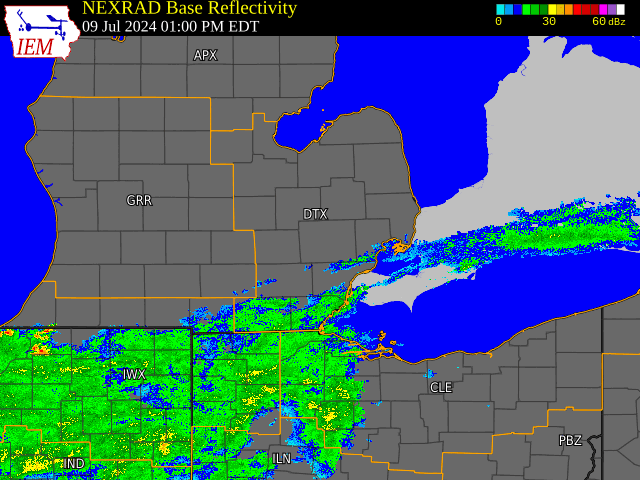
Radar loop courtesy of Iowa Environmental Mesonet (IEM)
Storm Reports
Local Storm Reports (Rainfall Totals):
Public Information Statement...Summary
National Weather Service Detroit/Pontiac MI
936 AM EDT Thu Jul 11 2024


STORM TOTAL RAIN REPORTS

Location                   Precip      Duration
                          (Inches)      (Hours)        Lat       Lon

...Genesee County...
   Goodrich                M  3.00           48     42.92N    83.51W
   Linden                  M  3.06           48     42.82N    83.78W
   Flint                   M  3.31           24     43.02N    83.69W
   Flint                   M  3.39           48     43.02N    83.69W
   Otisville               M  3.60           24     43.17N    83.52W
   Grand Blanc             M  3.65            M     42.93N    83.62W
   Swartz Creek            M  3.90           24     42.96N    83.83W
   S Grand Blanc           M  5.10           24     42.93N    83.62W
   3 NW Davison            M  5.92           48     43.07N    83.57W
   1 NW Atlas              M  6.05           24     42.96N    83.55W
   4 N Burton              M  6.79           48     43.05N    83.62W
   Richfield Center        M  7.05           48     43.09N    83.52W

...Huron County...
   Pointe Aux Barques      M  2.75            M     44.06N    82.96W

...Lapeer County...
   Lapeer                  M  5.53           48     43.05N    83.32W

...Lenawee County...
   Morenci                 M  1.49           48     41.72N    84.22W
   Tecumseh                M  1.74           48     42.01N    83.94W
   2 NW Tipton             M  2.35           48     42.04N    84.09W

...Livingston County...
   1 N Whitmore Lake       M  3.03           48     42.45N    83.74W
   Brighton                M  4.40            M     42.53N    83.78W

...Macomb County...
   Roseville               M  1.89           24     42.50N    82.94W
   Chesterfield            M  2.78           24     42.66N    82.84W

...Oakland County...
   Troy                    M  2.12            M     42.58N    83.14W
   2 NE Commerce           M  2.40           24     42.61N    83.45W
   Farmington              M  2.46           48     42.46N    83.38W
   4 E White Lake          M  2.72           24     42.65N    83.43W
   4 E White Lake          M  3.00           30     42.65N    83.43W
   Bloomfield Hills        M  3.00           17     42.58N    83.25W
   Farmington              M  3.00            M     42.46N    83.38W
   1 NE Lake Orion         M  3.65           48     42.79N    83.23W
   4 NW Springfield        M  3.74           12     42.80N    83.50W
   3 NW White Lake         M  3.75           13     42.69N    83.53W
   1 SE Davisburg          M  4.28           48     42.74N    83.52W

...Sanilac County...
   Lexington               M  3.33           48     43.27N    82.53W

...Shiawassee County...
   Durand                  M  2.30           48     42.91N    83.99W
   Owosso                  M  2.61           48     43.00N    84.18W

...St. Clair County...
   Marine City             M  2.05           24     42.71N    82.50W
   Algonac                 M  2.24           48     42.62N    82.53W
   1 S Pearl Beach         M  2.44           24     42.61N    82.59W
   3 W Lakeport            M  3.30           24     43.11N    82.56W

...Tuscola County...
   Vassar                  M  2.37           48     43.37N    83.58W
   Cass City               M  2.51           48     43.60N    83.18W
   Caro                    M  3.03           24     43.49N    83.40W

...Washtenaw County...
   Manchester              M  2.98           48     42.15N    84.04W
   1 S Pittsfield Township M  2.99           24     42.19N    83.72W
   3 SE Ann Arbor          M  3.33           24     42.24N    83.69W
   2 S Chelsea             M  4.00           48     42.28N    84.02W

...Wayne County...
   5 NE Detroit            M  2.54           48     42.38N    82.98W
   Southgate               M  3.35           13     42.21N    83.19W
   2 NW Detroit            M  3.38           48     42.35N    83.07W
   Wyandotte               M  3.48           48     42.21N    83.15W


M = Measured
E = Estimated

Observations are collected from a variety of sources with varying
equipment and exposures. We thank all volunteer weather observers
for their dedication. Not all data listed are considered official.
Rainfall estimates via National Water Prediction Service: water.noaa.gov
Environment
 |
 |
|
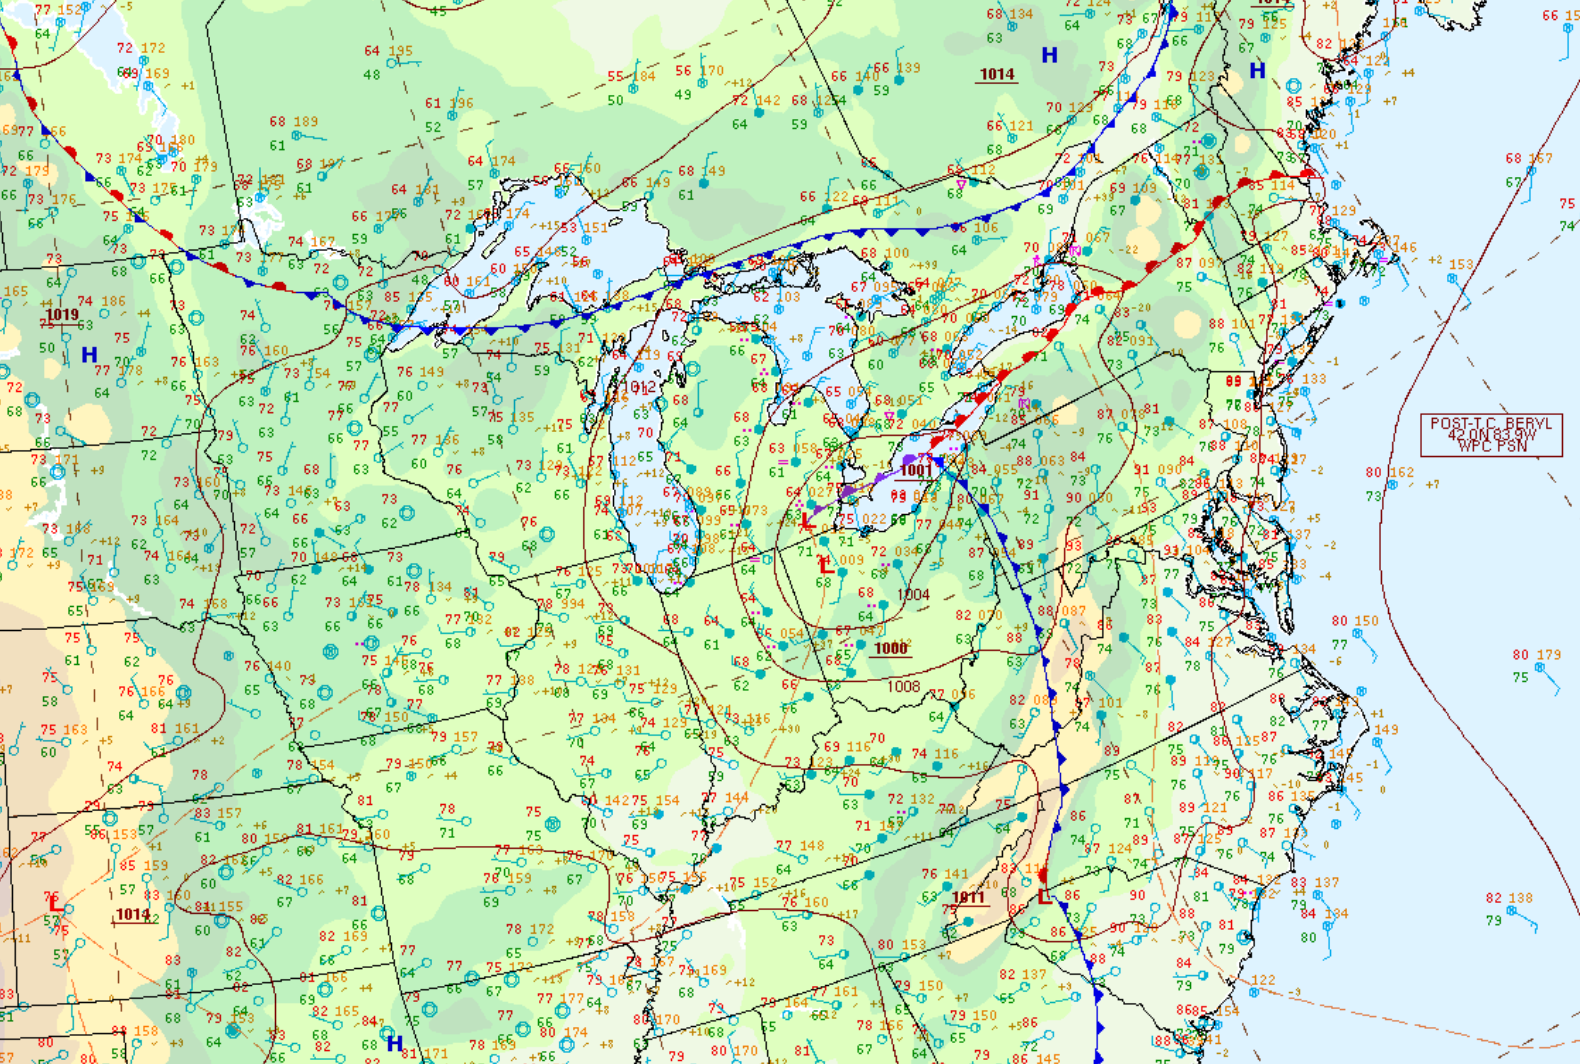
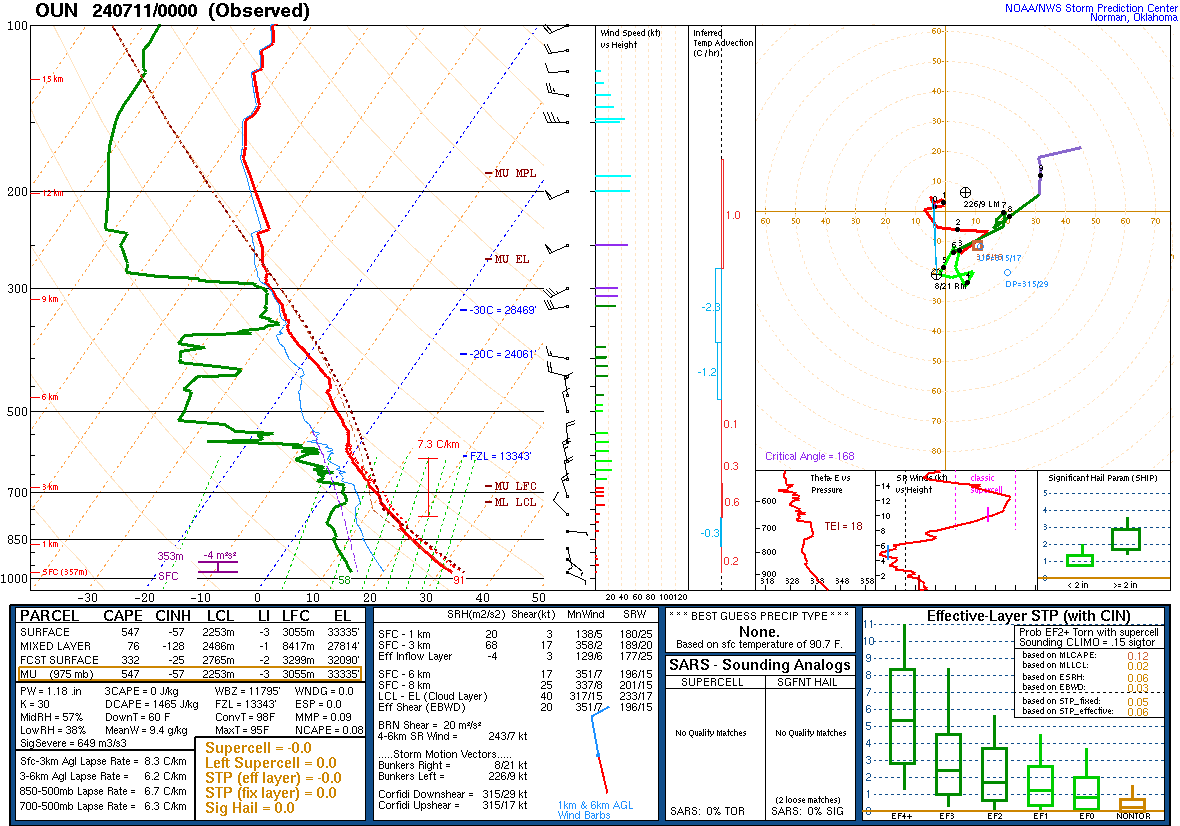
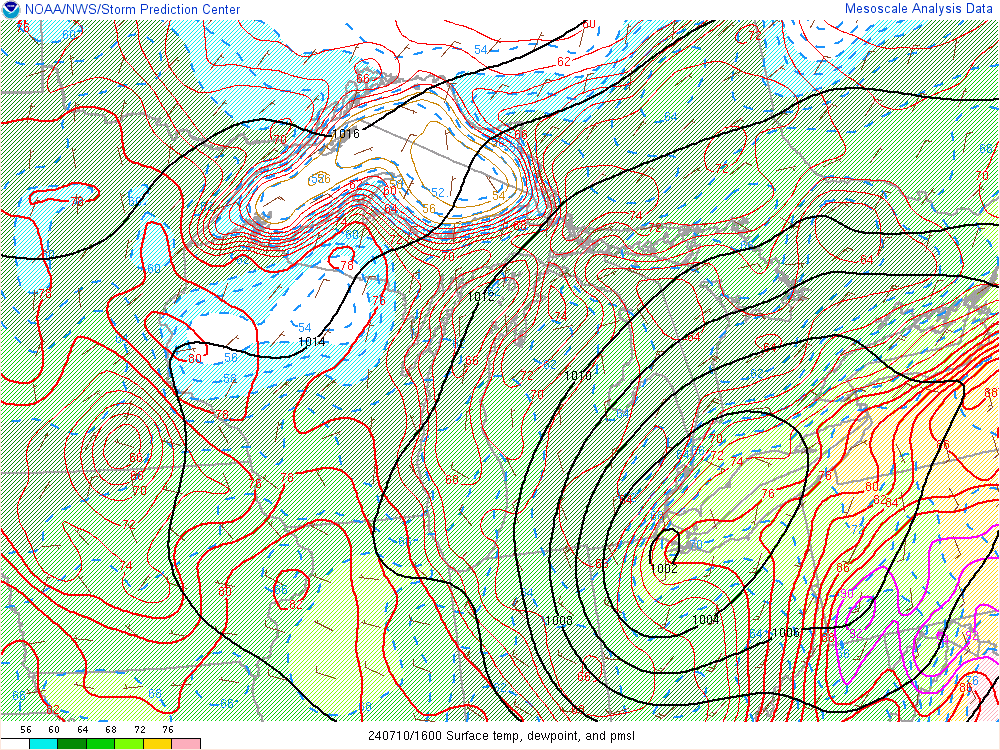
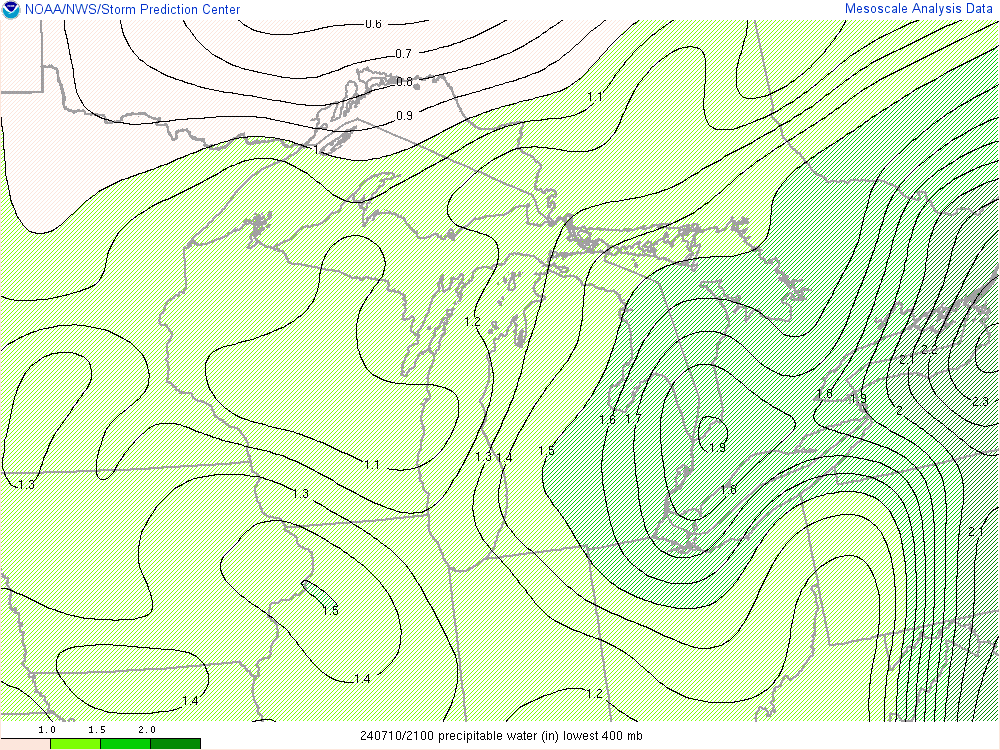
| Figure 1: WPC Surface Analysis, valid 15 UTC 10 July 2024 | Figure 2: DTX Sounding, valid 00 UTC 11 July 2024 | |
 |
 |
|
| Figure 4: Surface Temperature, Dewpoint, Pressure at Mean Sea Level, valid 16 UTC 10 July 024 | Figure 5: Precipitable Water (in) in lowest 400mb valid, 21 UTC 10 July 2024 | |
| Figure 7: 850 mb Moisture Transport valid, 19Z UTC 10 July 2024 |
 |
Media use of NWS Web News Stories is encouraged! Please acknowledge the NWS as the source of any news information accessed from this site. |
|

