Overview
|
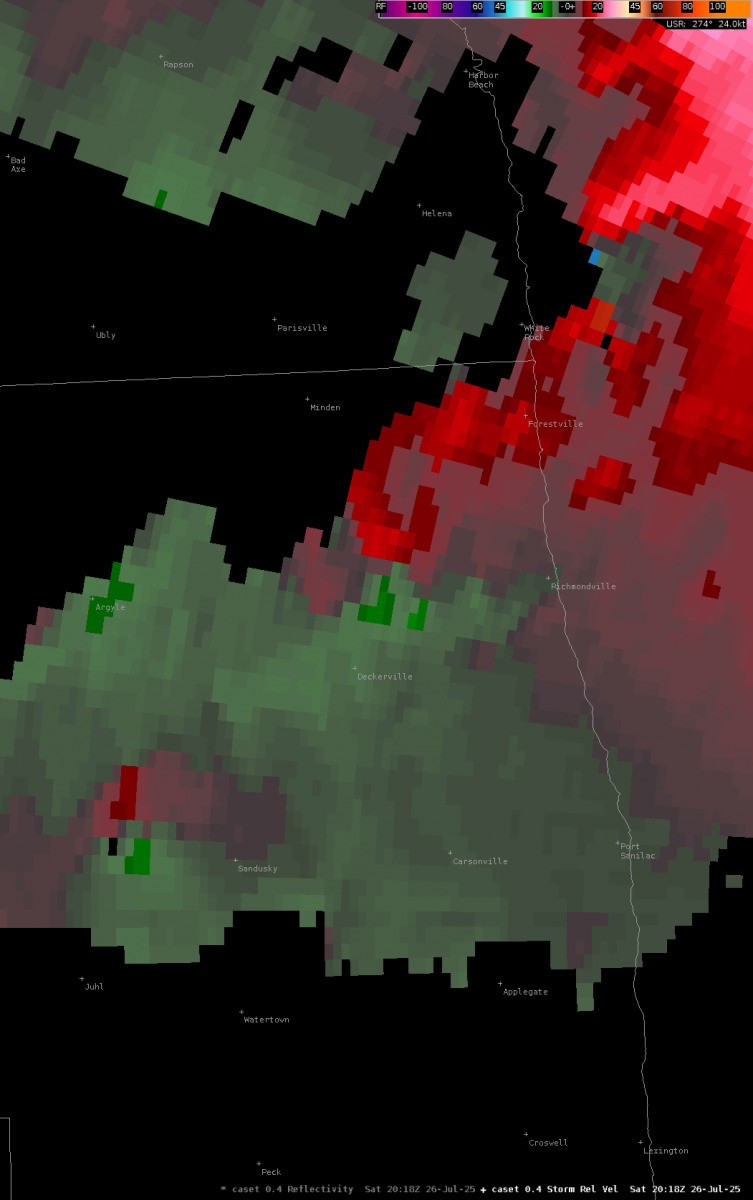
Several low-topped supercells developed along a warm front during the afternoon hours of July 26th, 2025. These cells exhibited weak mid-level rotation (rotational velocities of 20-25 knots at most), which prompted the issuance of several Special Weather Statements with "landspout possible" tags. While there were reports of wall clouds with these cells, only one produced a tornado–an EF-1 near Deckerville in Sanilac County. Radar interrogation of these cells was complicated by their distance from the radar, with the lowest scans of the KDTX radar beam at 6100 ft AGL and the CASET radar beam at 4700 ft AGL. Tornado potential was low in this setup for most of southeast Michigan given generally weak flow aloft and uniform column winds. Instability was also limited and deep convection struggled with very little lightning activity even in the tornado-producing supercell. That said, the presence of a warm front near the M-46 corridor and its intersection with the marine layer provided just enough low level curvature in the wind field for tornadogenesis. In more technical terms, the backed (southeast) flow north of the warm front/near the Lake Huron shoreline created a localized pool of streamwise vorticity that was realized as the storm moved west to east at ~35 mph into it. This is not an uncommon local phenomenon where rotation develops and/or increases as storms encounter the marine layer–we see this both near Lake Huron and Lake Erie (e.g. Detroit Beach, Luna Pier, etc.). The tornado was on the ground for roughly 3 minutes, traveled a little over 1.5 miles, and had maximum wind speeds of 95 mph. |
Tornado PNS
|
Tornado - Deckerville, MI
Track Map See new "Tornado Track" tab

|
||||||||||||||||
The Enhanced Fujita (EF) Scale classifies tornadoes into the following categories:
Tornadoes
Select a tornado from the table to zoom into the track and view more information. The default table view is limited to 8 tracks, but can be scrolled by a mouse wheel or dynamically expanded. Additionally, the table can fill the entire window by clicking the small circular expanding arrow icon at the very top right of the table and returned to its original size by clicking the button again. The side information panel that opens over the map can be closed using the "X" on the upper right corner of the pop-up. Zoom into the map and click damage points to see detailed information and pictures from the surveys.
|
NOTE: times shown below are local to your device's time zone. |

The Enhanced Fujita (EF) Scale classifies tornadoes into the following categories:
| EF0 Weak 65-85 mph |
EF1 Moderate 86-110 mph |
EF2 Significant 111-135 mph |
EF3 Severe 136-165 mph |
EF4 Extreme 166-200 mph |
EF5 Catastrophic 200+ mph |
 |
|||||
| Tornadoes that fail to impact any ratable damage indicators on the EF-Scale are rated EF-Unknown (EF-U) | |||||
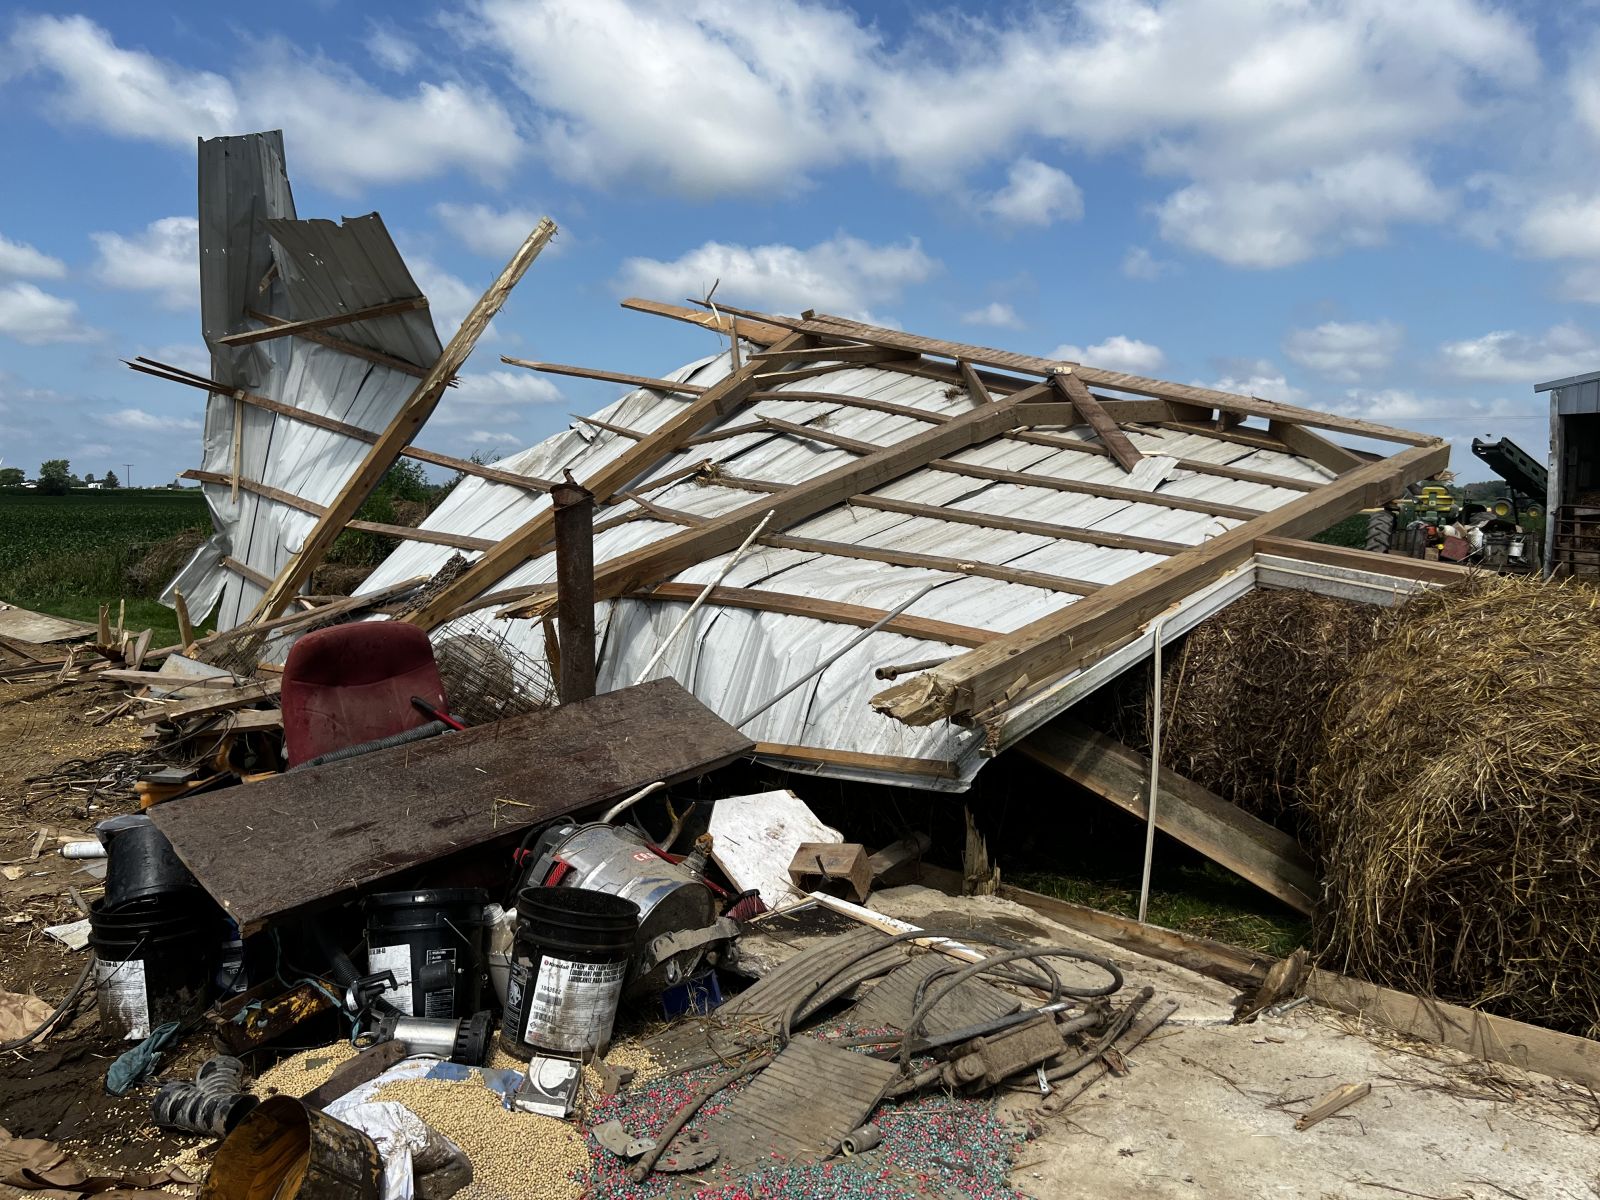
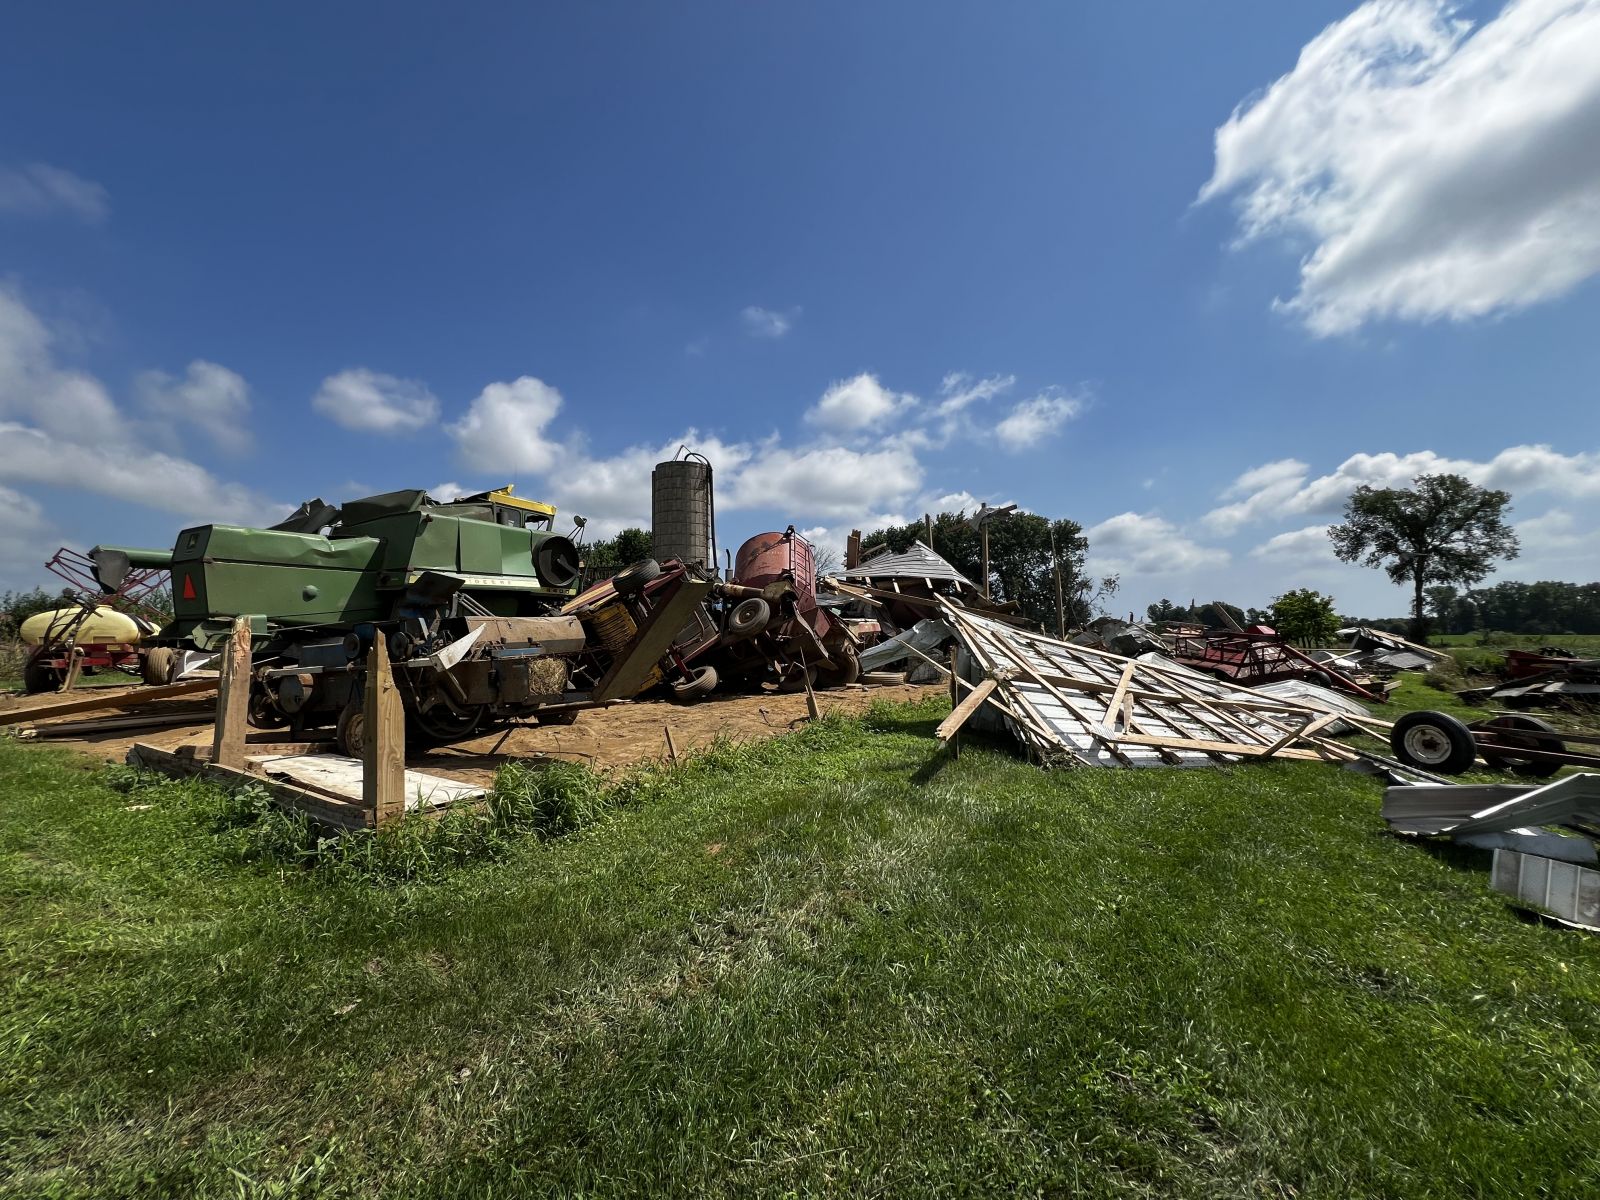
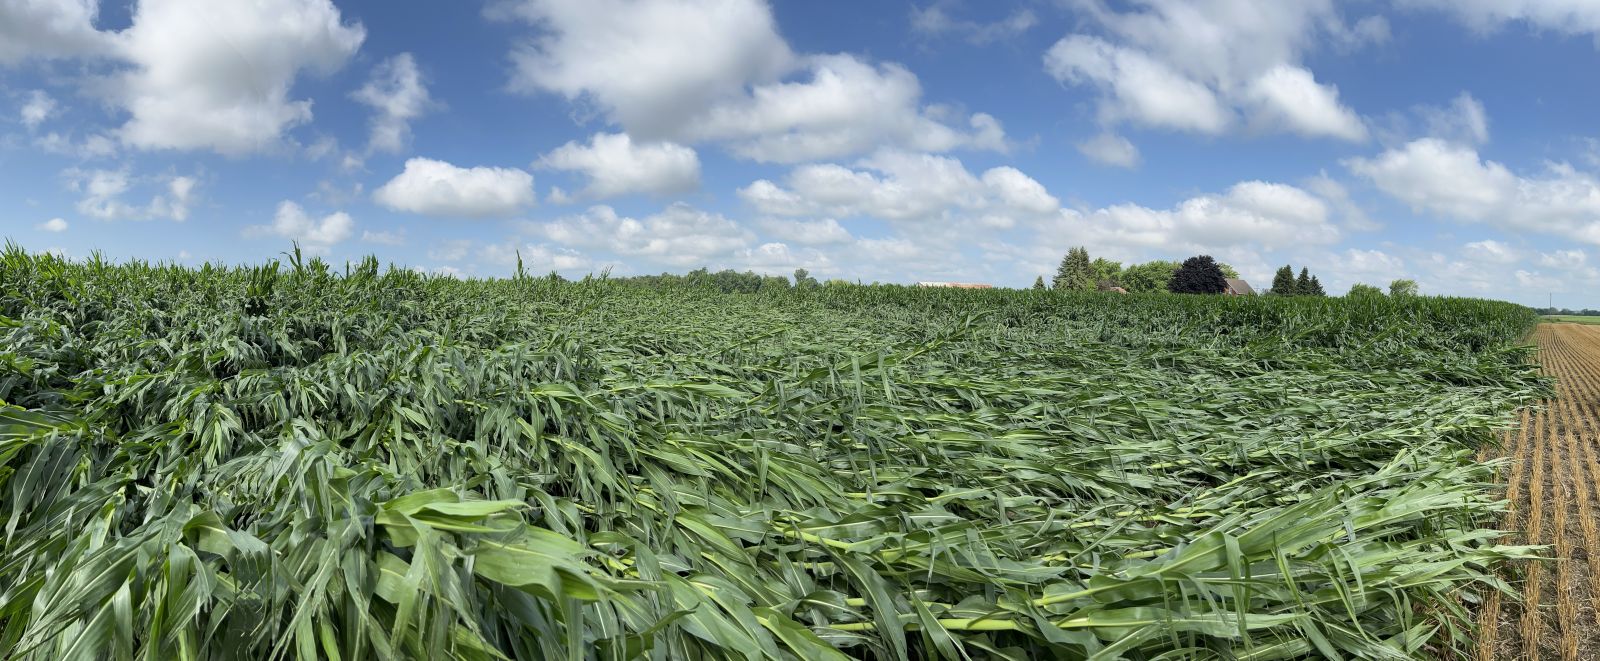
Photos & Video
 |
 |
 |
Radar
 |
 |
|
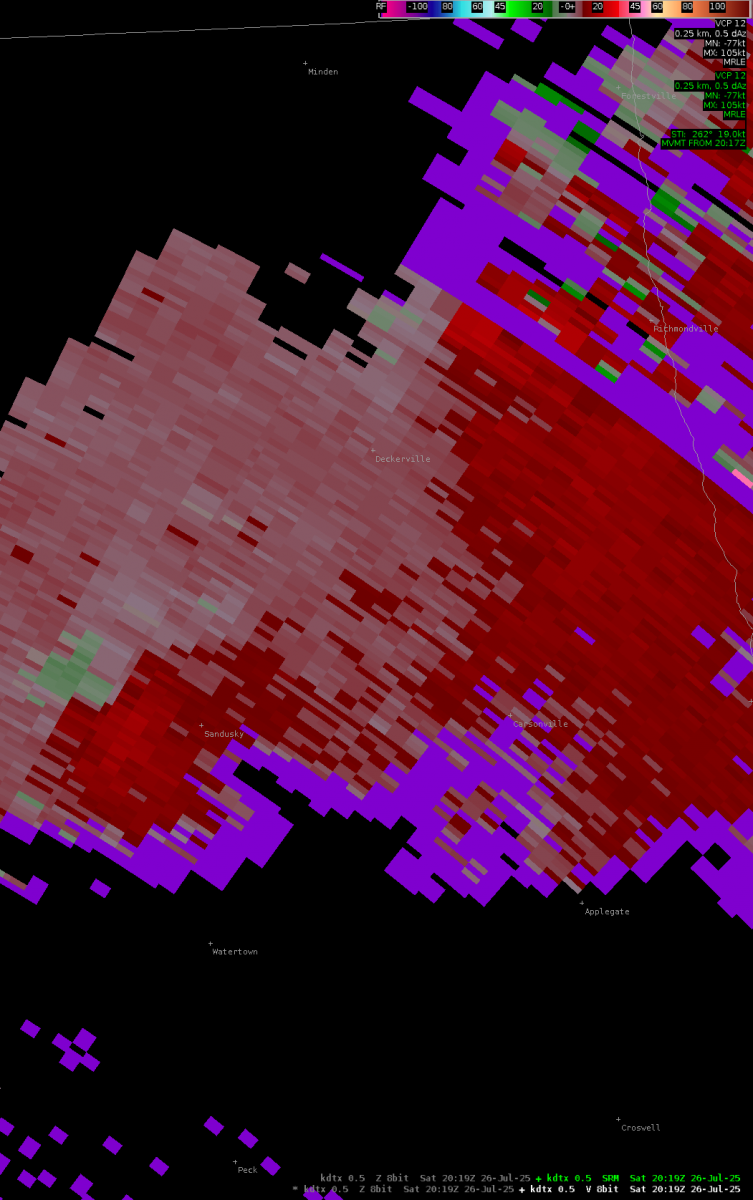
KDTX Storm-Relative Velocity Valid at 2018z (4:18 PM EDT) |
CASET Storm-Relative Velocity Valid at 2018z (4:18 PM EDT) |
 |
Media use of NWS Web News Stories is encouraged! Please acknowledge the NWS as the source of any news information accessed from this site. |
|

