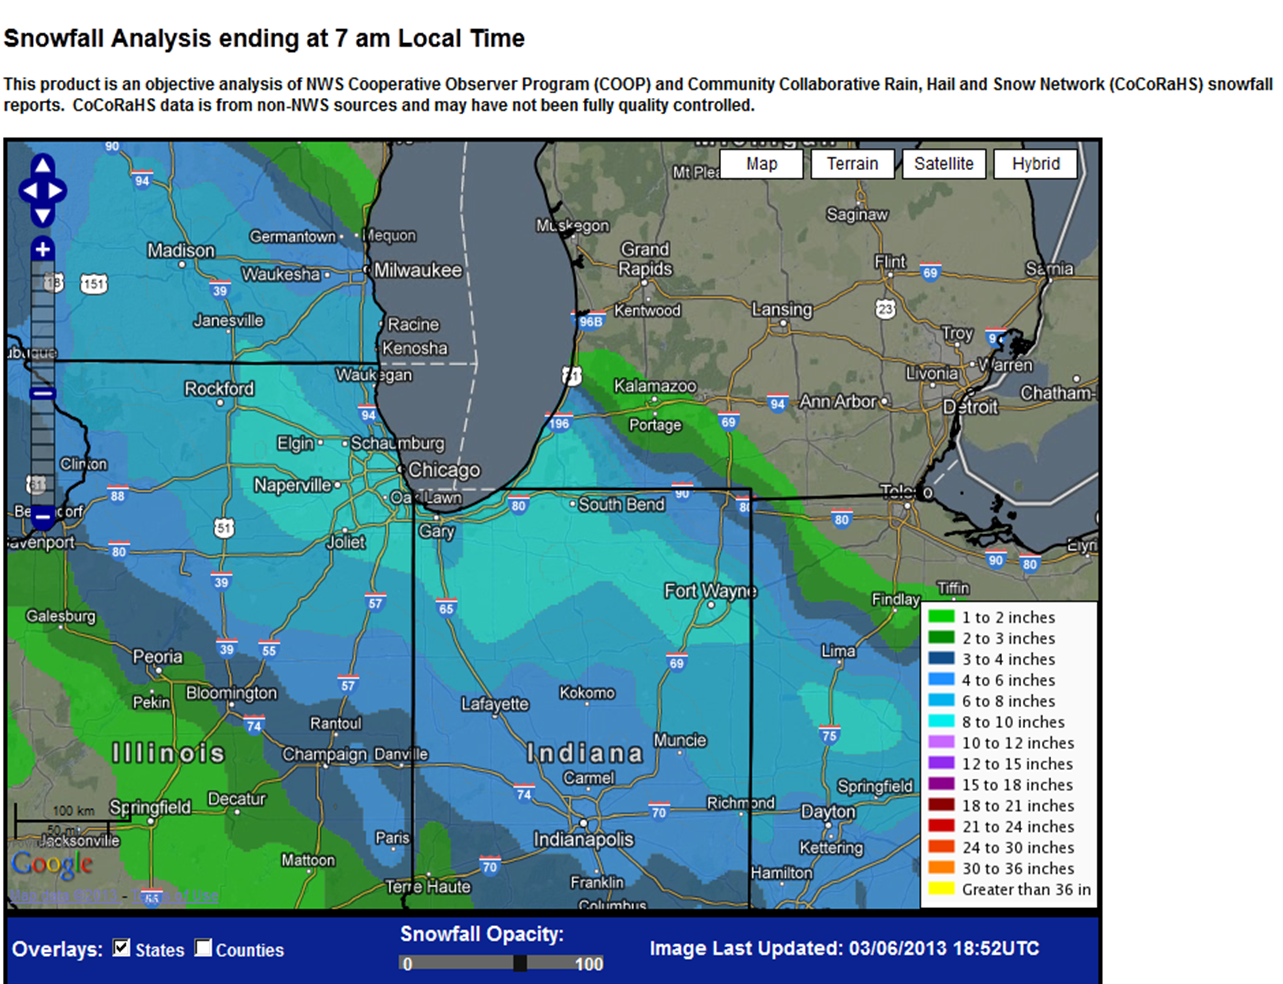
A strong low pressure system developed across the northern Plains and intensified as it moved across the Ohio Valley and middle Mississippi Valley on March 5th, 2013. Heavy snow developed across the region and impacted the local area beginning during the afternoon of March 5th and continued overnight into the early morning hours of March 6th. With 9.0 inches of snow from midnight to midnight on March 5th, Fort Wayne set a new record daily maximum snowfall. This broke the old record of 2.2 inches set in 2005.
| Surface Analysis March 5, 2013 18Z (1 pm EST) | Surface Analysis March 5, 2013 21Z (3 pm EST) |
 |
 |
| Surface Analysis March 6, 2013 00Z (7 pm EST 3/5) | Surface Analysis March 6, 2013 03Z (11 pm EST 3/5) |
 |
 |
The map below shows regional snowfall totals for the 24-hour period ending at approximately 7am March 6th.
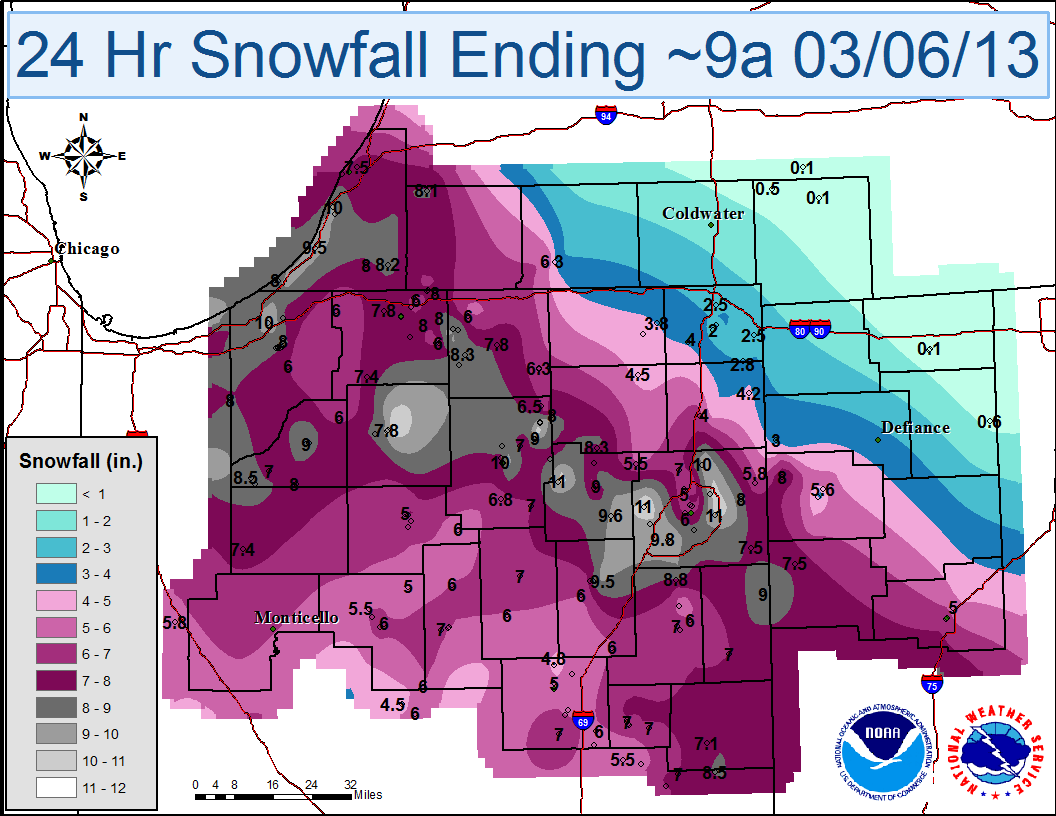
The map and table below show snowfall totals across the local area. The swath of heaviest snow was located from southern Berrien county in Michigan and northern La Porte county in Indiana, southeastward into Allen county in Indiana.
| Location | Value |
| 2 N NORTH WEBSTER (NWS OFFICE) | 11.9 |
| LEESBURG 6.7 ESE | 11.3 |
| PLYMOUTH | 11.3 |
| COLUMBIA CITY | 11.1 |
| 2 N NORTH WEBSTER | 11.0 |
| ARCOLA | 11.0 |
| LARWILL | 11.0 |
| NEW HAVEN | 11.0 |
| SAINT JOSEPH | 10.8 |
| FORT WAYNE | 10.5 |
| FORT WAYNE 7.0 NE | 10.5 |
| NE FORT WAYNE | 10.5 |
| FORT WAYNE | 10.3 |
| (N9ROM)TRAIL CREEK 4.5 ESE | 10.0 |
| (WA9RON)LA PORTE 1.3 SSW | 10.0 |
| 2 N NORTH WEBSTER | 10.0 |
| FORT WAYNE 7.1 WSW | 10.0 |
| KNOX | 10.0 |
| LEO 2.2 NW | 10.0 |
| NEW BUFFALO | 10.0 |
| STEVENSVILLE | 10.0 |
| W FORT WAYNE | 10.0 |
| WARSAW | 10.0 |
| 5 SSW OSCEOLA | 9.8 |
| FORT WAYNE ASOS | 9.8 |
| MISHAWAKA 5.9 SE | 9.8 |
| COLUMBIA CITY 6.6 SSE | 9.6 |
| COLUMBIA CITY | 9.5 |
| HUNTINGTON | 9.5 |
| SAWYER | 9.5 |
| 2 SW LA PORTE | 9.3 |
| LA PORTE 1.6 SW | 9.3 |
| 3 S LEESBURG | 9.2 |
| 2 SW NORTH WEBSTER | 9.0 |
| 5 E DECATUR | 9.0 |
| AKRON | 9.0 |
| COLUMBIA CITY | 9.0 |
| COLUMBIA CITY 0.5 NNE | 9.0 |
| FORT WAYNE | 9.0 |
| FORT WAYNE 2.6 NE | 9.0 |
| KNOX | 9.0 |
| OSSIAN | 8.8 |
| ELKHART 4.8 SW | 8.7 |
| JIMTOWN | 8.7 |
| PLYMOUTH 2.5 WSW | 8.6 |
| (KA9WNQ)LA PORTE 1.7 SW | 8.5 |
| (KB9GPW)NORTH JUDSON 3.9 SW | 8.5 |
| 5 N LA PORTE | 8.5 |
| KNOX | 8.5 |
| NORTH JUDSON 4 W | 8.5 |
| RIDGEVILLE 1 N | 8.5 |
| WAKARUSA 0.3 WSW | 8.5 |
| COLUMBIA CITY 8.4 N | 8.3 |
| WAKARUSA 2.4 NNE | 8.3 |
| 2 SW LA PORTE | 8.2 |
| FORT WAYNE 4.0 SE | 8.2 |
| NILES 2.7 W | 8.2 |
| STEVENSVILLE 1.7 SSE | 8.2 |
| DOWAGIAC 5.3 NNW | 8.1 |
| (W9AL)NORTH JUDSON 5.7 ESE | 8.0 |
| 2 SW CROMWELL | 8.0 |
| 5 N FORT WAYNE | 8.0 |
| ANTWERP | 8.0 |
| BUCHANAN 1.3 WNW | 8.0 |
| GRANGER | 8.0 |
| GRANGER | 8.0 |
| LA PORTE | 8.0 |
| MISHAWAKA | 8.0 |
| MISHAWAKA 3.9 ENE | 8.0 |
| NEW BUFFALO 0.4 WNW | 8.0 |
| NORTH JUDSON 5.7 ESE | 8.0 |
| WANATAH 2 WNW | 8.0 |
| WOODBURN 2.8 WSW | 8.0 |
| GOSHEN 1.9 NW | 7.8 |
| S PLYMOUTH | 7.8 |
| SOUTH BEND | 7.8 |
| SOUTH BEND ASOS | 7.8 |
| SOUTH BEND | 7.7 |
| 1 NNW WARSAW | 7.6 |
| GRANGER 2.9 W | 7.6 |
| (KA9VIS) HARTFORD CITY 0.7 N | 7.5 |
| (KC9KLI) ALBANY 2.8 S | 7.5 |
| 1 WSW BENTON HEIGHTS | 7.5 |
| 5 N FORT WAYNE | 7.5 |
| 5 N LA PORTE | 7.5 |
| CONVOY | 7.5 |
| LOGANSPORT 2.2 NNW | 7.5 |
| MONROEVILLE | 7.5 |
| WARSAW 1.1 NNW | 7.5 |
| FRANCESVILLE 2 SW | 7.4 |
| GRANGER 1.6 N | 7.4 |
| WALKERTON 5.7 ENE | 7.4 |
| 6 ESE NORTH JUDSON | 7.3 |
| COLUMBIA CITY 5.4 N | 7.3 |
| SOUTH BEND 4.6 SE | 7.3 |
| (KC9LQY) PORTLAND 5.4 SW | 7.1 |
| 2 NW ROCHESTER | 7.1 |
| 5 N FORT WAYNE | 7.1 |
| HUNTINGTON 0.3 W | 7.1 |
| ROCHESTER 2.4 NW | 7.1 |
| (AA9SH)LAGRO 5.2 NW | 7.0 |
| (KB9ZZG) ALBANY 2.9 E | 7.0 |
| (N9FPC) FAIRMOUNT 0.5 NE | 7.0 |
| 2 SE HUNTERTOWN | 7.0 |
| 2 WSW PERU | 7.0 |
| 5 NE WARSAW | 7.0 |
| AUBURN | 7.0 |
| BERNE 0.8 WSW | 7.0 |
| BLUFFTON | 7.0 |
| BLUFFTON 0.9 SE | 7.0 |
| HARTFORD CITY | 7.0 |
| HARTFORD CITY 0.2 NNW (WB9HLA) | 7.0 |
| HARTFORD CITY 4 ESE | 7.0 |
| KINGSBURY 0.3 WNW | 7.0 |
| NORTH JUDSON | 7.0 |
| ROCHESTER | 7.0 |
| S SIDNEY | 7.0 |
| TWELVE MILE | 7.0 |
| URBANA 0.3 ENE | 7.0 |
| BLUFFTON 1 N | 6.8 |
| CLAYPOOL 1.2 E | 6.8 |
| SAINT JOSEPH | 6.8 |
| 5 N FORT WAYNE | 6.7 |
| (N9ZMY)LOGANSPORT 0.9 E | 6.5 |
| 1 SW ROCHESTER | 6.5 |
| AUBURN | 6.5 |
| LIMA | 6.5 |
| PERU | 6.5 |
| SYRACUSE 3.0 ESE | 6.5 |
| (KC9CGY) HARTFORD CITY 0.5 SSE | 6.3 |
| 1 SW MILLERSBURG | 6.3 |
| 2 N NORTH WEBSTER | 6.3 |
| MILLERSBURG 0.5 SW | 6.3 |
| 5 N MARION | 6.1 |
| (KC9IYD)KOKOMO 4.0 WNW | 6.0 |
| (WA9QGL)ANDREWS 3.2 ESE | 6.0 |
| (WA9TTB)GALVESTON 1.0 ESE | 6.0 |
| 2 E GEORGETOWN | 6.0 |
| 2 SE GEORGETOWN | 6.0 |
| 5 N FORT WAYNE | 6.0 |
| 5 SSW OSCEOLA | 6.0 |
| AKRON | 6.0 |
| BLUFFTON 3.0 ENE | 6.0 |
| COLUMBIA CITY | 6.0 |
| CONSTANTINE | 6.0 |
| DENVER 1.3 NE | 6.0 |
| E ELKHART | 6.0 |
| FORT WAYNE | 6.0 |
| GROVERTOWN | 6.0 |
| KINGSBURY 1 N | 6.0 |
| LOGANSPORT 1.7 ENE | 6.0 |
| NEW CARLISLE | 6.0 |
| UPLAND 2.4 SSE | 6.0 |
| WABASH 1.5 SW | 6.0 |
| WARREN | 6.0 |
| 2 W GRANGER | 5.9 |
| REMINGTON 0.3 N | 5.8 |
| WOODBURN 3 N | 5.8 |
| (KB9CRA)GAS CITY 0.3 N | 5.7 |
| 3 NE FORT WAYNE | 5.7 |
| PAULDING | 5.6 |
| (K9EQT)LOGANSPORT 3.9 NNW | 5.5 |
| (KB9TUZ) EATON 1.9 W | 5.5 |
| (N9WCJ) EATON 1.8 ESE | 5.5 |
| CHURUBUSCO | 5.5 |
| E ELKHART | 5.5 |
| GAS CITY 0.9 SW | 5.5 |
| BLUFFTON | 5.4 |
| AKRON | 5.3 |
| MARION 5.6 NE | 5.2 |
| (KA9FDN) MATTHEWS 0.4 WNW | 5.0 |
| 2 NW ROCHESTER | 5.0 |
| 5 N FORT WAYNE | 5.0 |
| LIMA 2.7 NE | 5.0 |
| MARION 2 N | 5.0 |
| TWELVE MILE | 5.0 |
| 5 N MARION | 4.8 |
| KENDALLVILLE 4.5 NW | 4.5 |
| KOKOMO 7.2 WNW | 4.5 |
| LAGRANGE 7.2 ESE | 4.5 |
| PERU | 4.5 |
| BUTLER 0.5 NNE | 4.2 |
| AUBURN 0.8 NE | 4.0 |
| HUDSON 4.6 N | 4.0 |
| ANGOLA | 3.8 |
| BLUFFTON 4.1 N | 3.8 |
| LAGRANGE 9.9 E | 3.8 |
| HUDSON 4.1 NNW | 3.7 |
| PAULDING | 3.3 |
| CONSTANTINE 1.9 E | 3.0 |
| HICKSVILLE | 3.0 |
| HAMILTON 1.7 E | 2.8 |
| ANGOLA 4.1 N | 2.5 |
| ANGOLA 8.7 ESE | 2.5 |
| ANGOLA 1.2 S | 2.0 |
Data sources: CoCoRaHS, Cooperative Observers, Emergency Management, Spotters and ASOS
Here's a look at some historical snowfall statistics for Fort Wayne and South Bend.
Greatest 2 Day Snowfall Totals
Fort Wayne Area (ThreadEx Station)
Extremes
Highest Total Snowfall inches
Days: 10/1 - 5/31
Length of period: 2 days
Years: 1912-2013
Rank Value Ending Date
1 14.3 3/11/1964
2 14.0 12/20/1973
3 13.6 3/10/1964
4 12.5 3/17/1973
5 11.1 1/31/1982
6 10.8 2/ 1/1982, 12/19/1973
8 10.1 1/26/1978, 12/ 9/1914
10 9.6 3/ 5/2013
11 9.5 3/18/1973
FWA 2 Day total 10.4 inches 3/5-3/6
South Bend Area (ThreadEx Station)
Extremes
Highest Total Snowfall inches
Days: 10/1 - 5/31
Length of period: 2 days
Years: 1912-2013
Rank Value Ending Date
1 36.6 1/ 8/2011
2 26.1 1/ 9/2011
3 21.2 1/26/1978
4 20.5 11/26/1977
5 20.0 4/ 5/1920
6 19.3 1/ 9/1978
7 18.8 2/15/1991
8 18.4 2/23/1993, 1/27/1978
10 18.3 1/ 2/1999
SBN 2 Day total 7.8 inches 3/5-3/6
---------------------------------------------------------------
Greatest 1 Day Snowfall Totals
Fort Wayne Area (ThreadEx Station)
Extremes
Highest Daily Snowfall inches
Days: 10/1 - 5/31
Length of period: 1 day
Years: 1912-2013
Rank Value Ending Date
1 12.6 3/10/1964
2 10.8 1/31/1982, 12/19/1973
4 9.5 3/17/1973
5 9.0 3/ 5/2013
6 8.8 3/11/2000
7 8.3 12/ 8/2005
8 8.2 1/19/1987
9 8.1 12/23/2004
10 7.7 2/ 6/1952
FWA 1 Day total 9.0 inches 3/5
South Bend Area (ThreadEx Station)
Extremes
Highest Daily Snowfall inches
Days: 10/1 - 5/31
Length of period: 1 day
Years: 1912-2013
Rank Value Ending Date
1 26.0 1/ 8/2011
2 15.6 1/26/1978
3 15.4 1/ 2/1999
4 15.0 1/16/1959
5 14.6 11/25/1977
6 13.5 1/13/1979
7 12.8 1/26/1967
8 12.2 3/ 9/1998
9 12.0 1/ 1/1929, 4/ 5/1920
11 11.5 2/15/1991
12 11.4 1/ 9/1978
13 10.9 12/19/1973
14 10.6 1/ 7/2011
SBN 1 Day total 7.7 inches 3/5
-------------------------------------------------------------------
Greatest 2 Day Totals in March
Fort Wayne Area (ThreadEx Station)
Extremes
Highest Total Snowfall inches
Days: 3/1 - 3/31
Length of period: 2 days
Years: 1912-2013
Rank Value Ending Date
1 14.3 3/11/1964
2 13.6 3/10/1964
3 12.5 3/17/1973
4 10.4 3/ 6/2013
5 9.5 3/18/1973
6 8.8 3/12/2000, 3/11/2000
9 7.6 3/12/1950
10 7.1 3/ 9/1999
FWA 2 Day total 10.4 inches 3/5-3/6
South Bend Area (ThreadEx Station)
Extremes
Highest Total Snowfall inches
Days: 3/1 - 3/31
Length of period: 2 days
Years: 1912-2013
Rank Value Ending Date
1 16.2 3/ 5/1960
2 12.2 3/10/1998 (1), 3/ 9/1998
4 12.0 3/27/1934, 3/26/1930
6 11.0 3/ 4/1960
7 10.0 3/ 8/1931
8 9.6 3/21/1983, 3/ 3/1975
10 9.1 3/ 6/1960
11 9.0 3/22/1932, 3/27/1930
13 8.6 3/15/1988, 3/14/1988
15 8.1 3/ 6/1999
16 8.0 3/27/1913
17 7.9 3/ 2/1975, 3/26/1970
19 7.8 3/ 6/2013
21 7.3 3/11/1992
SBN 2 Day total 7.8 inches 3/5-3/6
-----------------------------------------------------------------------
Greatest 1 Day totals in March
Fort Wayne Area (ThreadEx Station)
Extremes
Highest Daily Snowfall inches
Days: 3/1 - 3/31
Length of period: 1 day
Years: 1912-2013
Rank Value Ending Date
1 12.6 3/10/1964
2 9.5 3/17/1973
3 9.0 3/ 5/2013
4 8.8 3/11/2000
5 5.8 3/12/1950
6 5.6 3/ 8/1984, 3/11/1948
FWA 1 Day total 9.0 inches 3/5
South Bend Area (ThreadEx Station)
Extremes
Highest Daily Snowfall inches
Days: 3/1 - 3/31
Length of period: 1 day
Years: 1912-2013
Rank Value Ending Date
1 12.2 3/ 9/1998
2 9.0 3/ 5/1960
3 8.0 3/26/1930
4 7.7 3/ 5/2013
5 7.2 3/ 4/1960
6 7.1 3/ 2/1975
7 7.0 3/26/1934
8 6.9 3/14/1988
9 6.0 3/18/1931, 3/ 7/1931, 3/30/1928, 3/26/1913
SBN 1 Day total 7.7 inches 3/5
CEO/SLL

