How Often Does a White Christmas Occur in Our Area?
|
Overview
Will we have a white Christmas this year? Will it snow on Christmas day? What is the official definition of a white Christmas? These are just a few questions we are asked this time of year in anticipation of a storybook Christmas morning. Many people hope to awake and find fresh new snow on the ground and large snowflakes falling from the sky. But how often does this actually happen on Christmas day?
We have compiled Christmas day statistics for 5 different climate stations around our local area to help answer these questions. You can pick the location closest to you and see what the odds are of having a white Christmas based on previous years, or what we call climatology. We have included statistics on temperature, precipitation, snowfall and snow depth from as early as 1900 to present.
We have also included a map and link to a website with more locations and Christmas Day statistics from around the United States. The statistics in that article use the latest Climate Normals from the National Centers for Environmental Information (NCEI). Therefore, the values will differ from those show on unofficial data tables below.
|
|
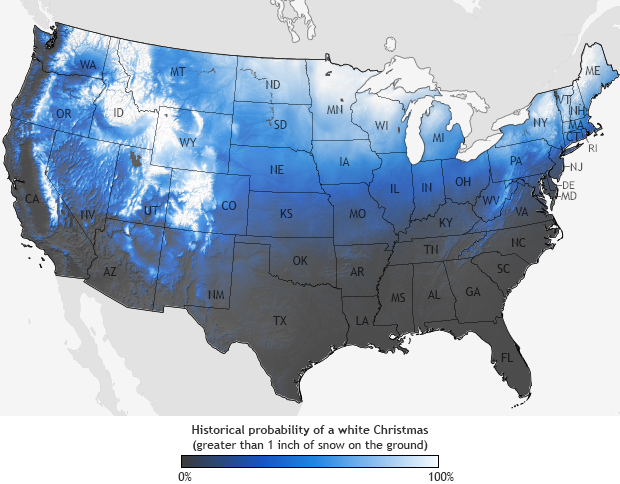
Historical Probability of a White Christmas Across the United States
A white Christmas is officially defined as having at least 1 inch of snow on the ground at 7 am local time Christmas Day. This is called snow depth. Official snow depth measurements are taken at this time around the United States at official climate observing stations (approximately 9,800 stations). This data is then used to "fill in the gaps" around the country. Below is a map from the National Centers for Environmental Information (NCEI) which shows the official historical probability of seeing a 1 inch snow depth on Christmas morning, officially making it a "White Christmas". Dark gray/blue shows places where the probability is less than 10 percent, while white shows probabilities greater than 90 percent. Probabilities are based on the latest Climate Normals.
Interactive map: Are you dreaming of a white Christmas?
|
|
Benton Harbor Michigan Christmas Day Climatology
1900-2022
| Maximum Temperature |
| Maximum |
Average |
Minimum |
Percent of Years |
| >=100° F |
>=90° F |
>=50° F |
<=32° F |
| 66 |
34.1 |
7 |
0 |
0 |
6% |
41% |
| Minimum Temperature |
| Maximum |
Average |
Minimum |
Percent of Years |
| >=70° F |
>=50° F |
<=32° F |
<=0° F |
| 52 |
21.4 |
-2 |
0 |
1% |
83% |
2% |
| Precipitation |
| Maximum |
Average |
Minimum |
Percent of Years |
| >=0.01 inch |
>=0.10 inch |
>=0.50 inch |
>=1.00 inch |
| 1.40 |
0.13 |
0 |
44% |
30% |
7% |
2% |
| Snowfall |
| Maximum |
Average |
Minimum |
Percent of Years |
| >=0.1 inch |
>=1.0 inch |
>=3.0 inches |
>=6.0 inches |
| 7 |
0.9 |
0 |
30% |
25% |
13% |
4% |
| Snow Depth |
| Maximum |
Average |
Minimum |
Percent of Years |
| >=1 inch |
>=3 inches |
>=6 inches |
>=12 inches |
| 68 |
3.5 |
0 |
52% |
34% |
19% |
5% |
Coldwater Michigan Christmas Day Climatology
1900-2022
| Maximum Temperature |
| Maximum |
Average |
Minimum |
Percent of Years |
| >=100° F |
>=90° F |
>=50° F |
<=32° F |
| 67 |
32.1 |
0 |
0 |
0 |
6% |
48% |
| Minimum Temperature |
| Maximum |
Average |
Minimum |
Percent of Years |
| >=70° F |
>=50° F |
<=32° F |
<=0° F |
| 44 |
18.4 |
-14 |
0 |
0 |
94% |
9% |
| Precipitation |
| Maximum |
Average |
Minimum |
Percent of Years |
| >=0.01 inch |
>=0.10 inch |
>=0.50 inch |
>=1.00 inch |
| 0.70 |
0.08 |
0 |
43% |
21% |
5% |
0 |
| Snowfall |
| Maximum |
Average |
Minimum |
Percent of Years |
| >=0.1 inch |
>=1.0 inch |
>=3.0 inches |
>=6.0 inches |
| 6 |
0.5 |
0 |
26% |
19% |
6% |
1% |
| Snow Depth |
| Maximum |
Average |
Minimum |
Percent of Years |
| >=1 inch |
>=3 inches |
>=6 inches |
>=12 inches |
| 10 |
2 |
0 |
51% |
31% |
12% |
0% |
South Bend Indiana Christmas Day Climatology
1900-2022
| Maximum Temperature |
| Maximum |
Average |
Minimum |
Percent of Years |
| >=100° F |
>=90° F |
>=50° F |
<=32° F |
| 65 |
32.4 |
-3 |
0 |
0 |
4% |
48% |
| Minimum Temperature |
| Maximum |
Average |
Minimum |
Percent of Years |
| >=70° F |
>=50° F |
<=32° F |
<=0° F |
| 40 |
19.3 |
-13 |
0 |
0 |
89% |
4% |
| Precipitation |
| Maximum |
Average |
Minimum |
Percent of Years |
| >=0.01 inch |
>=0.10 inch |
>=0.50 inch |
>=1.00 inch |
| 0.69 |
0.10 |
0 |
47% |
25%
|
4% |
0 |
| Snowfall |
| Maximum |
Average |
Minimum |
Percent of Years |
| >=0.1 inch |
>=1.0 inch |
>=3.0 inches |
>=6.0 inches |
| 11.8 |
0.9 |
0 |
35% |
21% |
9% |
2% |
| Snow Depth |
| Maximum |
Average |
Minimum |
Percent of Years |
| >=1 inch |
>=3 inches |
>=6 inches |
>=12 inches |
| 16 |
3.0 |
0 |
43% |
25% |
16% |
2% |
Fort Wayne Indiana Christmas Day Climatology
1900-2022
| Maximum Temperature |
| Maximum |
Average |
Minimum |
Percent of Years |
| >=100° F |
>=90° F |
>=50° F |
<=32° F |
| 64 |
33.2 |
-3 |
0 |
0 |
7% |
49% |
| Minimum Temperature |
| Maximum |
Average |
Minimum |
Percent of Years |
| >=70° F |
>=50° F |
<=32° F |
<=0° F |
| 47 |
19.6 |
-15 |
0 |
0 |
90% |
5% |
| Precipitation |
| Maximum |
Average |
Minimum |
Percent of Years |
| >=0.01 inch |
>=0.10 inch |
>=0.50 inch |
>=1.00 inch |
| 1.03 |
0.12 |
0 |
39% |
20% |
7% |
2% |
| Snowfall |
| Maximum |
Average |
Minimum |
Percent of Years |
| >=0.1 inch |
>=1.0 inch |
>=3.0 inches |
>=6.0 inches |
| 11 |
0.6 |
0 |
28% |
13% |
4% |
2% |
| Snow Depth |
| Maximum |
Average |
Minimum |
Percent of Years |
| >=1 inch |
>=3 inches |
>=6 inches |
>=12 inches |
| 11 |
1.8 |
0 |
38% |
22% |
11% |
0 |
Pandora Ohio Christmas Day Climatology
1949-2022
| Maximum Temperature |
| Maximum |
Average |
Minimum |
Percent of Years |
| >=100° F |
>=90° F |
>=50° F |
<=32° F |
| 64 |
33.7 |
-3 |
0 |
0 |
11% |
46% |
| Minimum Temperature |
| Maximum |
Average |
Minimum |
Percent of Years |
| >=70° F |
>=50° F |
<=32° F |
<=0° F |
| 49 |
19.9 |
-14 |
0 |
0 |
88% |
7% |
| Precipitation |
| Maximum |
Average |
Minimum |
Percent of Years |
| >=0.01 inch |
>=0.10 inch |
>=0.50 inch |
>=1.00 inch |
| 0.75 |
0.10 |
0 |
43% |
20% |
4% |
0 |
| Snowfall |
| Maximum |
Average |
Minimum |
Percent of Years |
| >=0.1 inch |
>=1.0 inch |
>=3.0 inches |
>=6.0 inches |
| 4.2 |
0.3 |
0 |
23% |
7% |
1% |
0 |
| Snow Depth |
| Maximum |
Average |
Minimum |
Percent of Years |
| >=1 inch |
>=3 inches |
>=6 inches |
>=12 inches |
| 9 |
1.4 |
0 |
38% |
20% |
7% |
0 |
Last Updated 12/13/2023
Brown
|

