Summary
Prototype a new Image4anis.php that displays GFS information through Openlayers rather than the static gif images currently shown on the MAG Application
Objective is to have the same look and feel as the current MAG Application, with the added functionality that Openlayers offers such as zooming in and out, panning, etc.
Added additional features such as exporting the view to PDF/PNG based on the users view.
Similar to the ERMA Application
This added functionality is located in a separate .js file as an added plugin that can easily be loaded into the core functionality.
What is unchanged
Index.php is the landing page. This is exactly the same as the existing web pages.
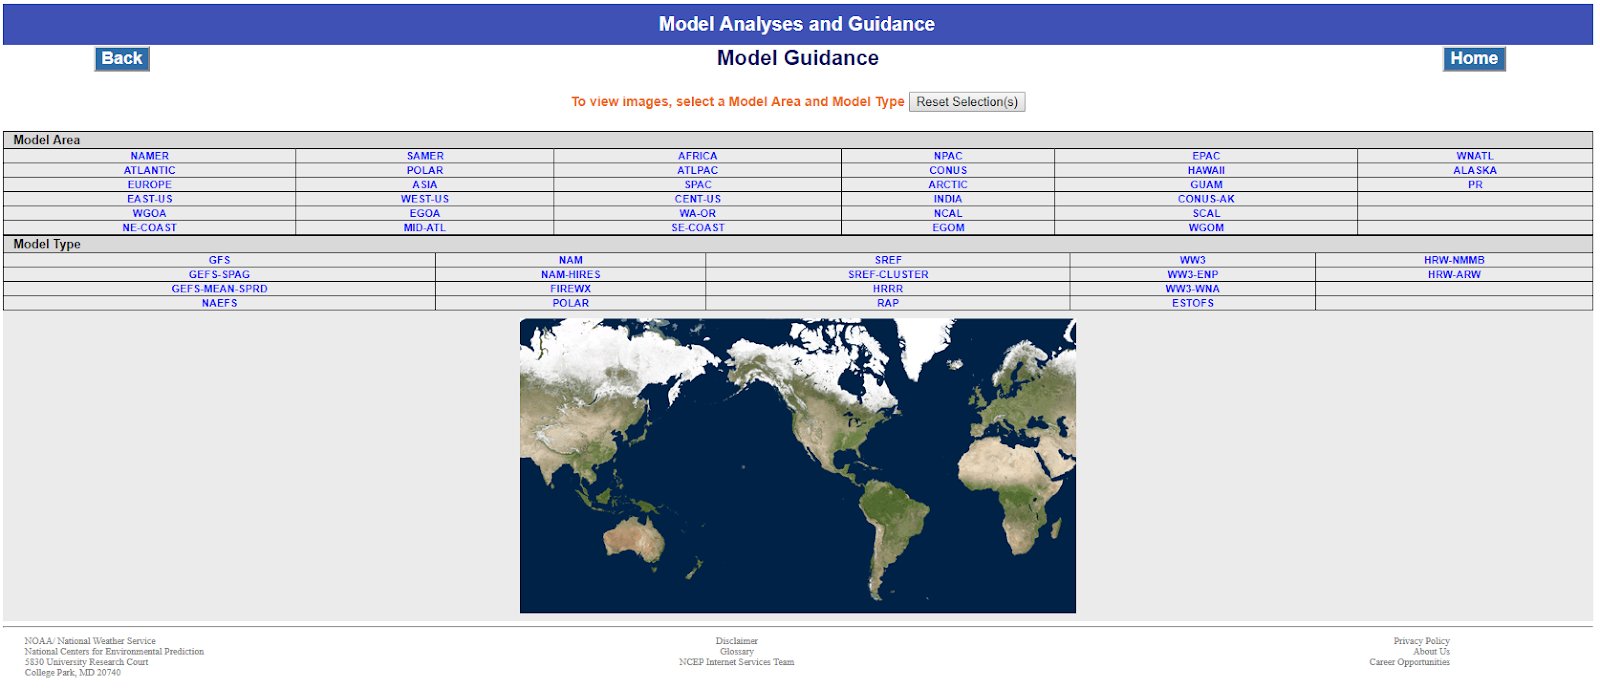
When clicking on “Model Guidance” you land on model-guidance-area.php. This again, is the same as the existing web pages.
Next, if when picking NAMER and GFS, the landing is the following URL:
model-guidance-model-parameter.php?group=Model%20Guidance&model=GFS&area=NAMER&ps=model
Which gives the following webpage:
What has changed
This marks the beginning of our development and prototyping.
When clicking on one of the Four Panel Display parameters, a php containing the forecast hours table is displayed.
When clicking on one of these hours, Image4anis.php is returned.
Note: Image4anis.php is the name of the php that is called on the existing MAG Application. However, this is a different php file that we have prototyped which highlights the new features.
Image4anis.php - The Model Data Viewer
The prototyped version of Image4anis.php contains a set of javascript functions. The operational version of Image4anis.php references a group of pre-generated gif images that can be displayed individually or as a looped sequence of gif images.
Visualization of images using Openlayers within Imageanis4.php
This prototype makes use of Openlayers, which creates the maps and layers as variables. The reason for this is to add the functionality that Openlayers offers, such as zooming in/out and panning. In addition, Openlayers provides a direct connection from Geoserver to the javascript based web application. This promotes the concept of core + plugin model strategy.
A layer variable will make a ImageWMS call to geoserver to return the layer of interest. This layer call includes the layer name and the time.
The map variable contains layer arguments and a view argument. Then each map contains a function which will handle the annotations on each map.
In addition, as the map resolution changes, a wms call is made to update the parameter to a different style layer descriptor for the purpose drawing more contours as you zoom in (this is seen on the surface pressure layer).
Legend Creation functionality using Javascript
Initially tested Style Layer Descriptors (SLDs) for legend creation.
GetLegendGraphic Request from Geoserver returned an Image. However, it returned a legend that contained every numerical value and color value from the SLD. This is generated from existing NDFD color palettes that contain hundreds of predetermined colors. Therefore, the returned graphic would be too long in height for use. Explored a way to abbreviate the Legend Graphic, but have not found a solution.
Currently, the legend is created within the javascript as well. Based on a minimum and maximum value in addition to a list of colors, a legend is created on the fly that matches the colors associated with the layer.
Looping functionality using Javascript
For the looping speed to change immediately, there is a timer function in the Javascript which will use a callback to change the speed immediately as the loop is running.
A function called “cycle” will drive the updating of the layers, times, and labels.
Now, a series of functions taken directly from the existing MAG application (located in https://mag.ncep.noaa.gov/js/mag_loop4.js) which controls all of the looping controls.
Saving Functionality (PDF or PNG) using Javascript
Ability to save the user’s view as a PNG or PDF and download within the browser
This all occurs in the saveas(option) function where the option argument is either a pdf or png.
The approach is to convert different html elements to javascript canvas elements using html2canvas.
We can rearrange any of those elements on the canvas so the footer that you see can be moved, we can add a header or any other annotation.
Once the canvas is arranged, we export to PDF using jsPDF.
The export to PNG is achieved by converting the canvas element to a DataURL which is exported as a PNG in an automated download.
Raster/Grib file Postprocessing for derived weather parameters
Goal: Treat these as a series of plugins to the core (thickness, total precip, others)
Python script calculates 1000-500 mb, 1000-850 mb and 850-700 mb thickness.
The python script takes two arguments; the grib file and the desired thickness parameter.
The output is grib2, and is powered by eccodes and numpy.
Next steps
With the ability to call the postprocessing for derived weather parameters from the prototyped MAG application, we now want to be able to send the derived parameter (grib2) to geoserver to create the layer to be used in Openlayers.