
Dangerous heat will expand from the Gulf Coast into the Southern Plains and Desert Southwest through week's end. Additional extreme heat impacting the Pacific Northwest will shift to the northern Plains by the weekend. Tropical Storm Bertha is expected to continue to impact portions of the northern Gulf Coast from the western Florida Panhandle to southeastern Louisiana through tonight. Read More >
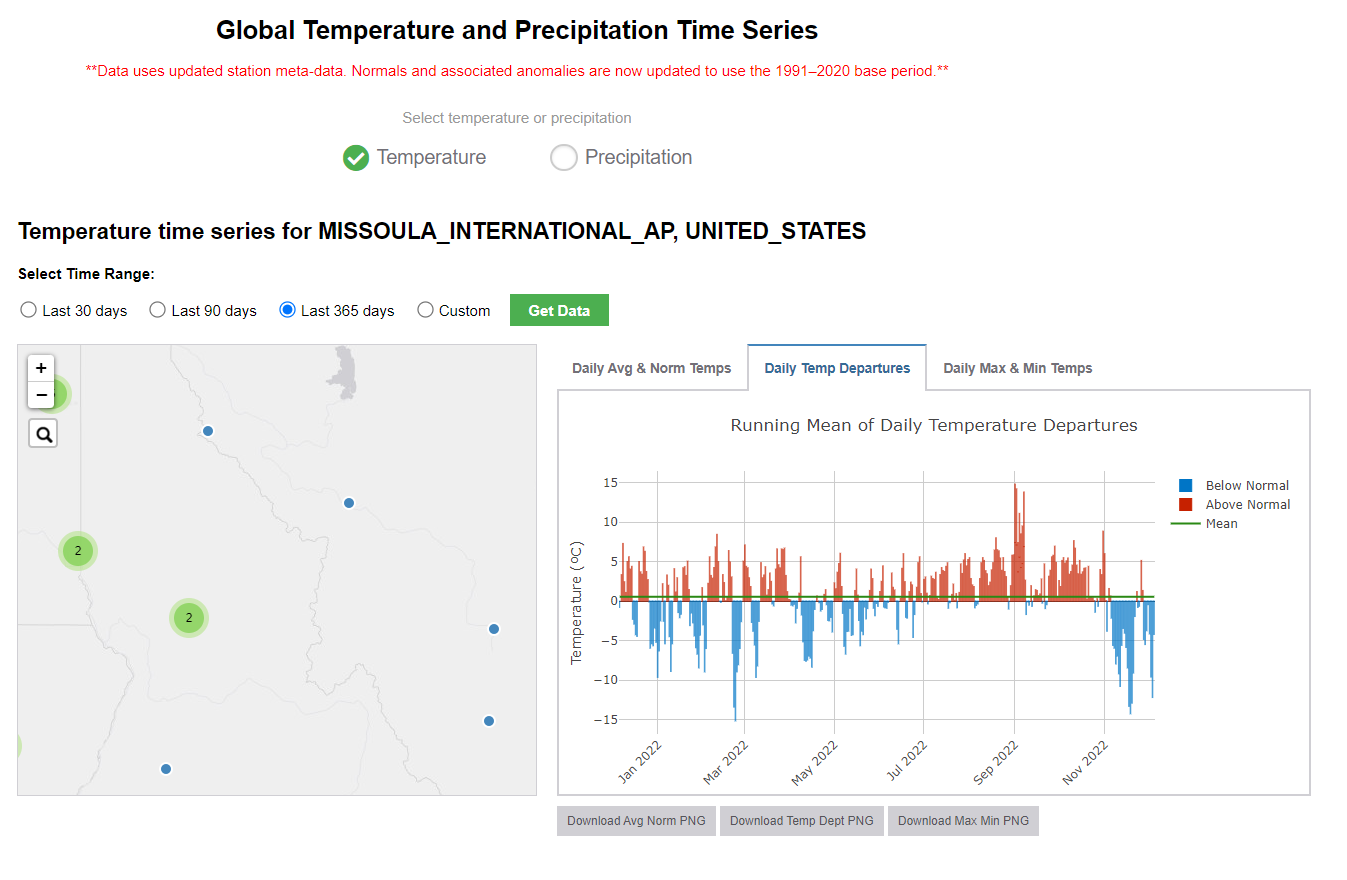
| Temperature Graphs of daily average temperatures, their departures from normal, as well as daily maximum and daily minimum temperatures over the past 30, 90, and 365 days. Shading reflects daily departures from normal using standard convention: red for warmer than normal, blue for colder than normal. |
||
 |
||
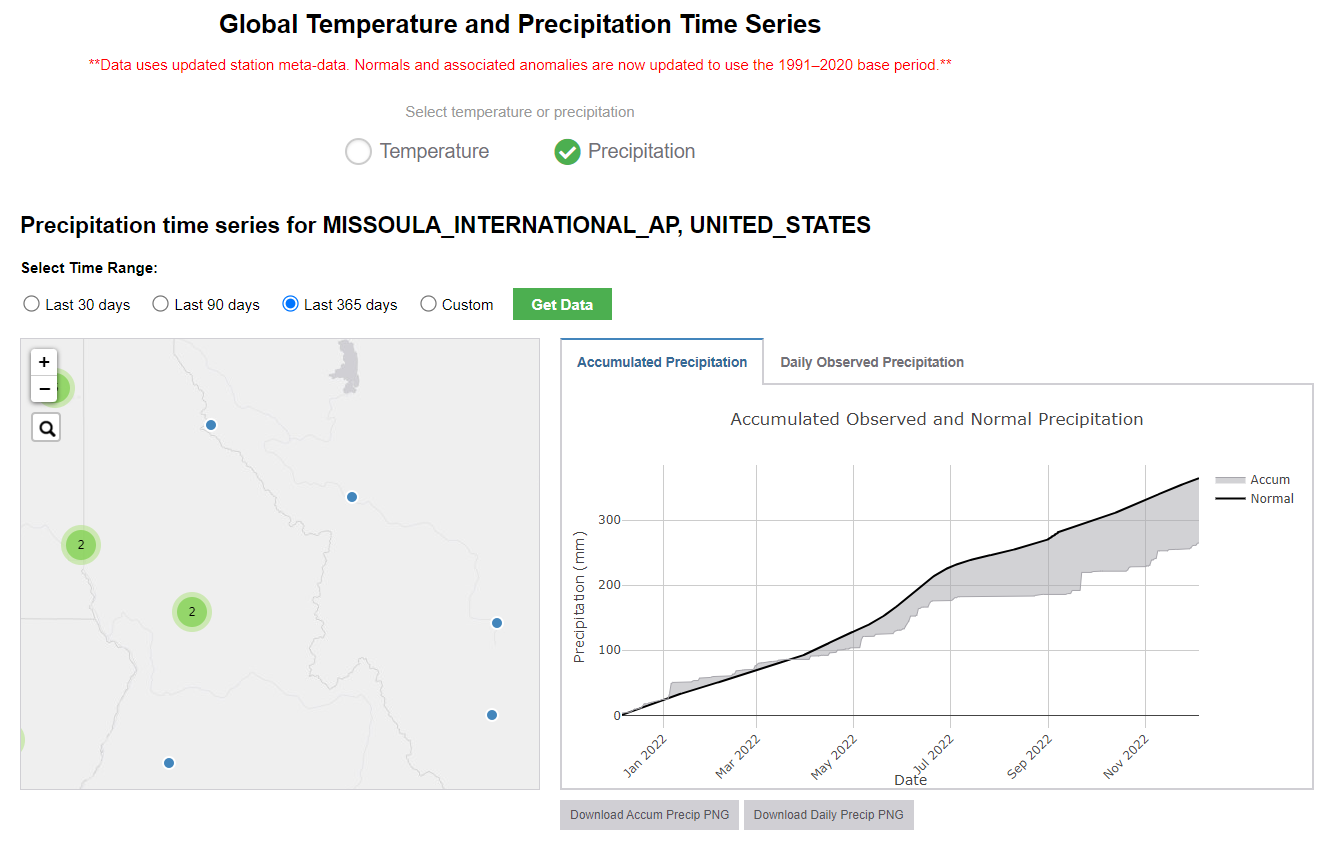
| Precipitation Graphs of precipitation departures from normal (top chart) with daily accumulation (bottom chart) over 30, 90, and 365 days are shown here. Shading for rainfall departures follows standard convention: green for wetter than normal, brown for drier than normal. |
||
 |
||
 |
 |
6-10 Day Outlook |
|
Temperature |
Precipitation |
8-14 Day Outlook |
|
Temperature |
Precipitation |
One Month Outlook |
|
Two Week Lead Time Forecast |
|
Temperature |
Precipitation |
Zero Lead Time Forecast |
|
Temperature |
Precipitation |
Three Month Outlook |
|
Temperature |
Precipitation |
Missoula |
Kalispell |
Butte |
| Montana | Idaho |
Historical Map
If the map will not load, allow browser to load unsafe script or go to Historical Map.
 |
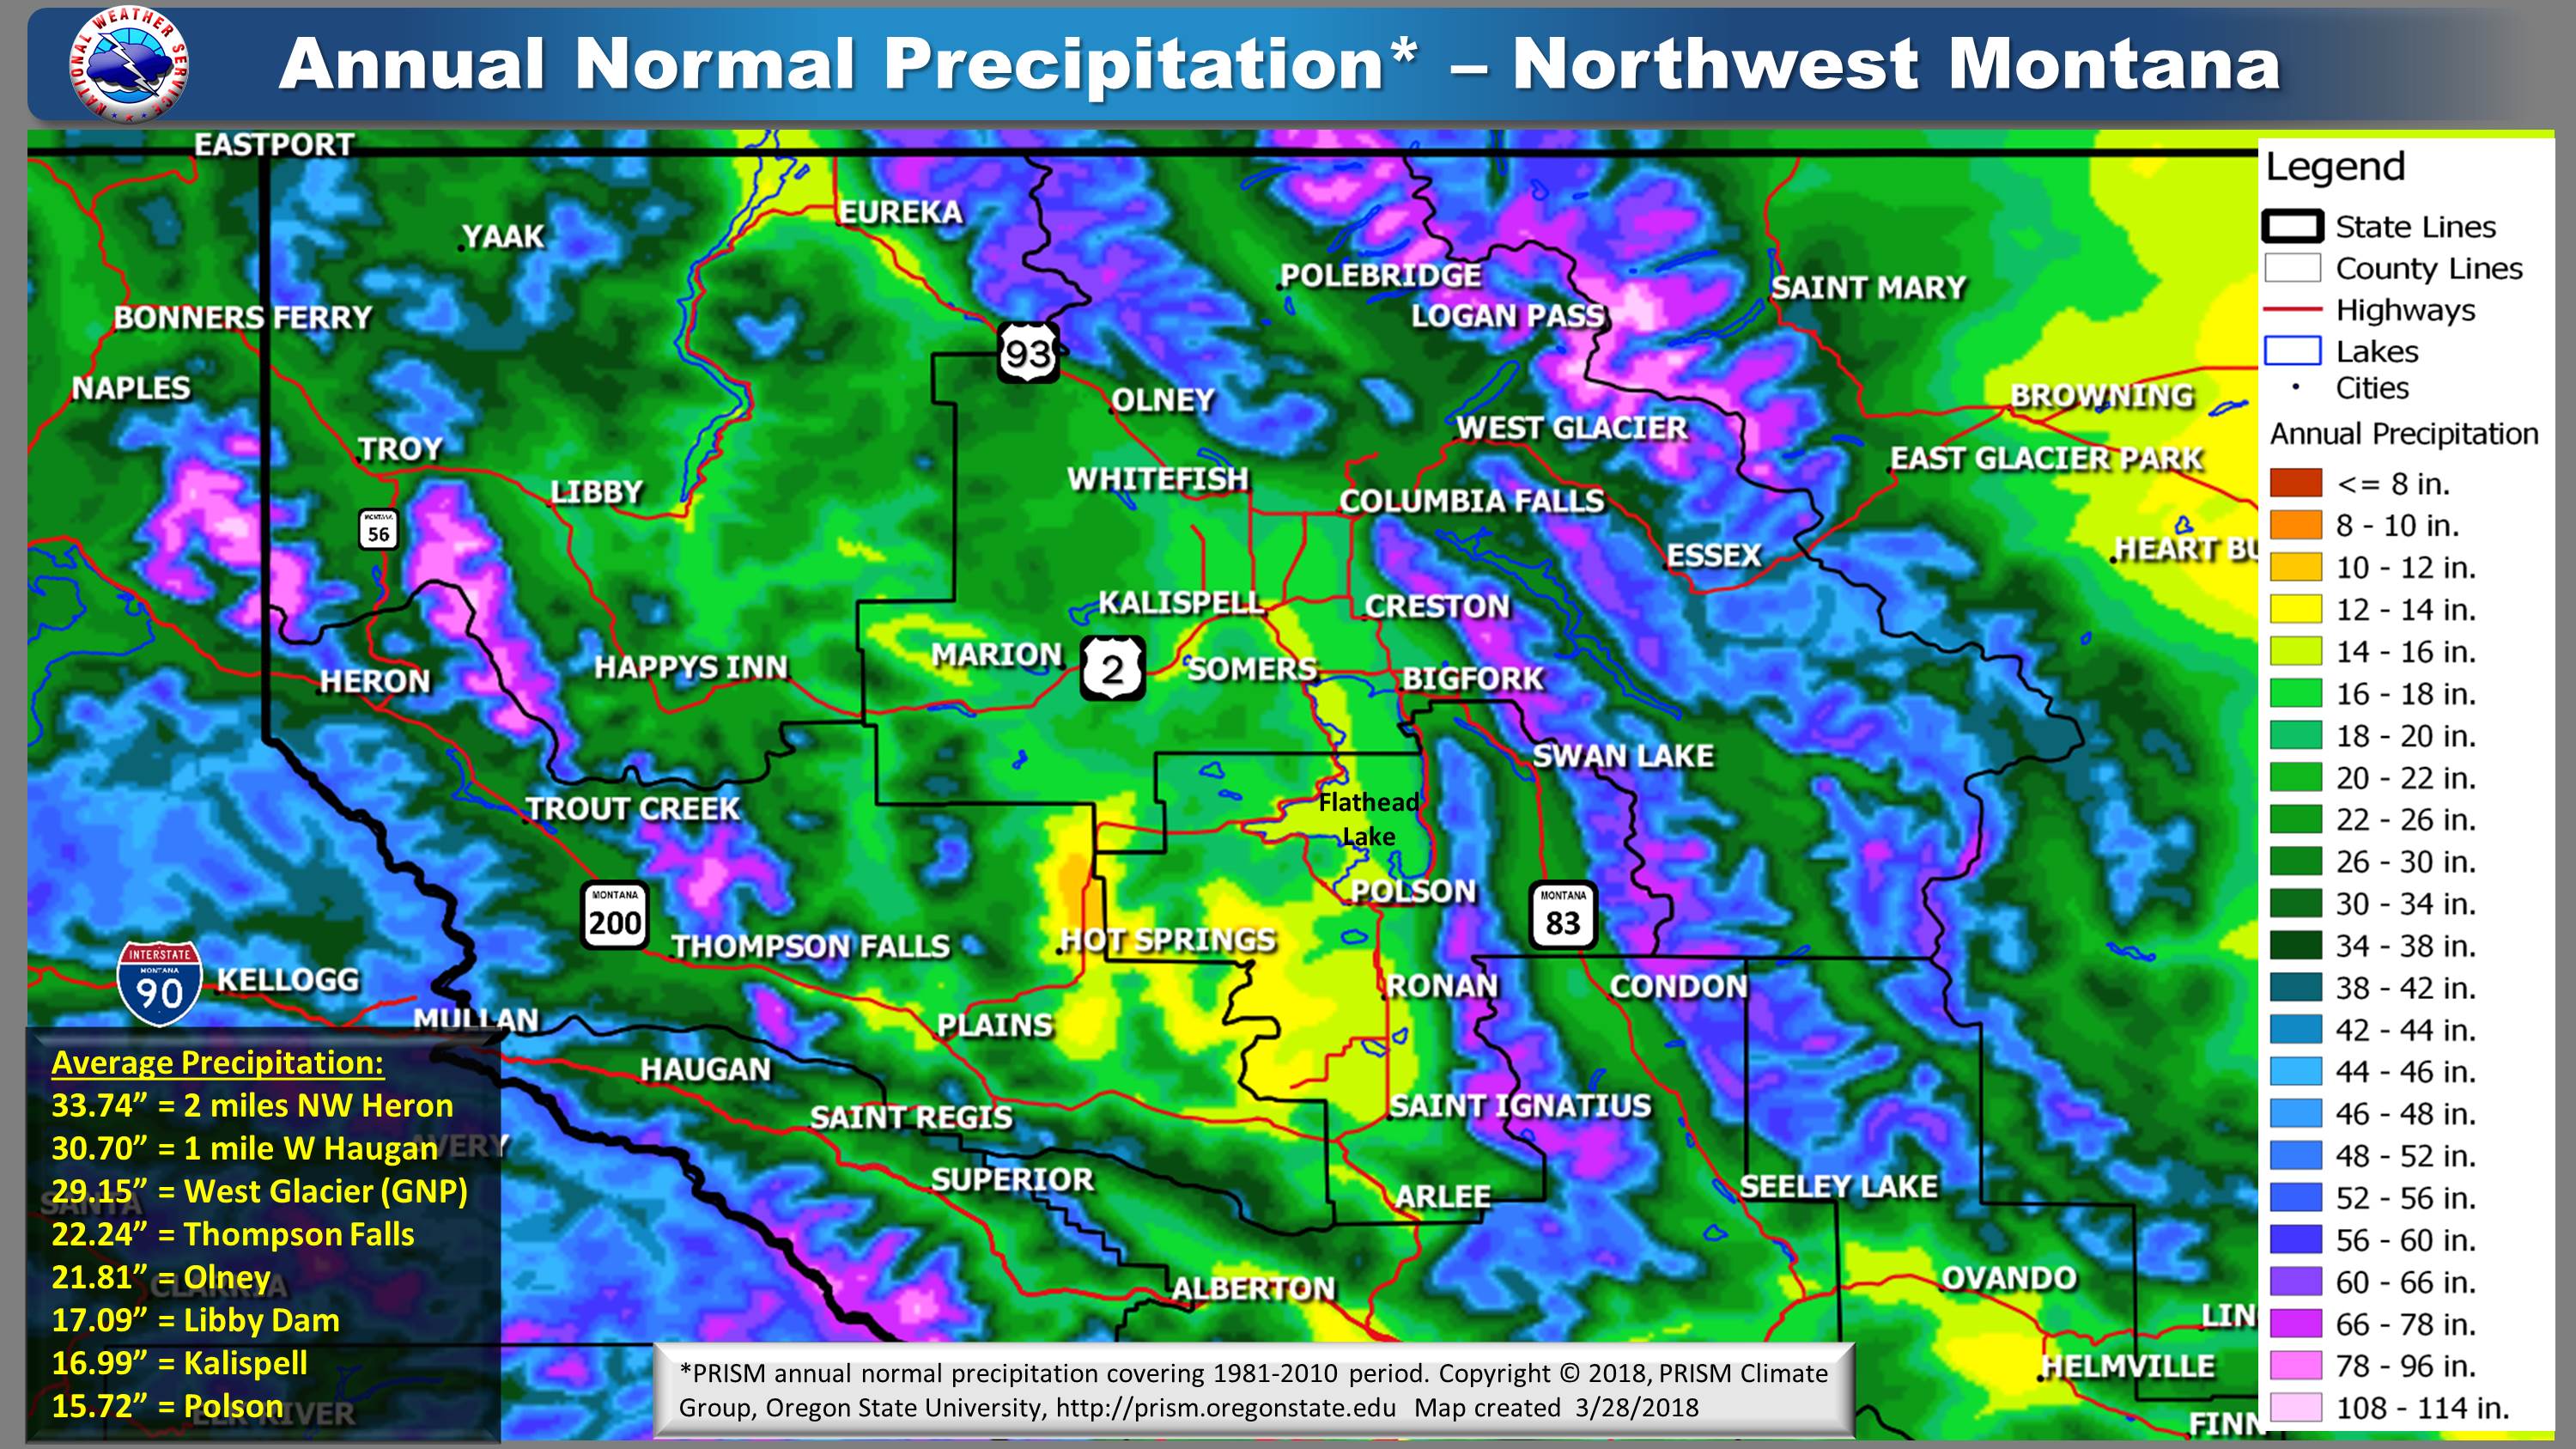 |
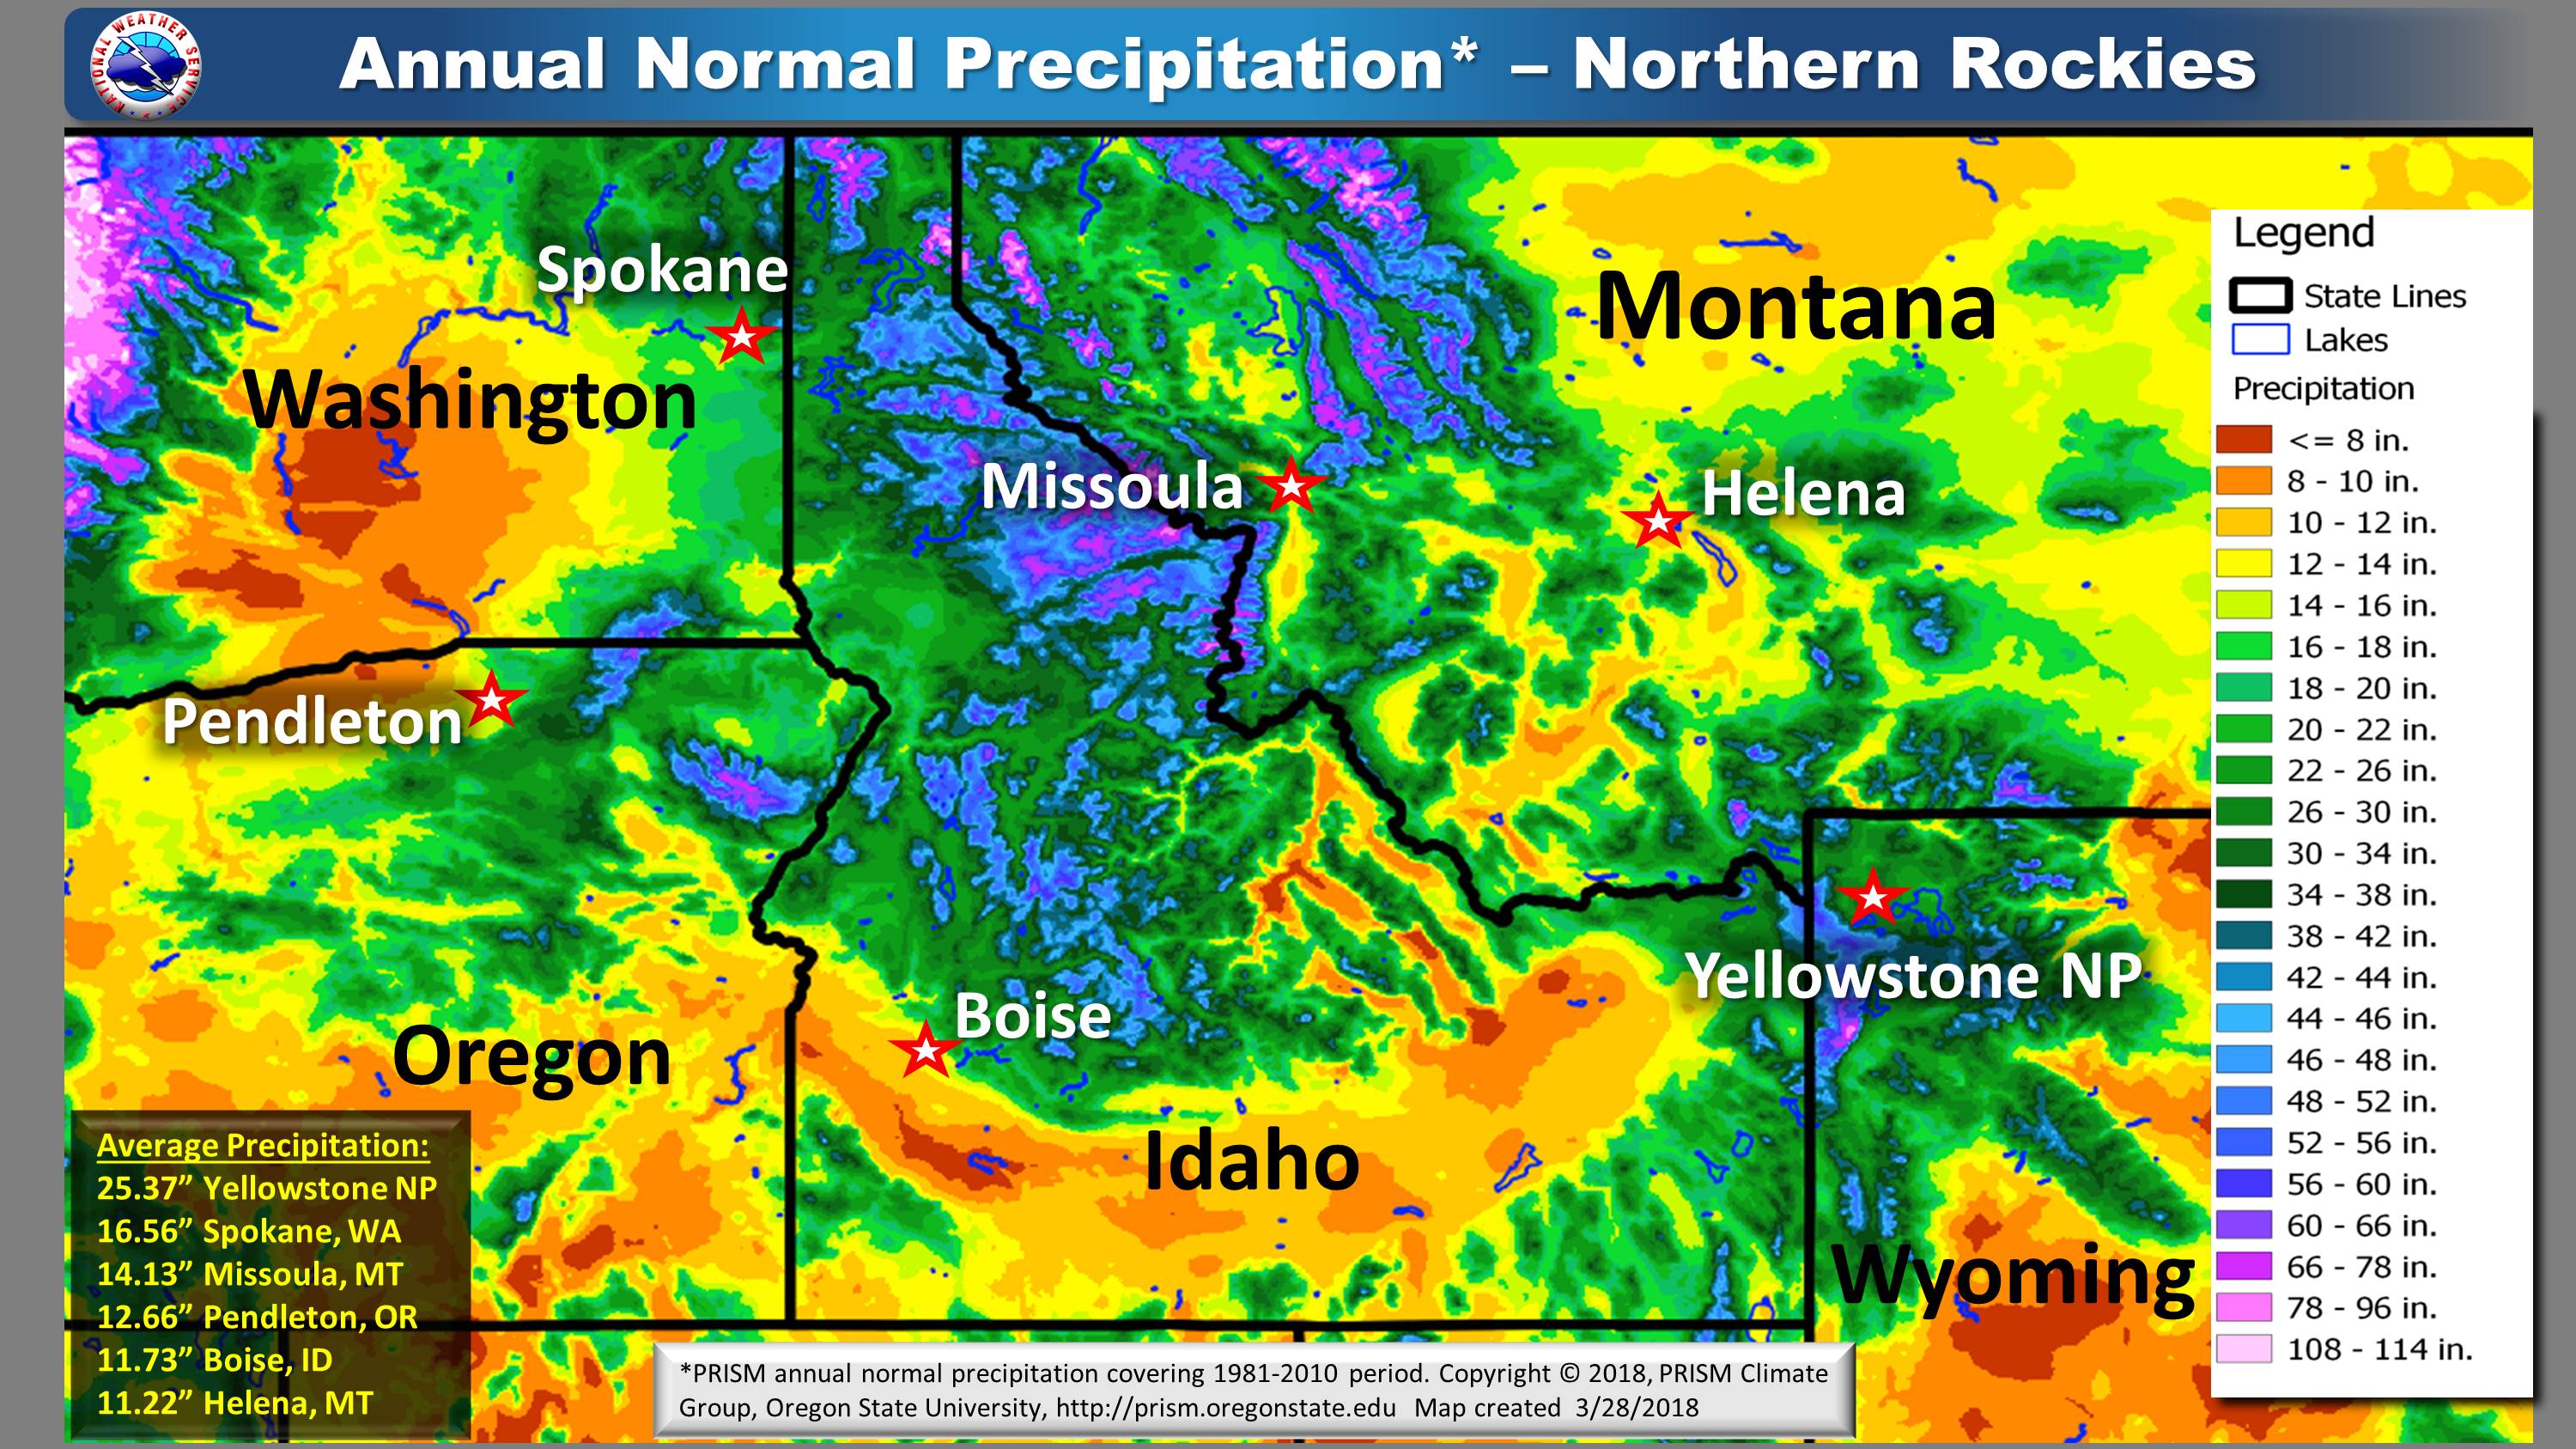
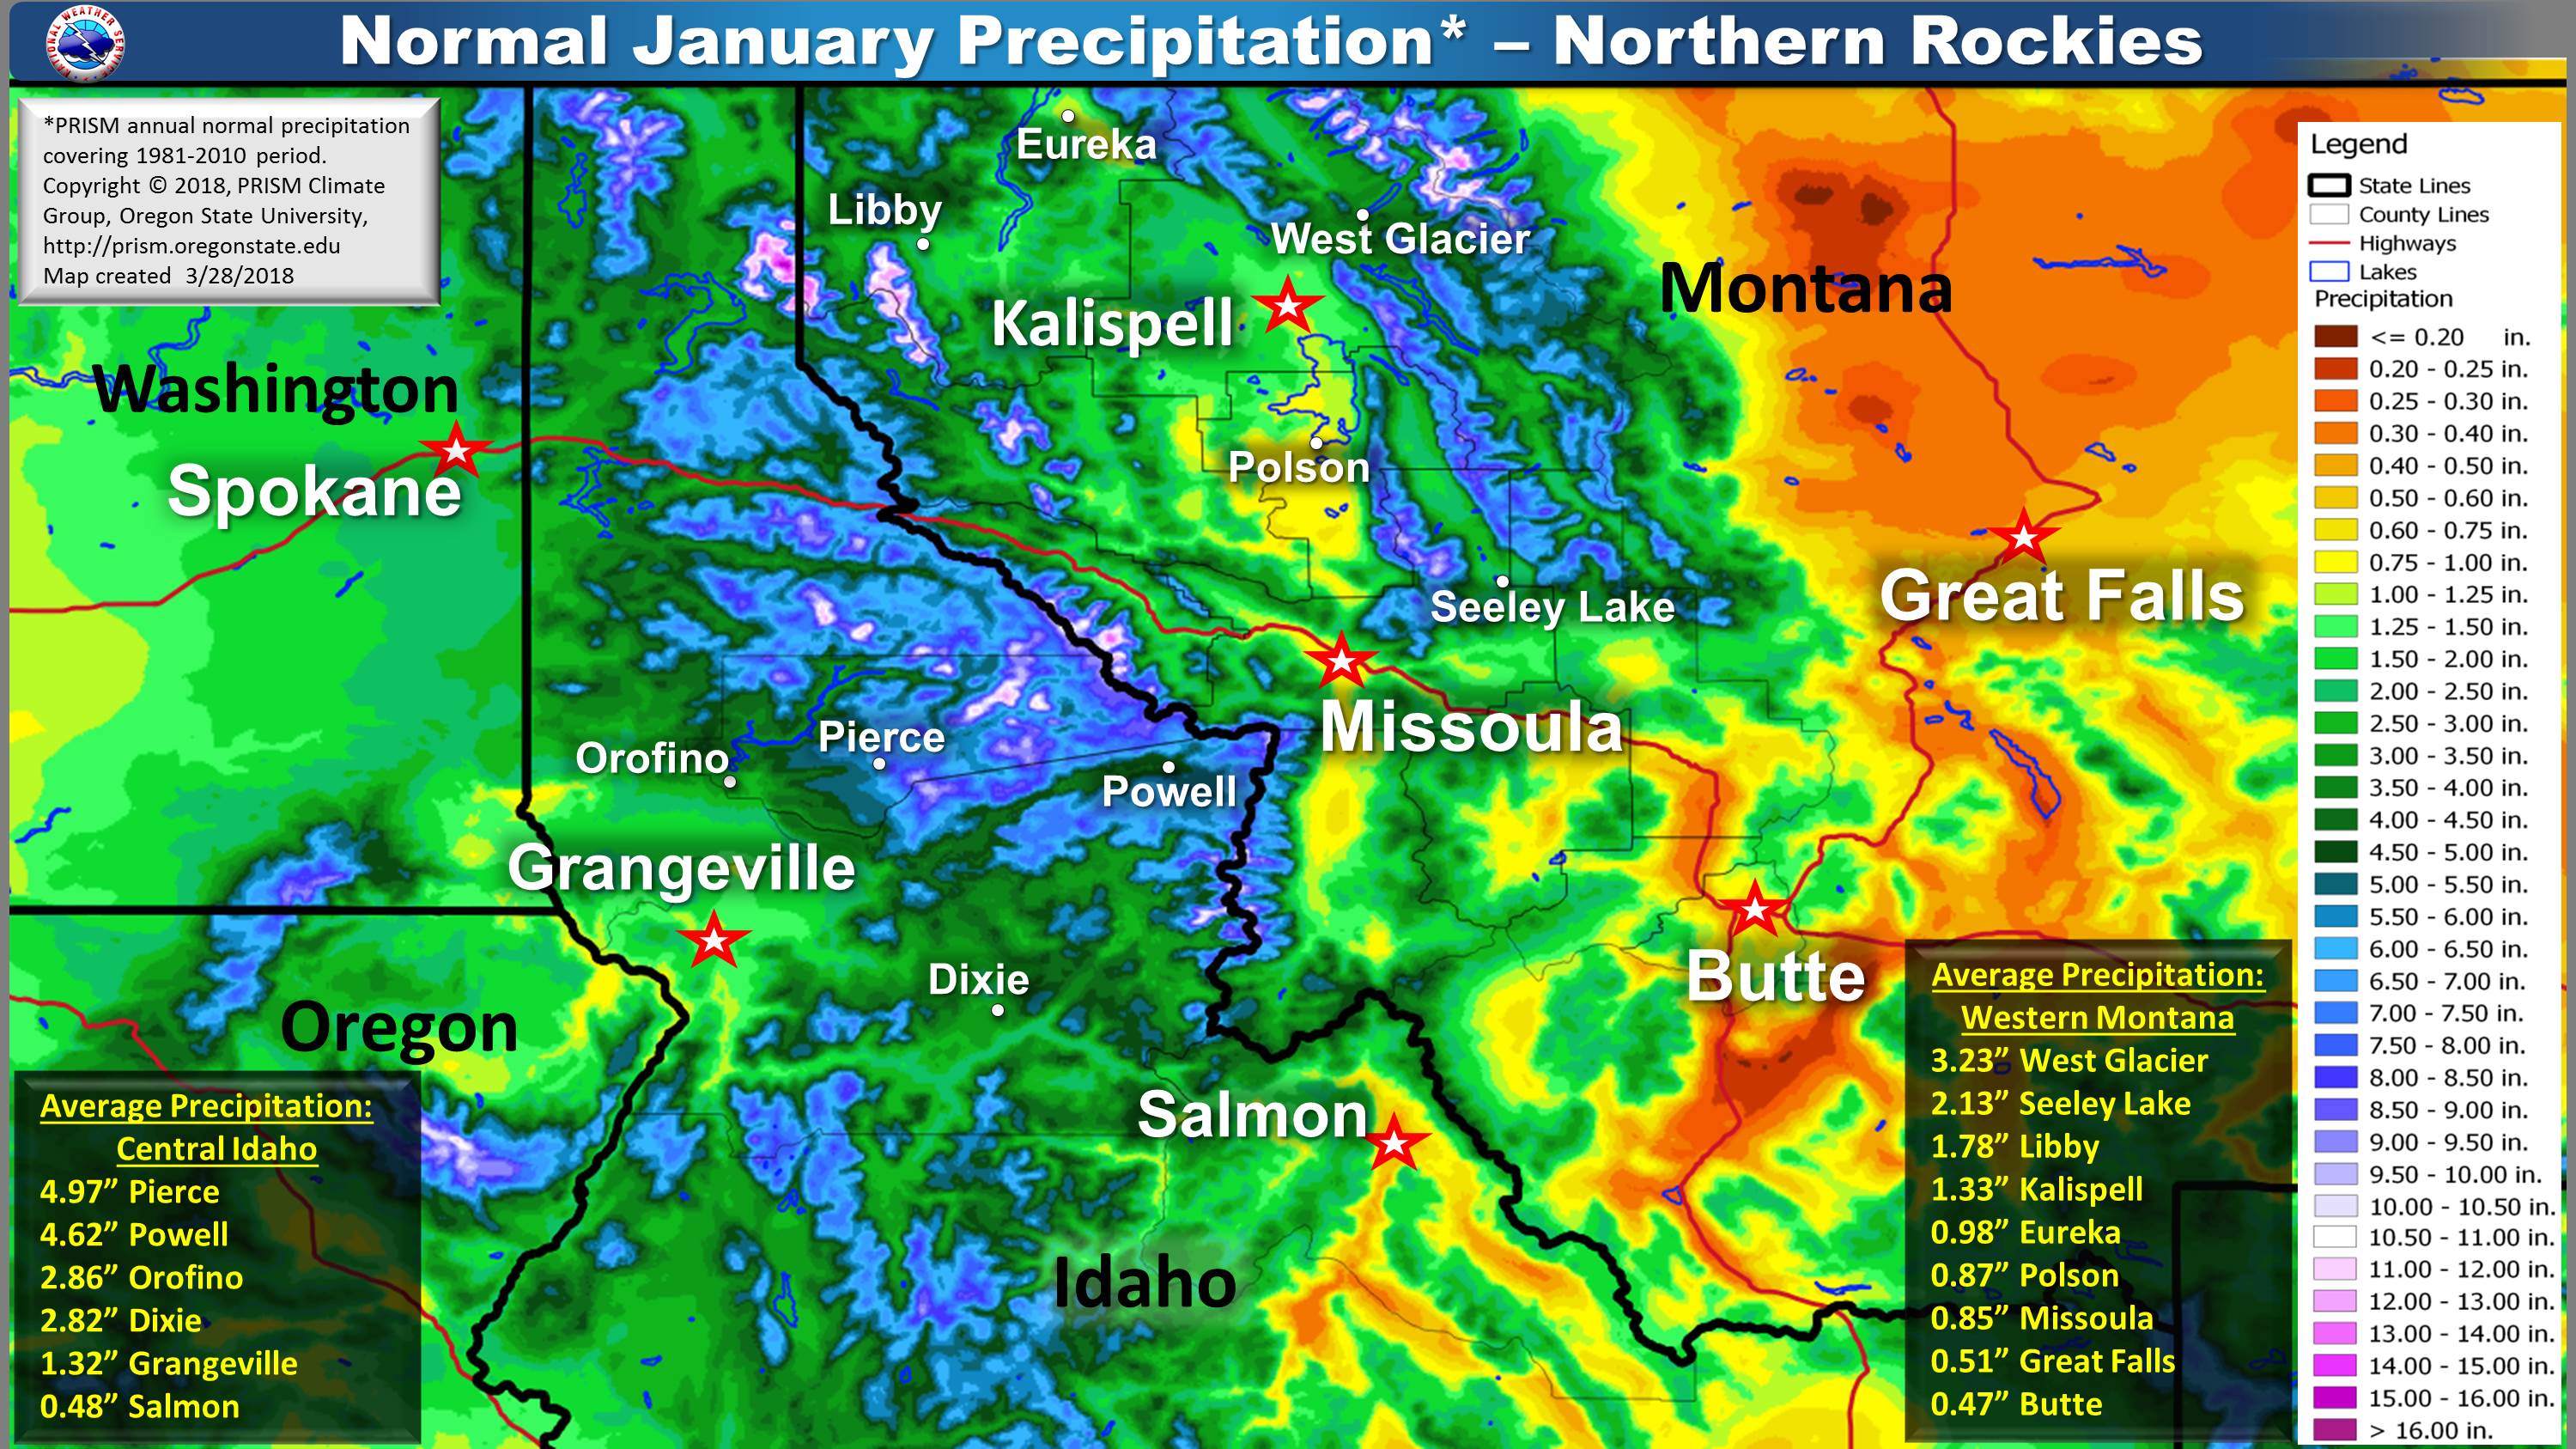
| Northern Rockies | Northwest Montana |
 |
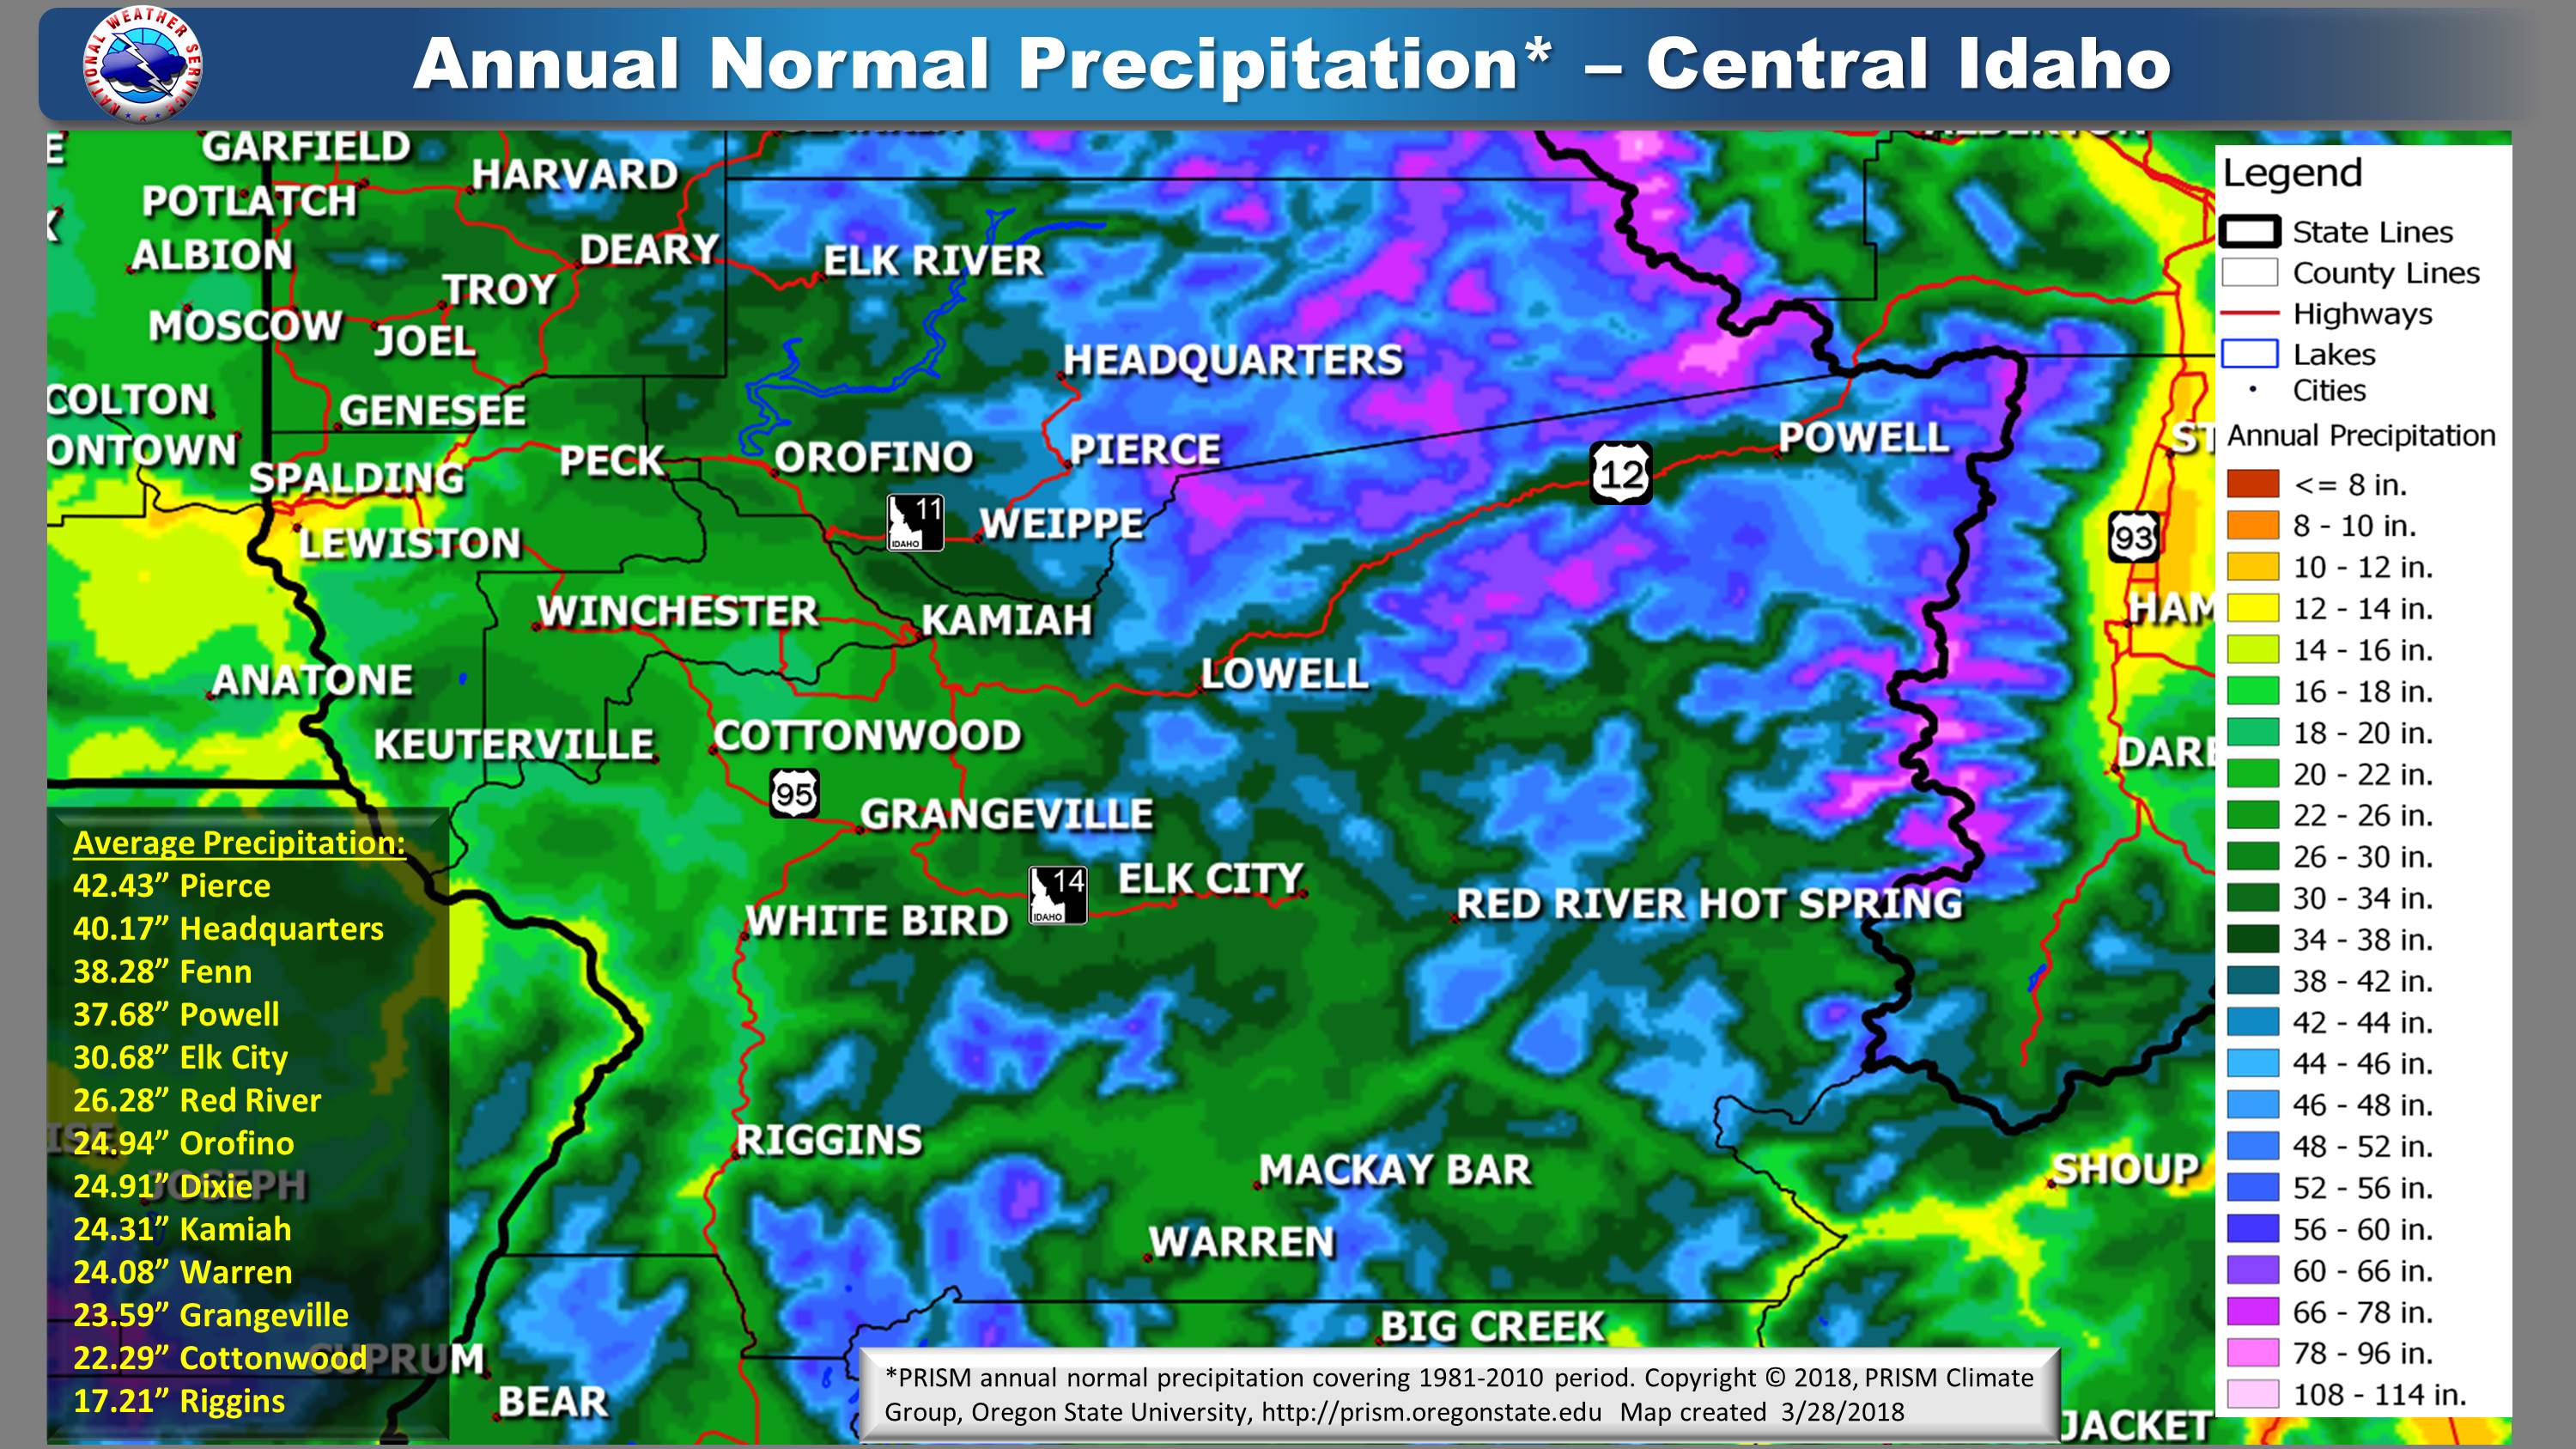 |
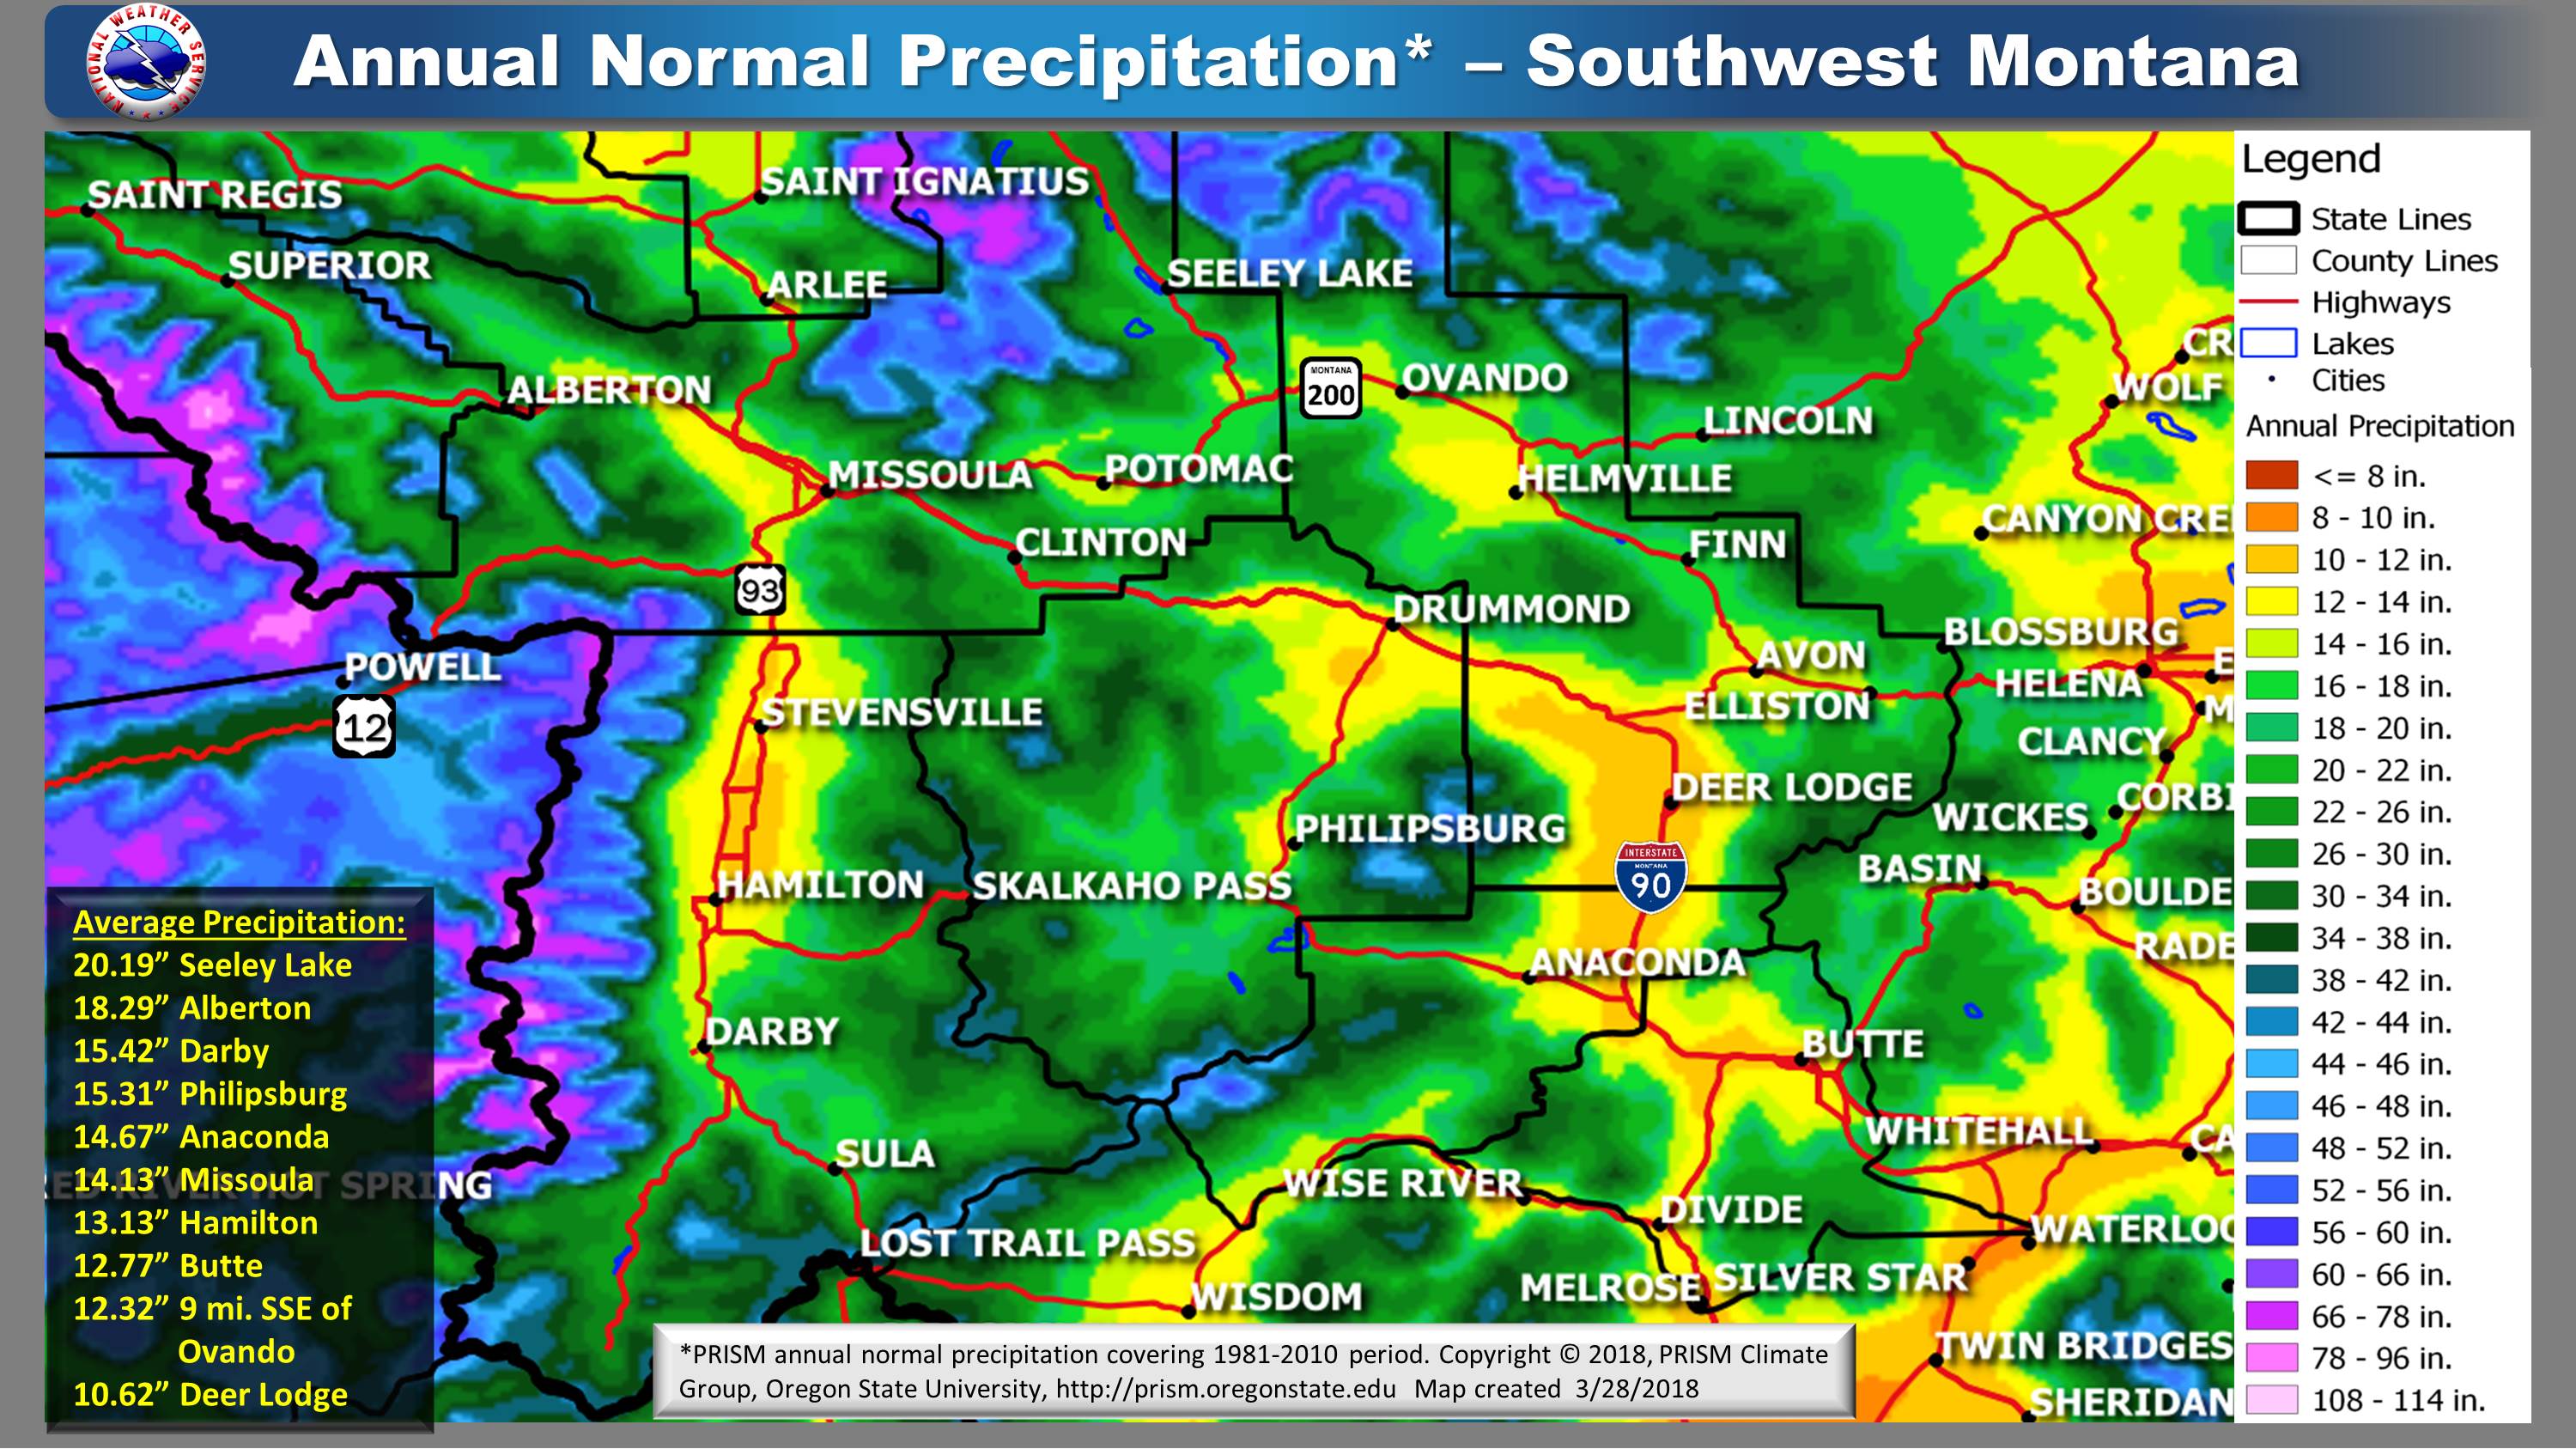
| Southwest Montana | North Central Idaho |
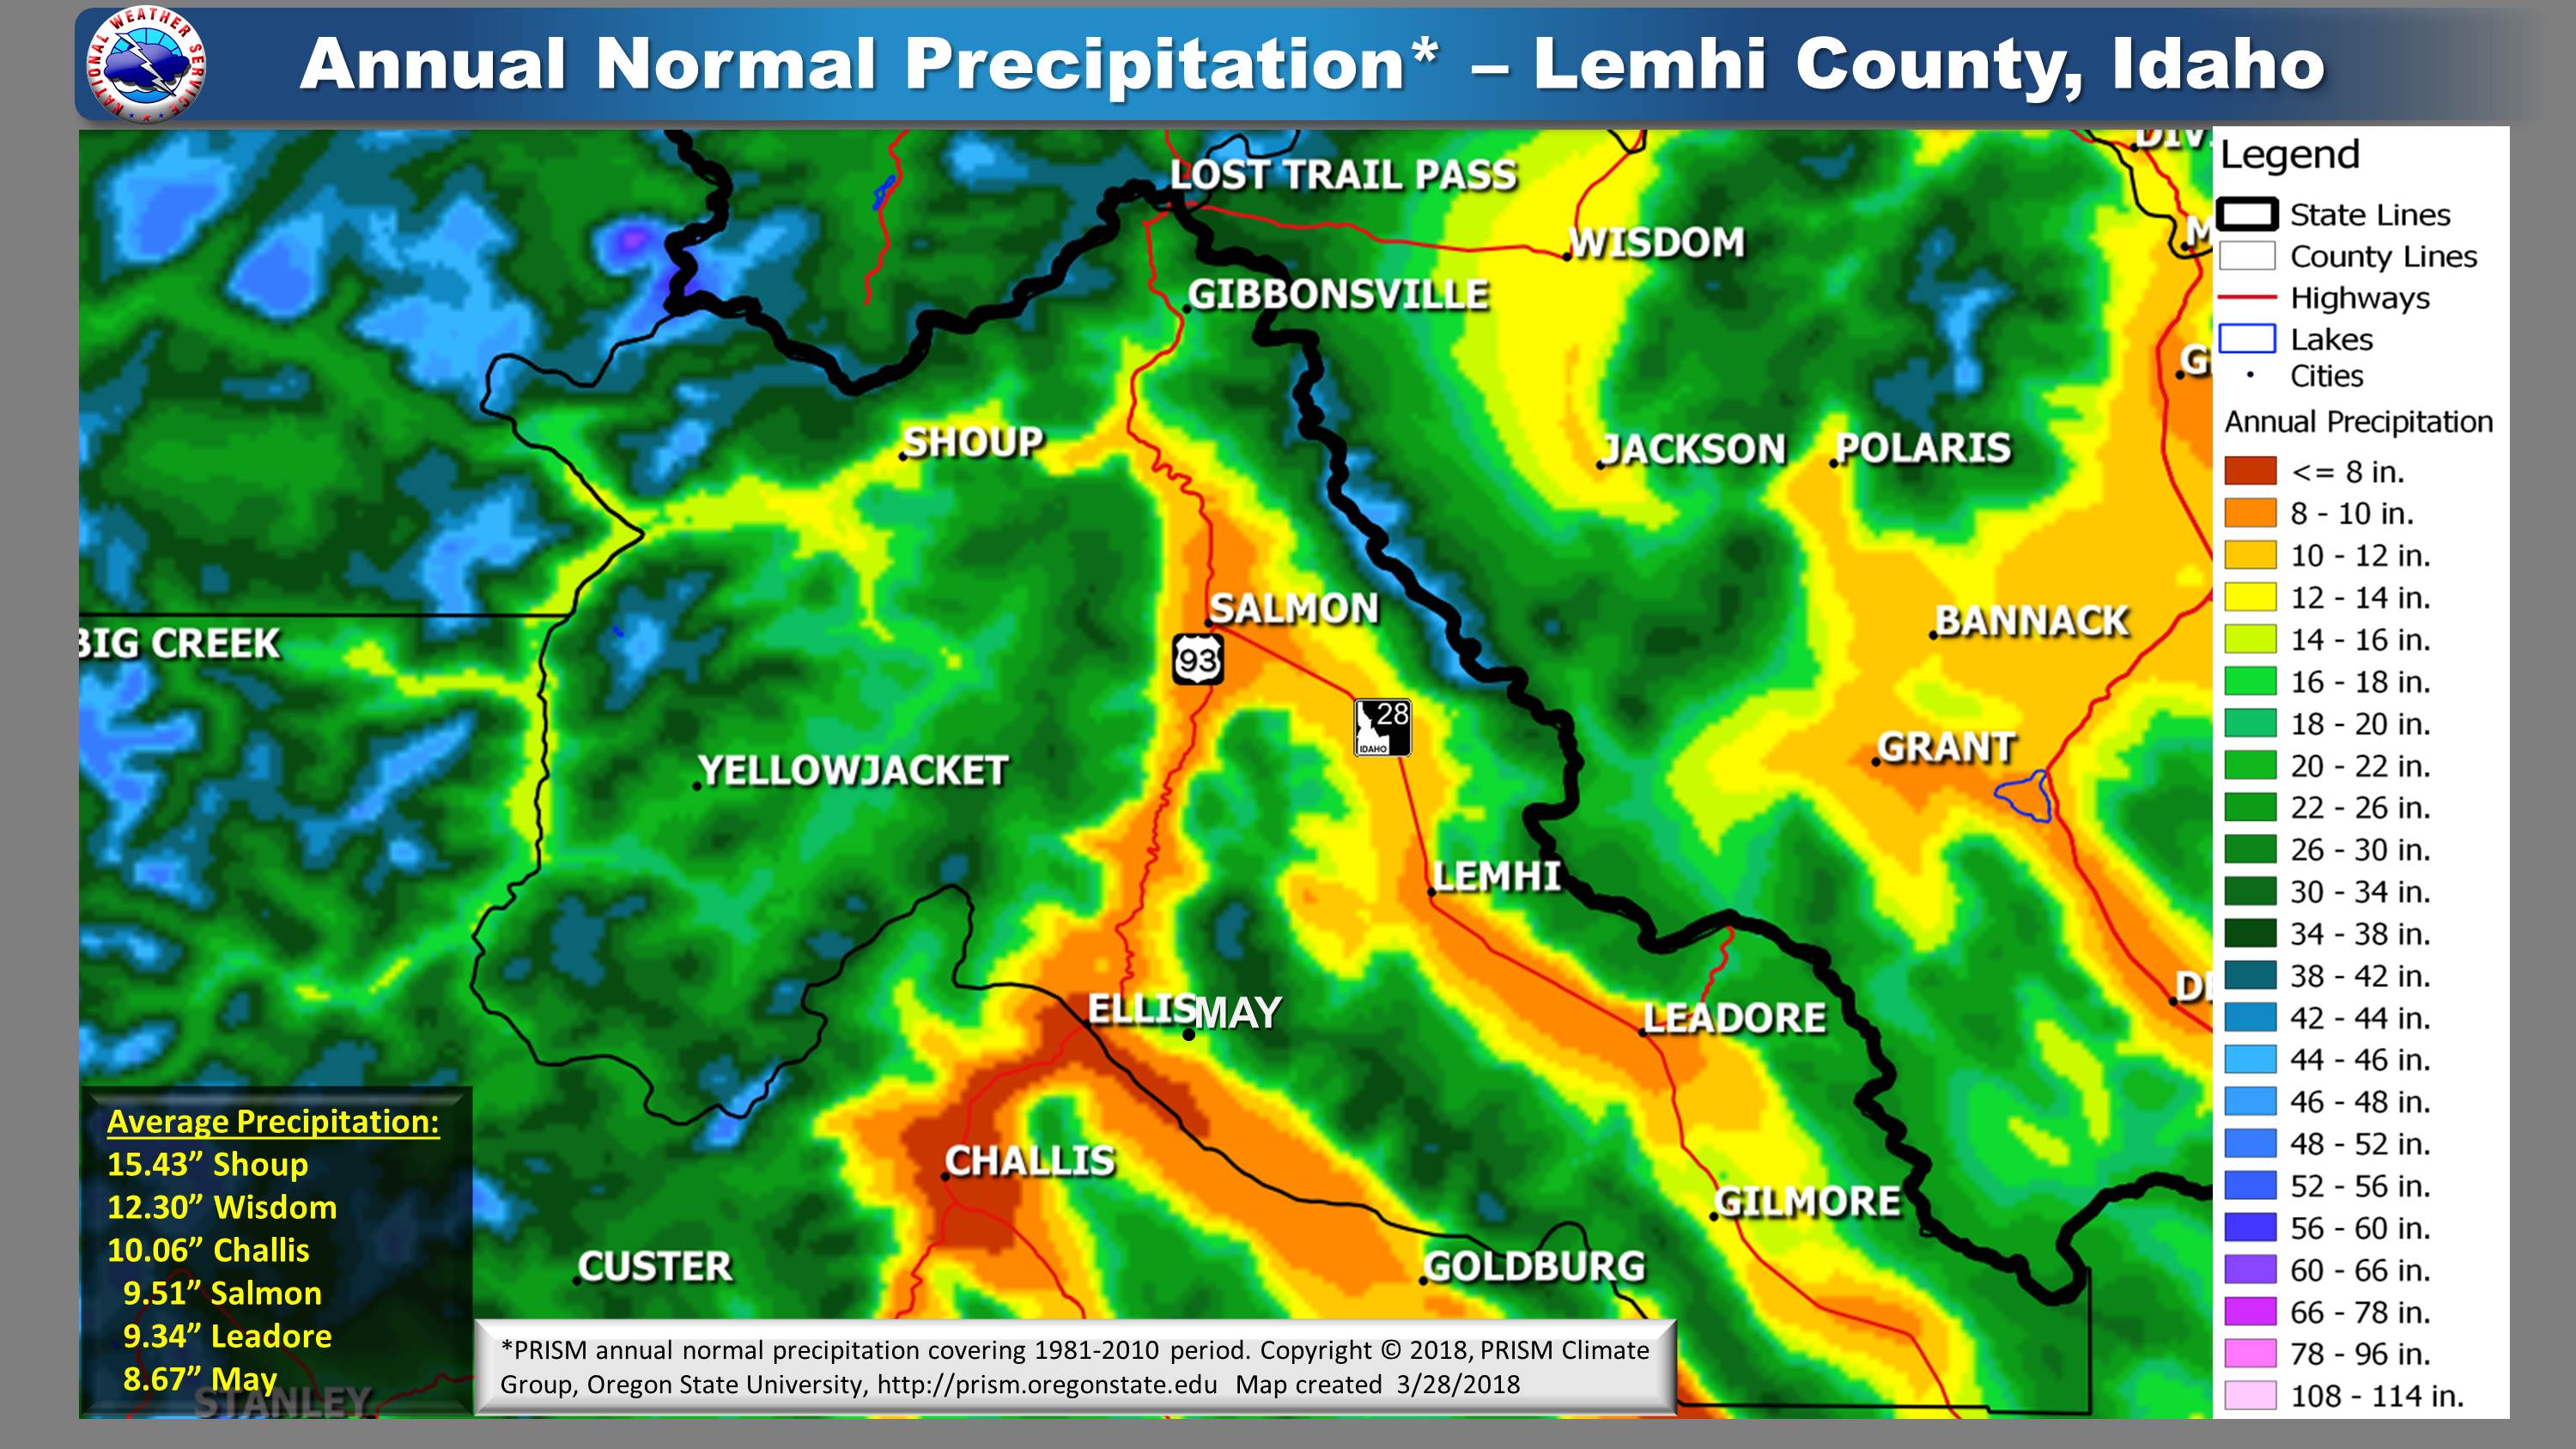 |
| Lemhi Idaho |
 |
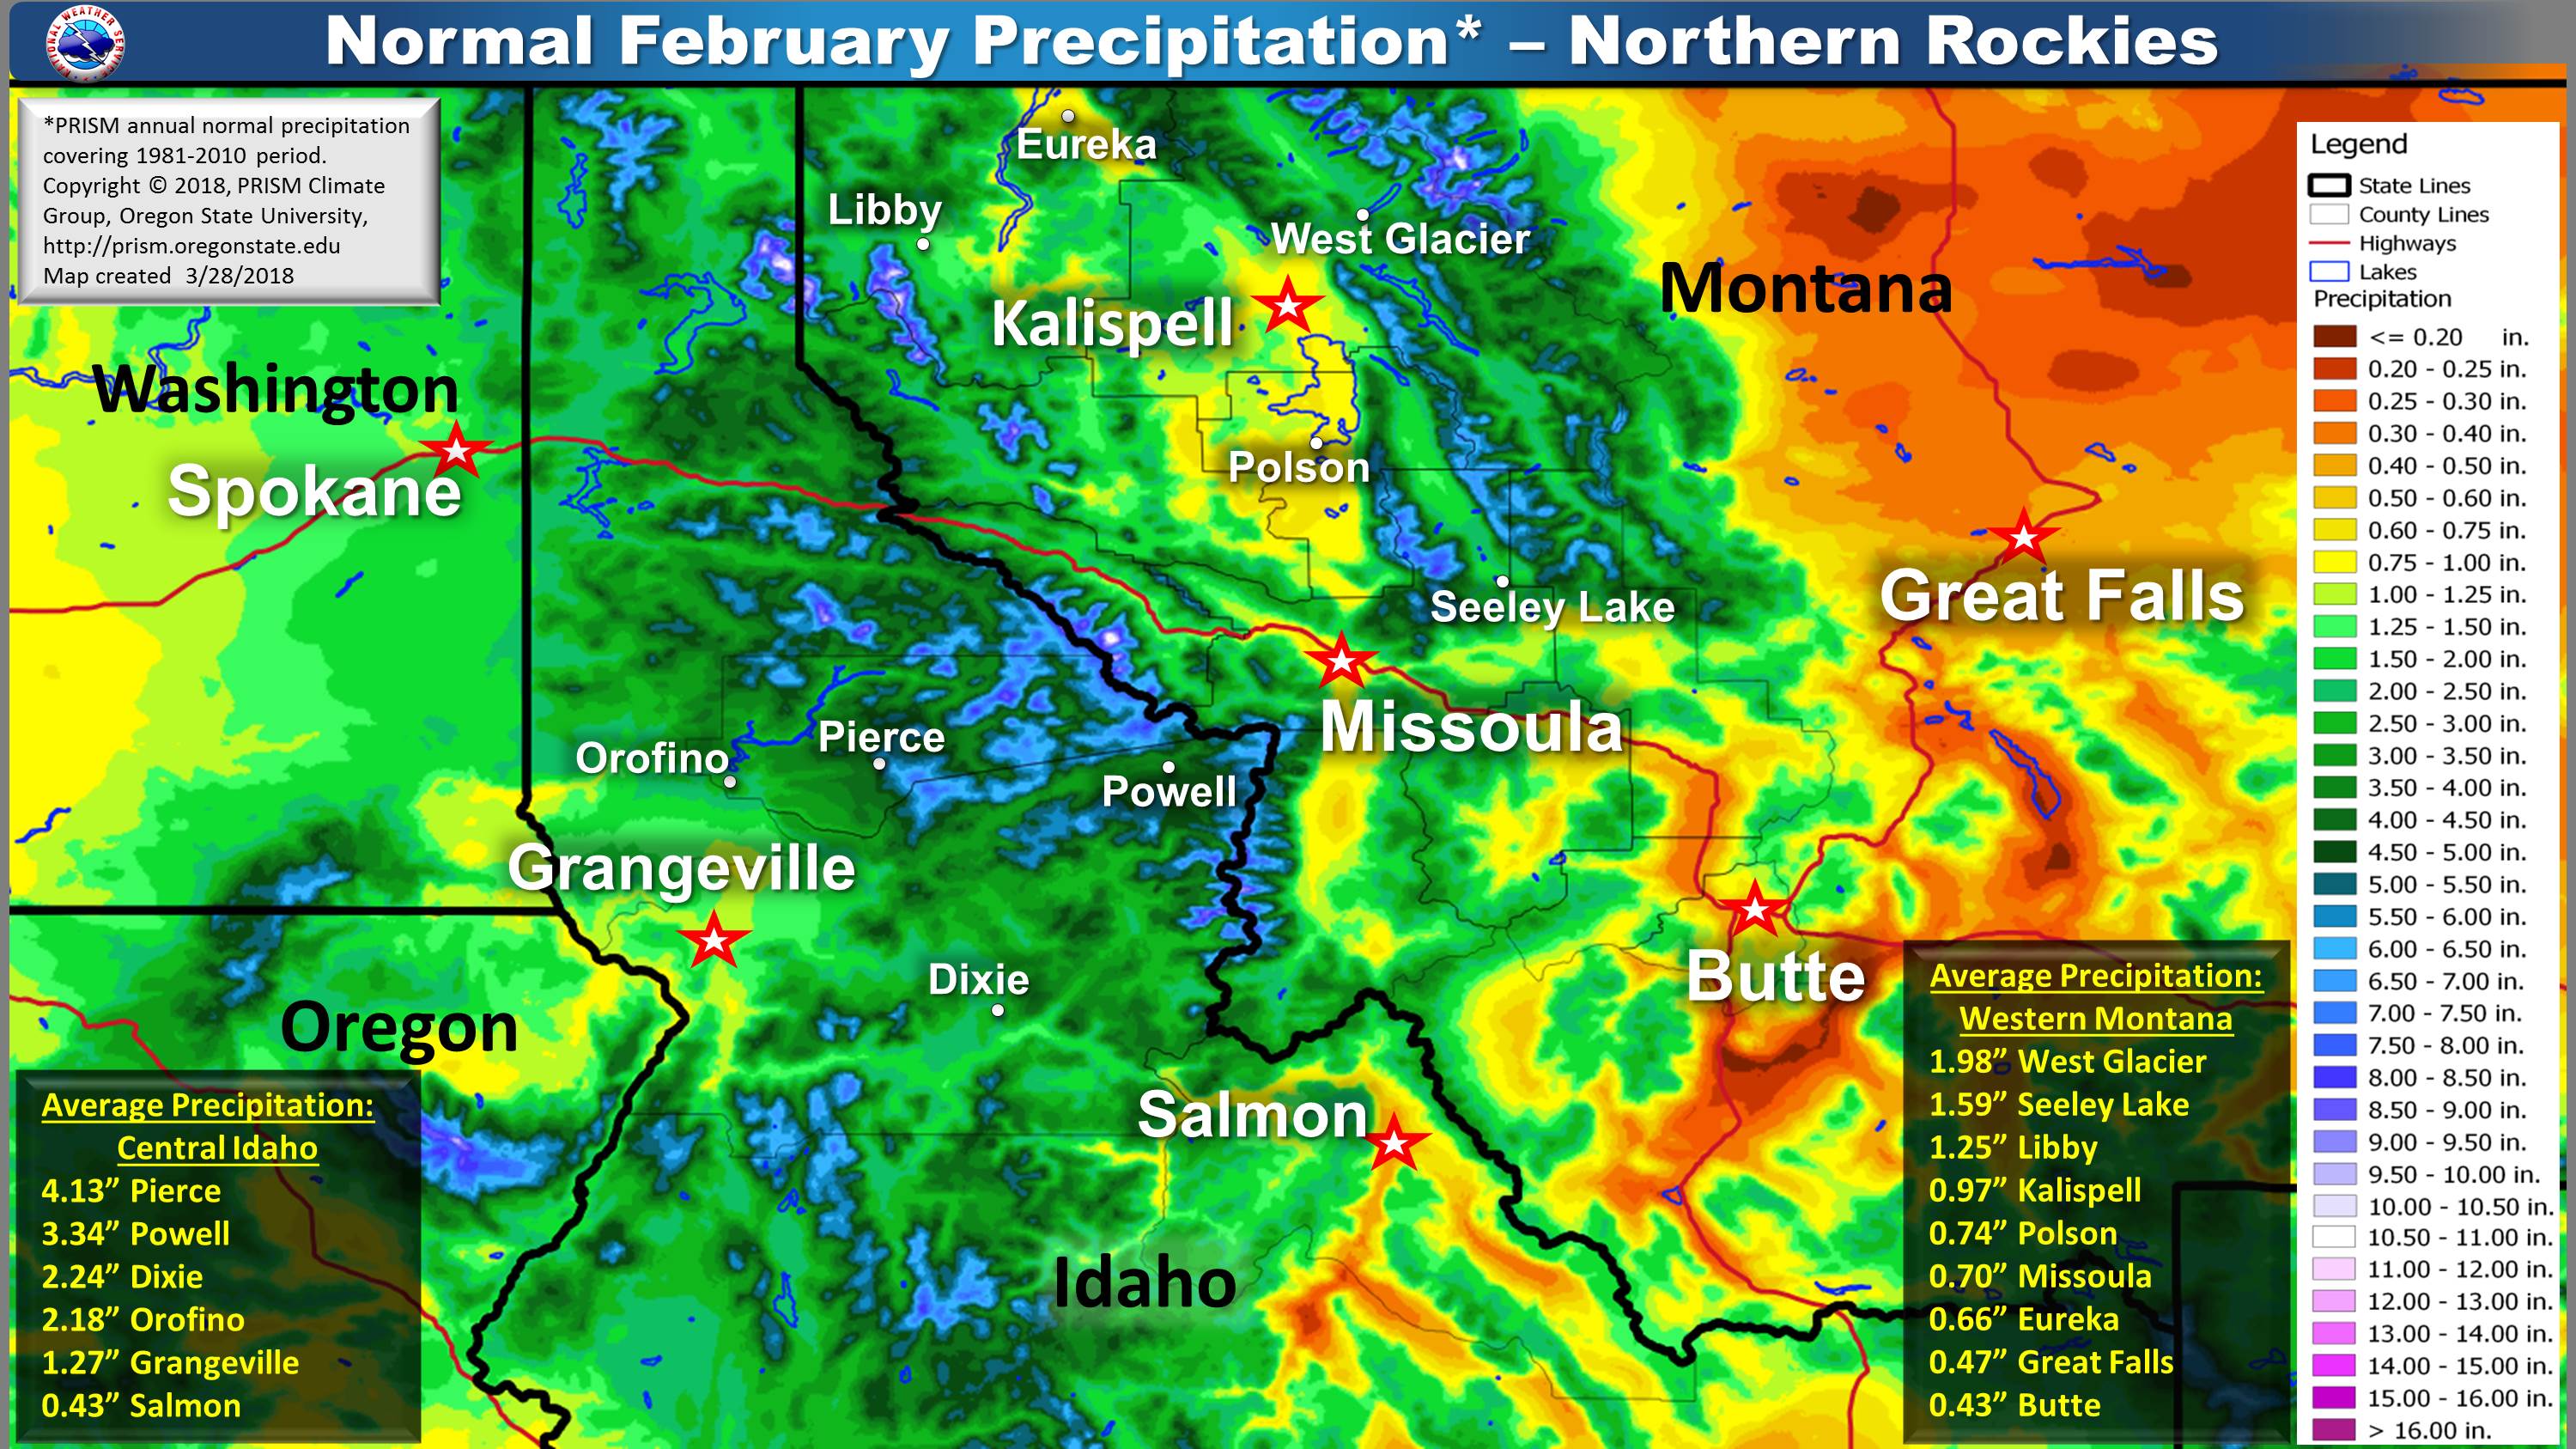 |
| January | February |
 |
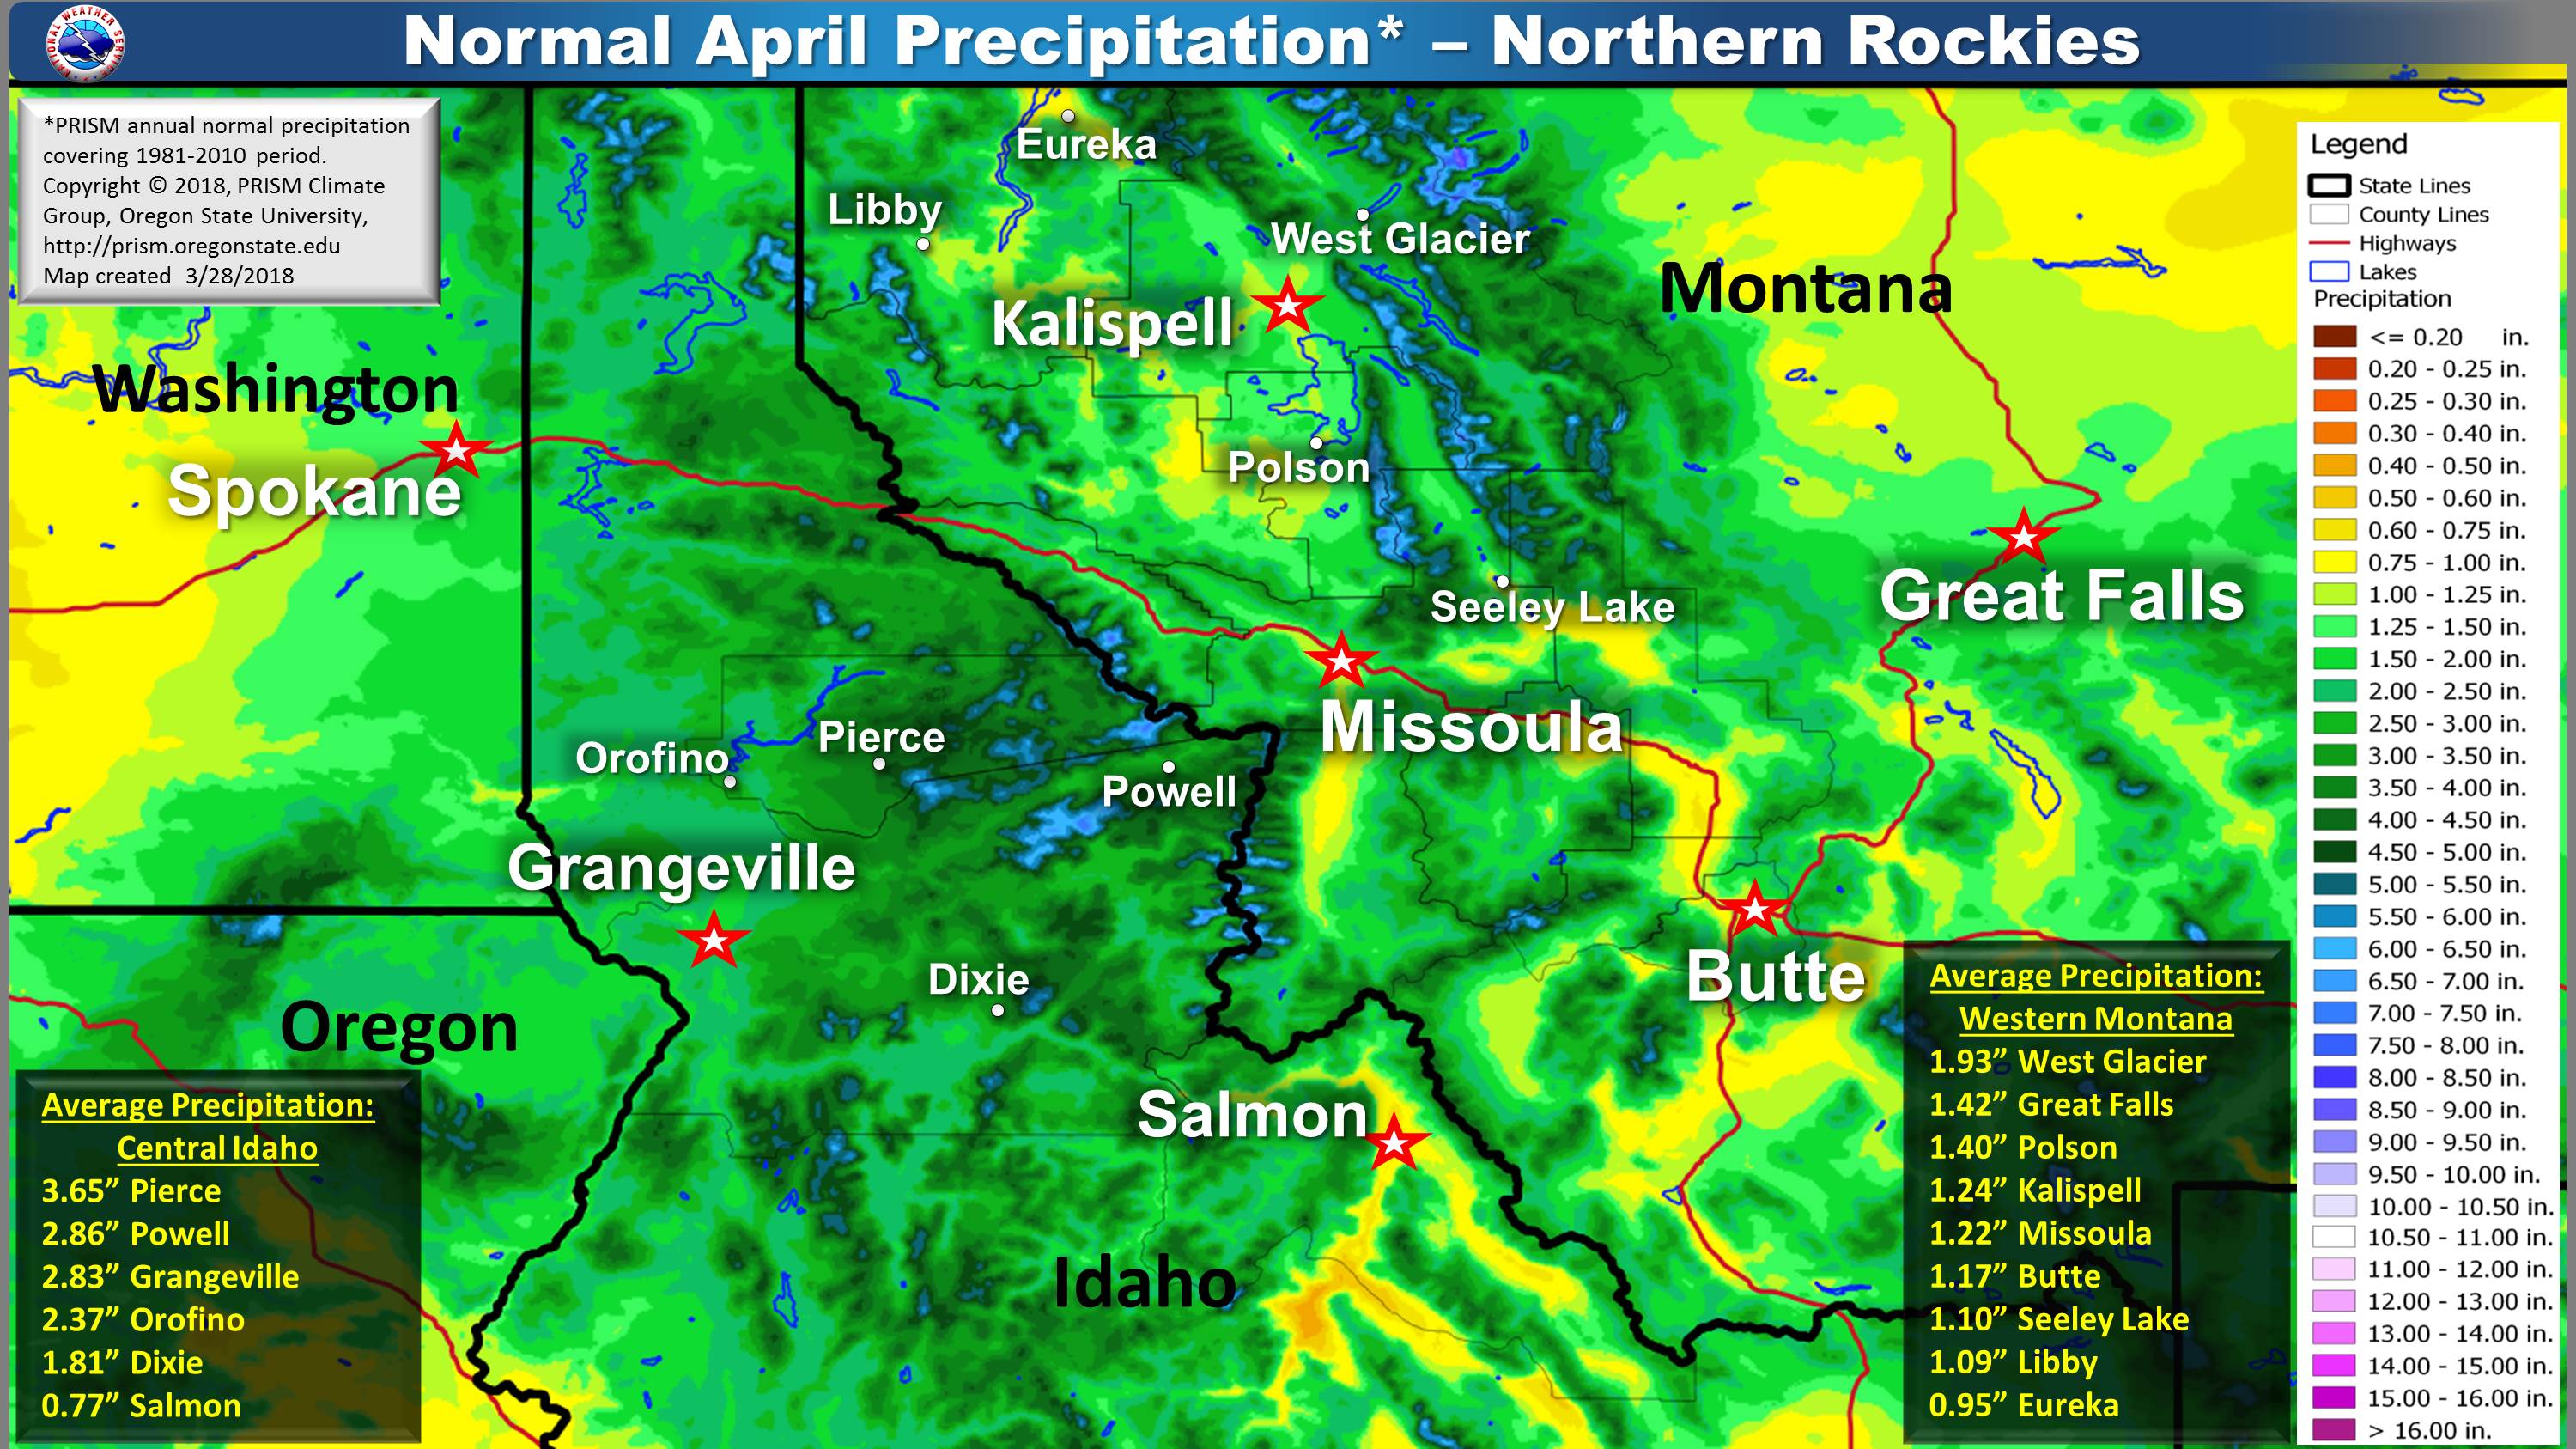 |
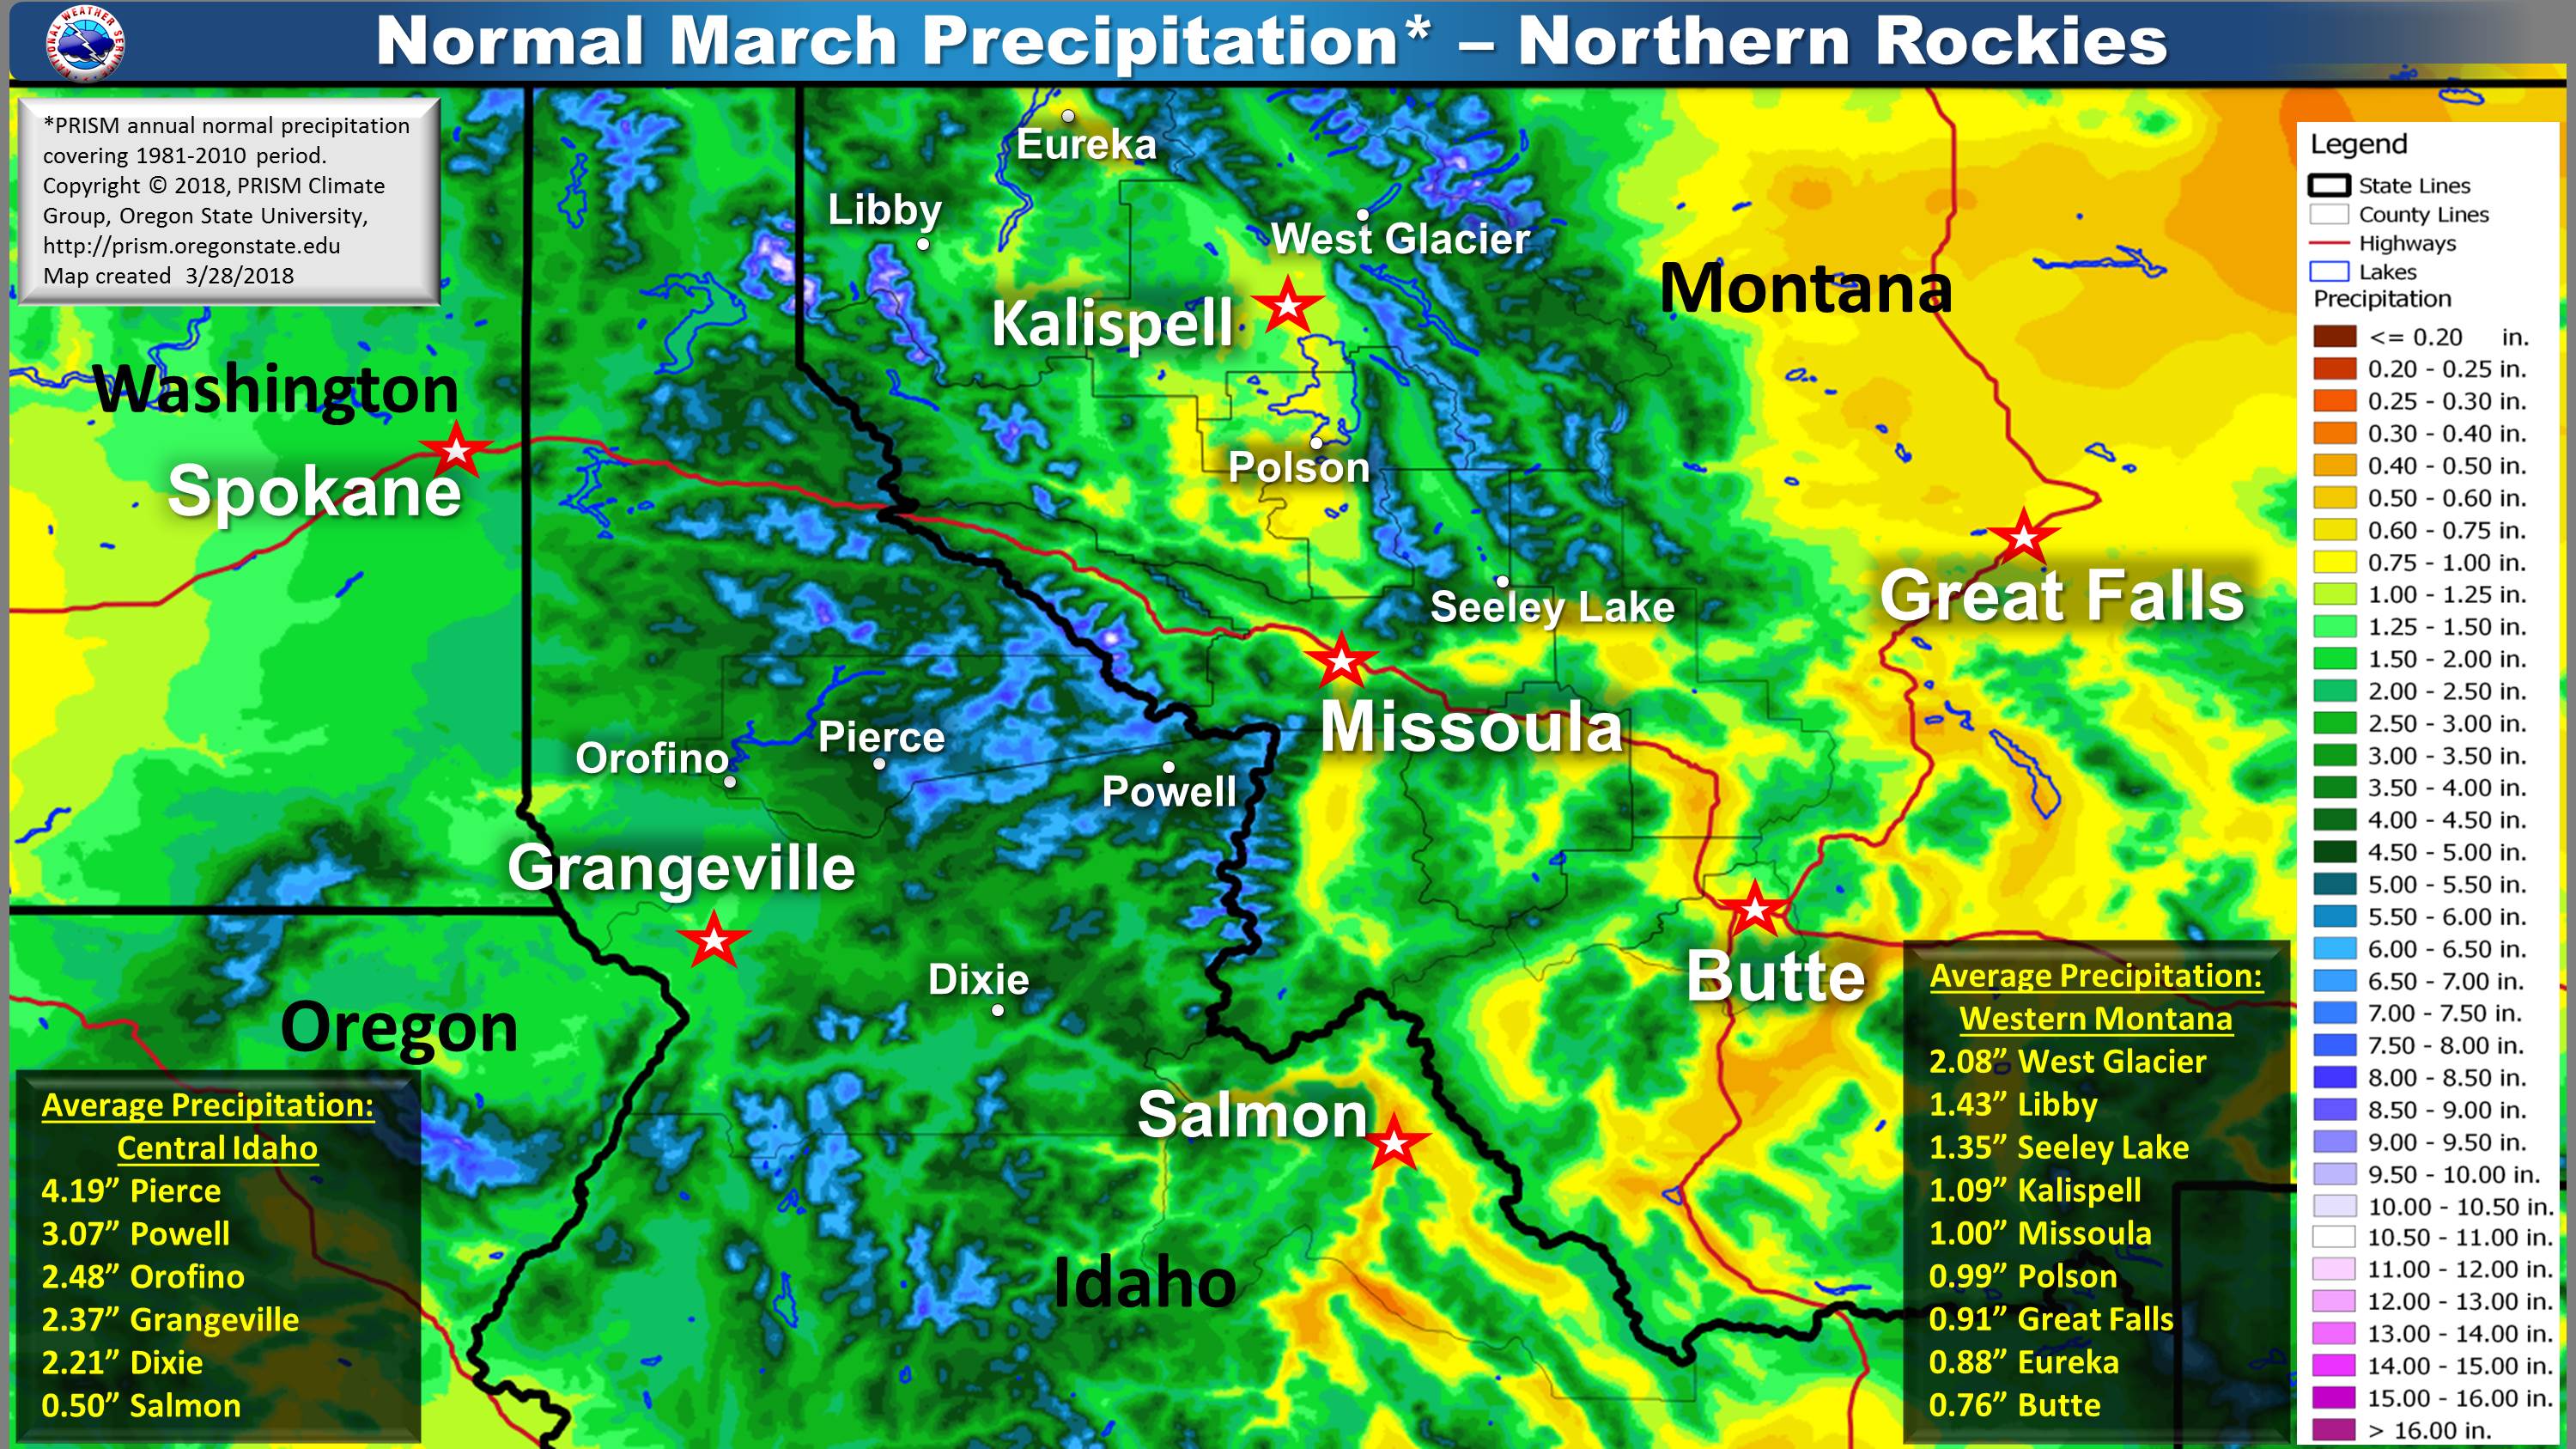
| March | April |
 |
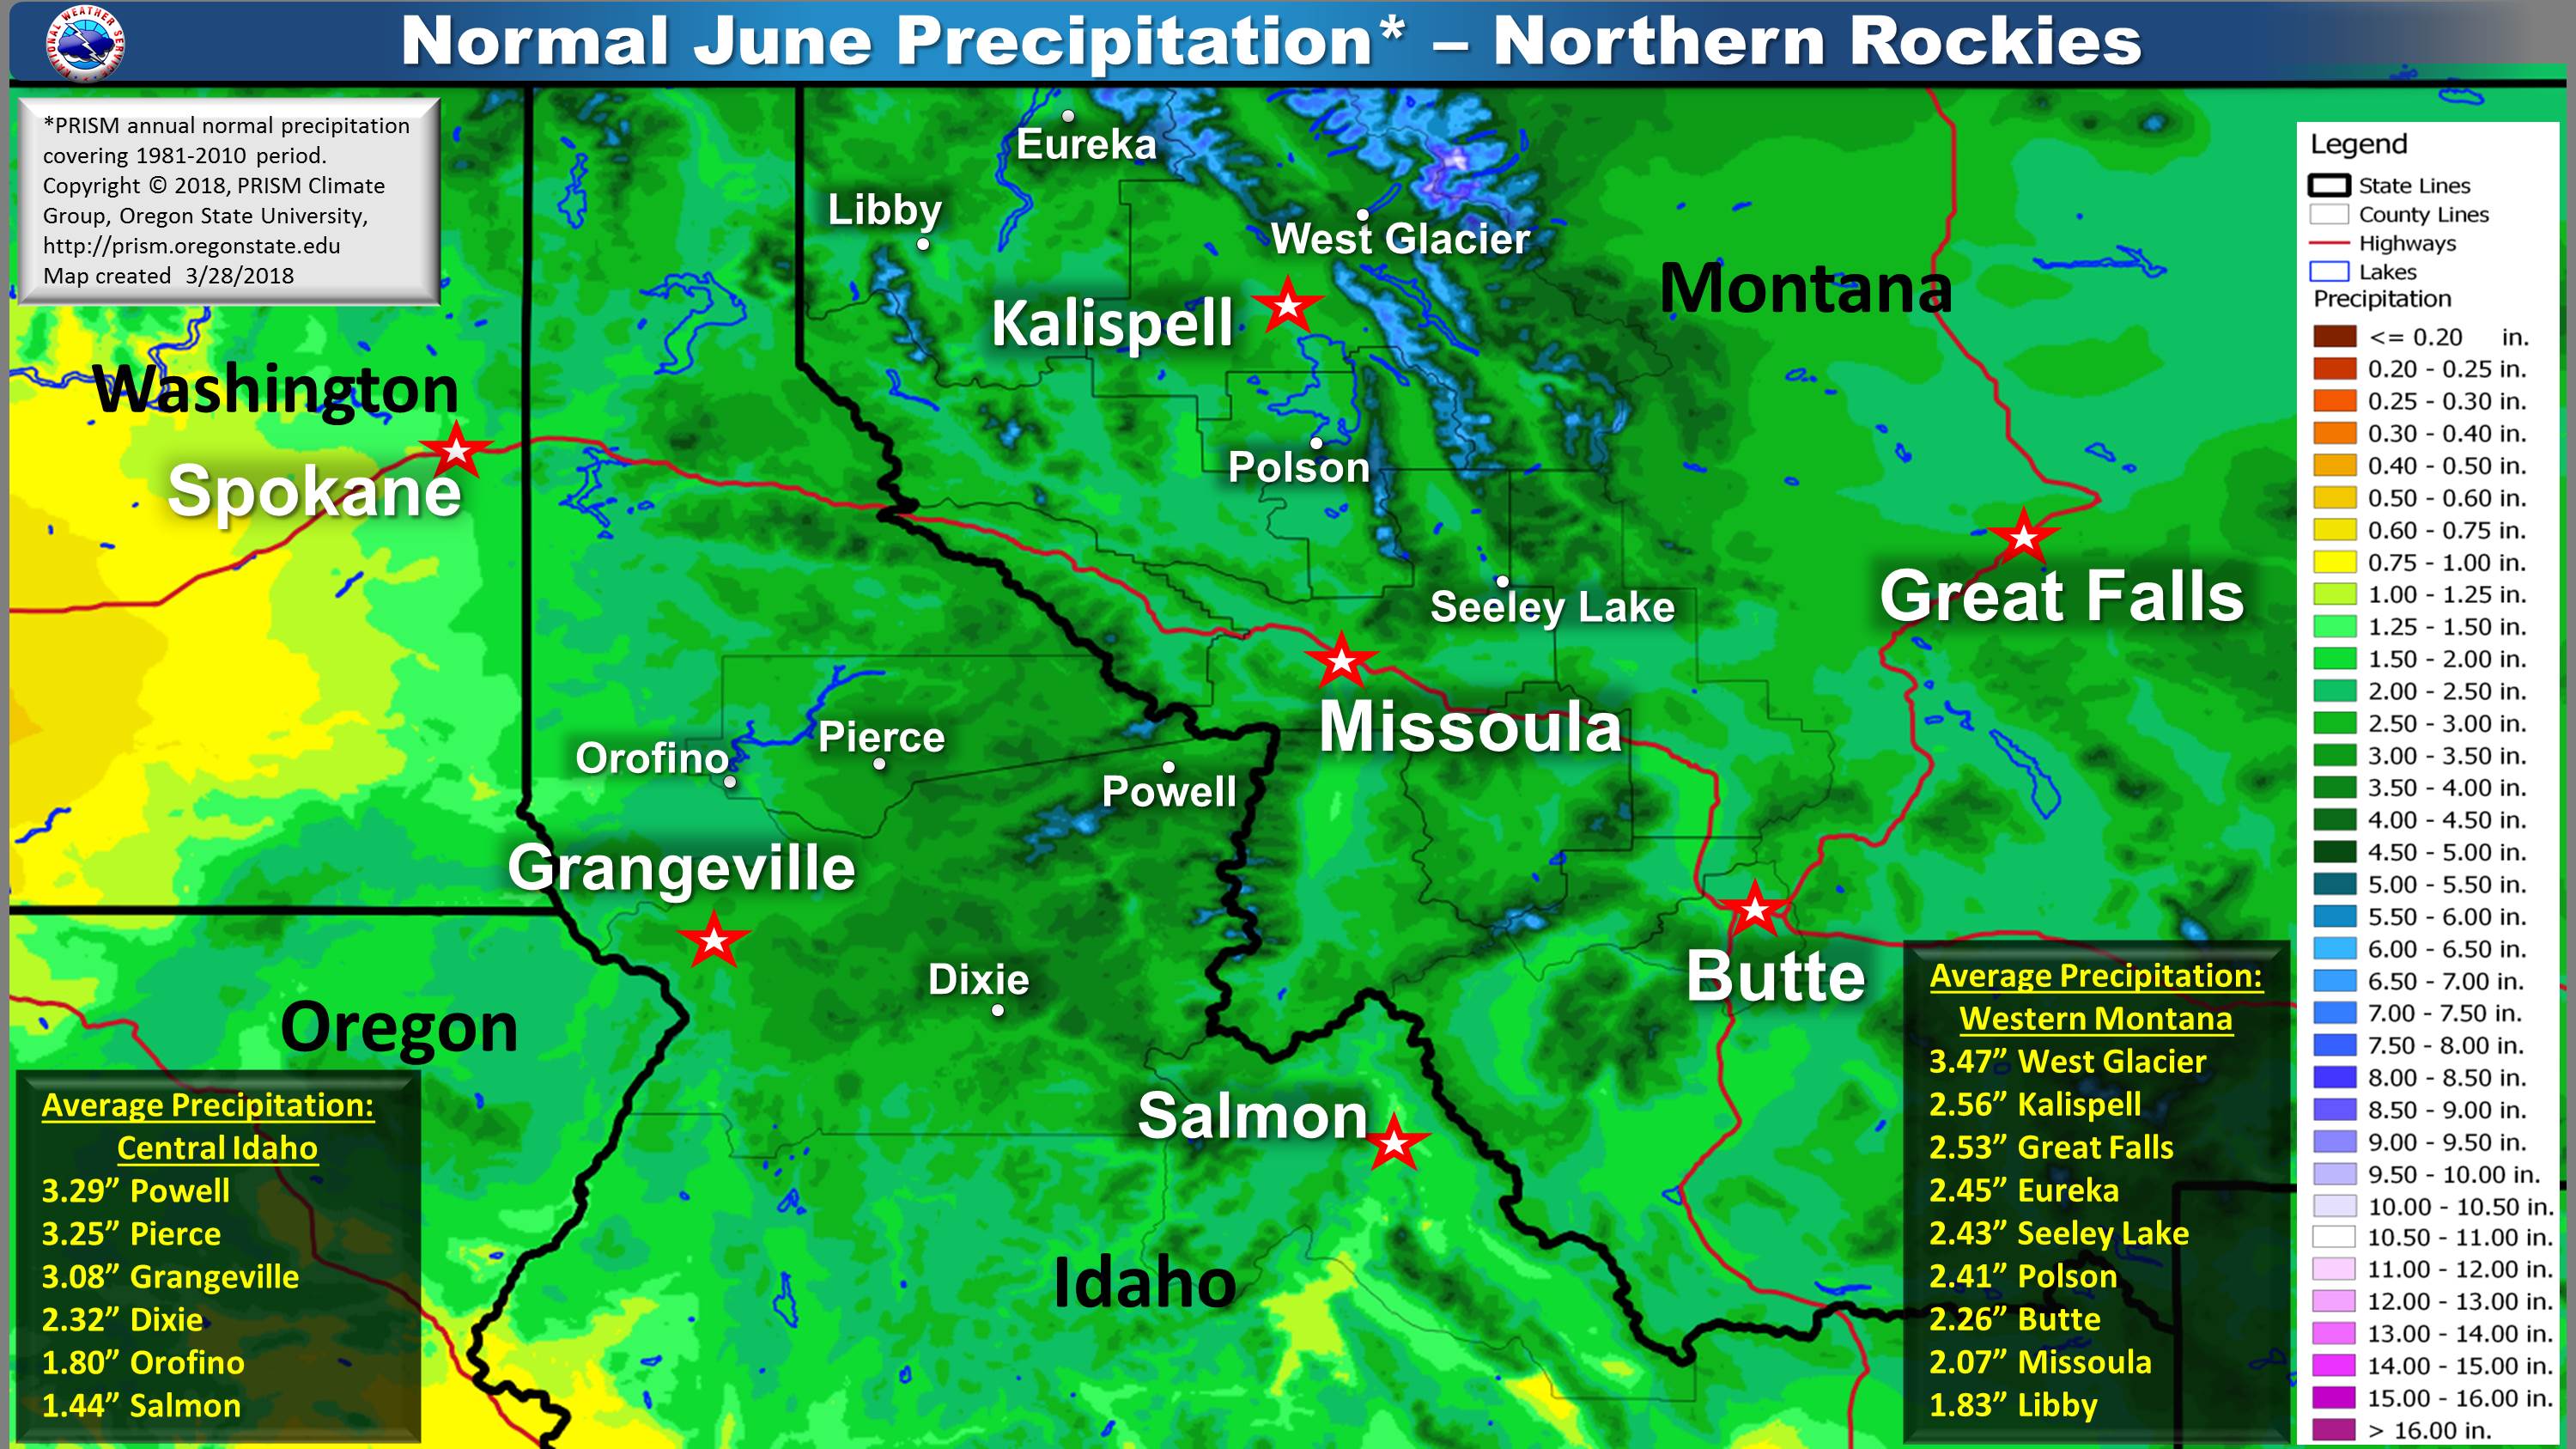 |
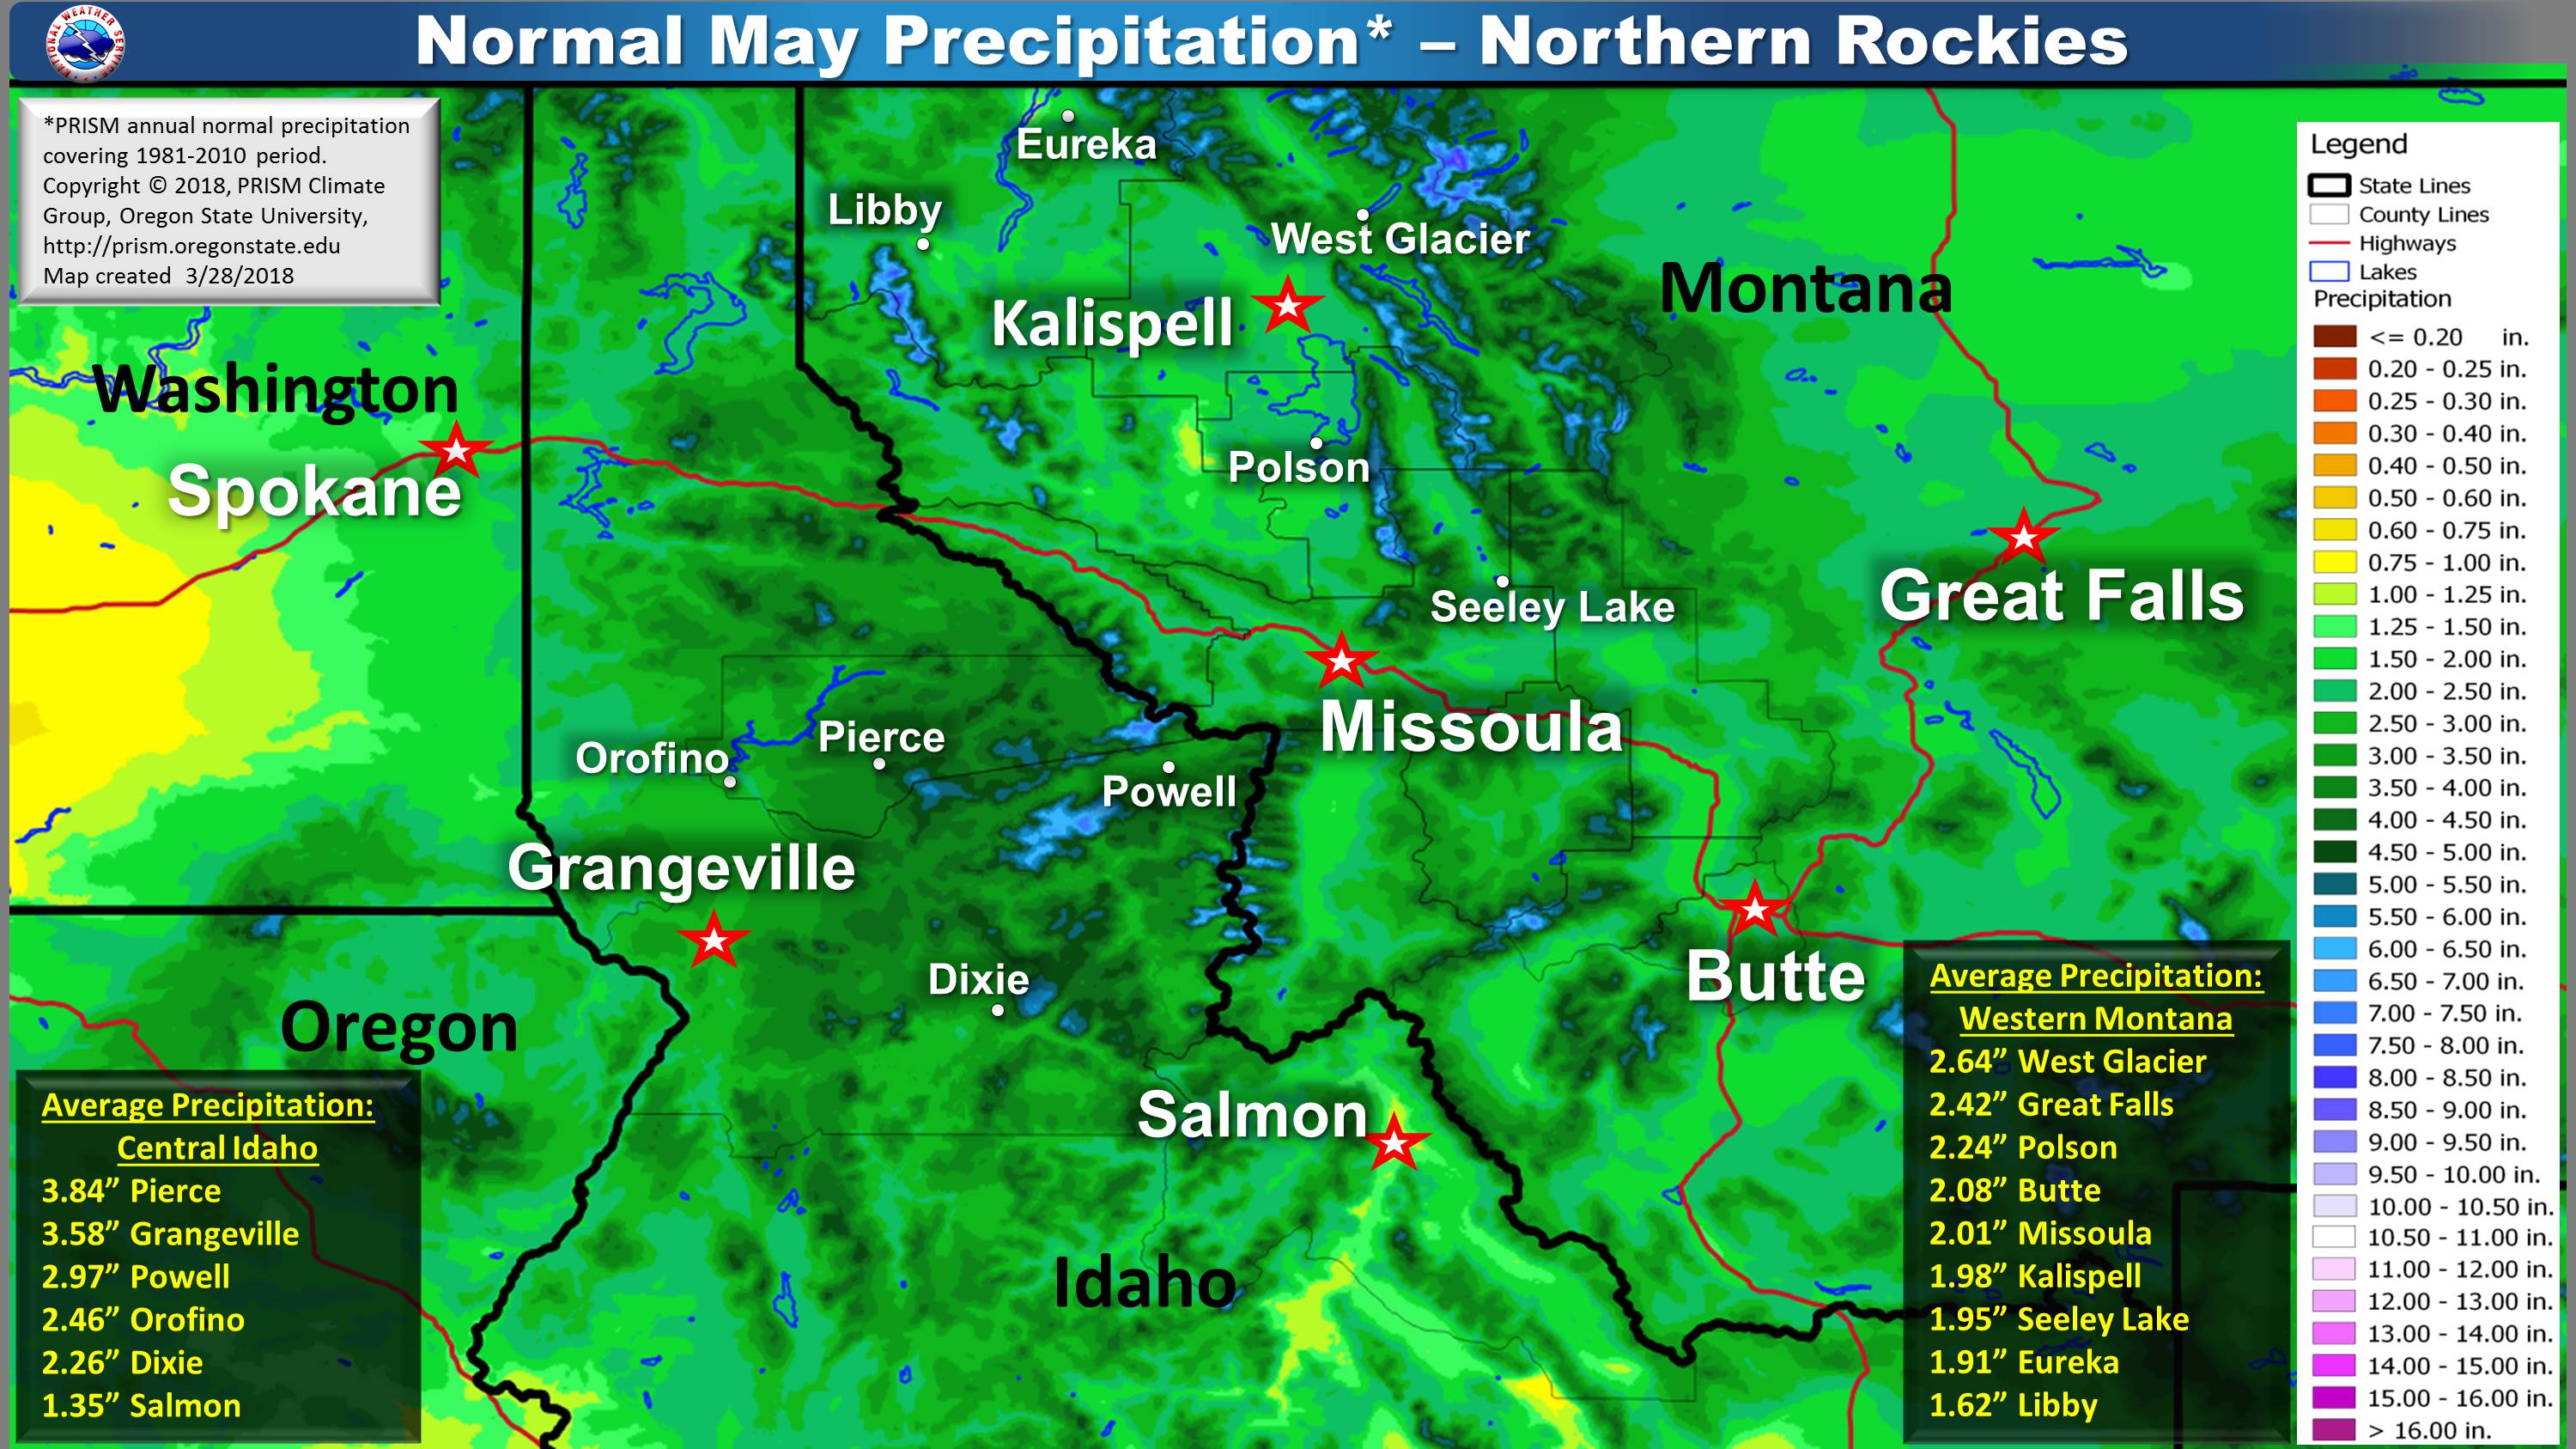
| May | June |
 |
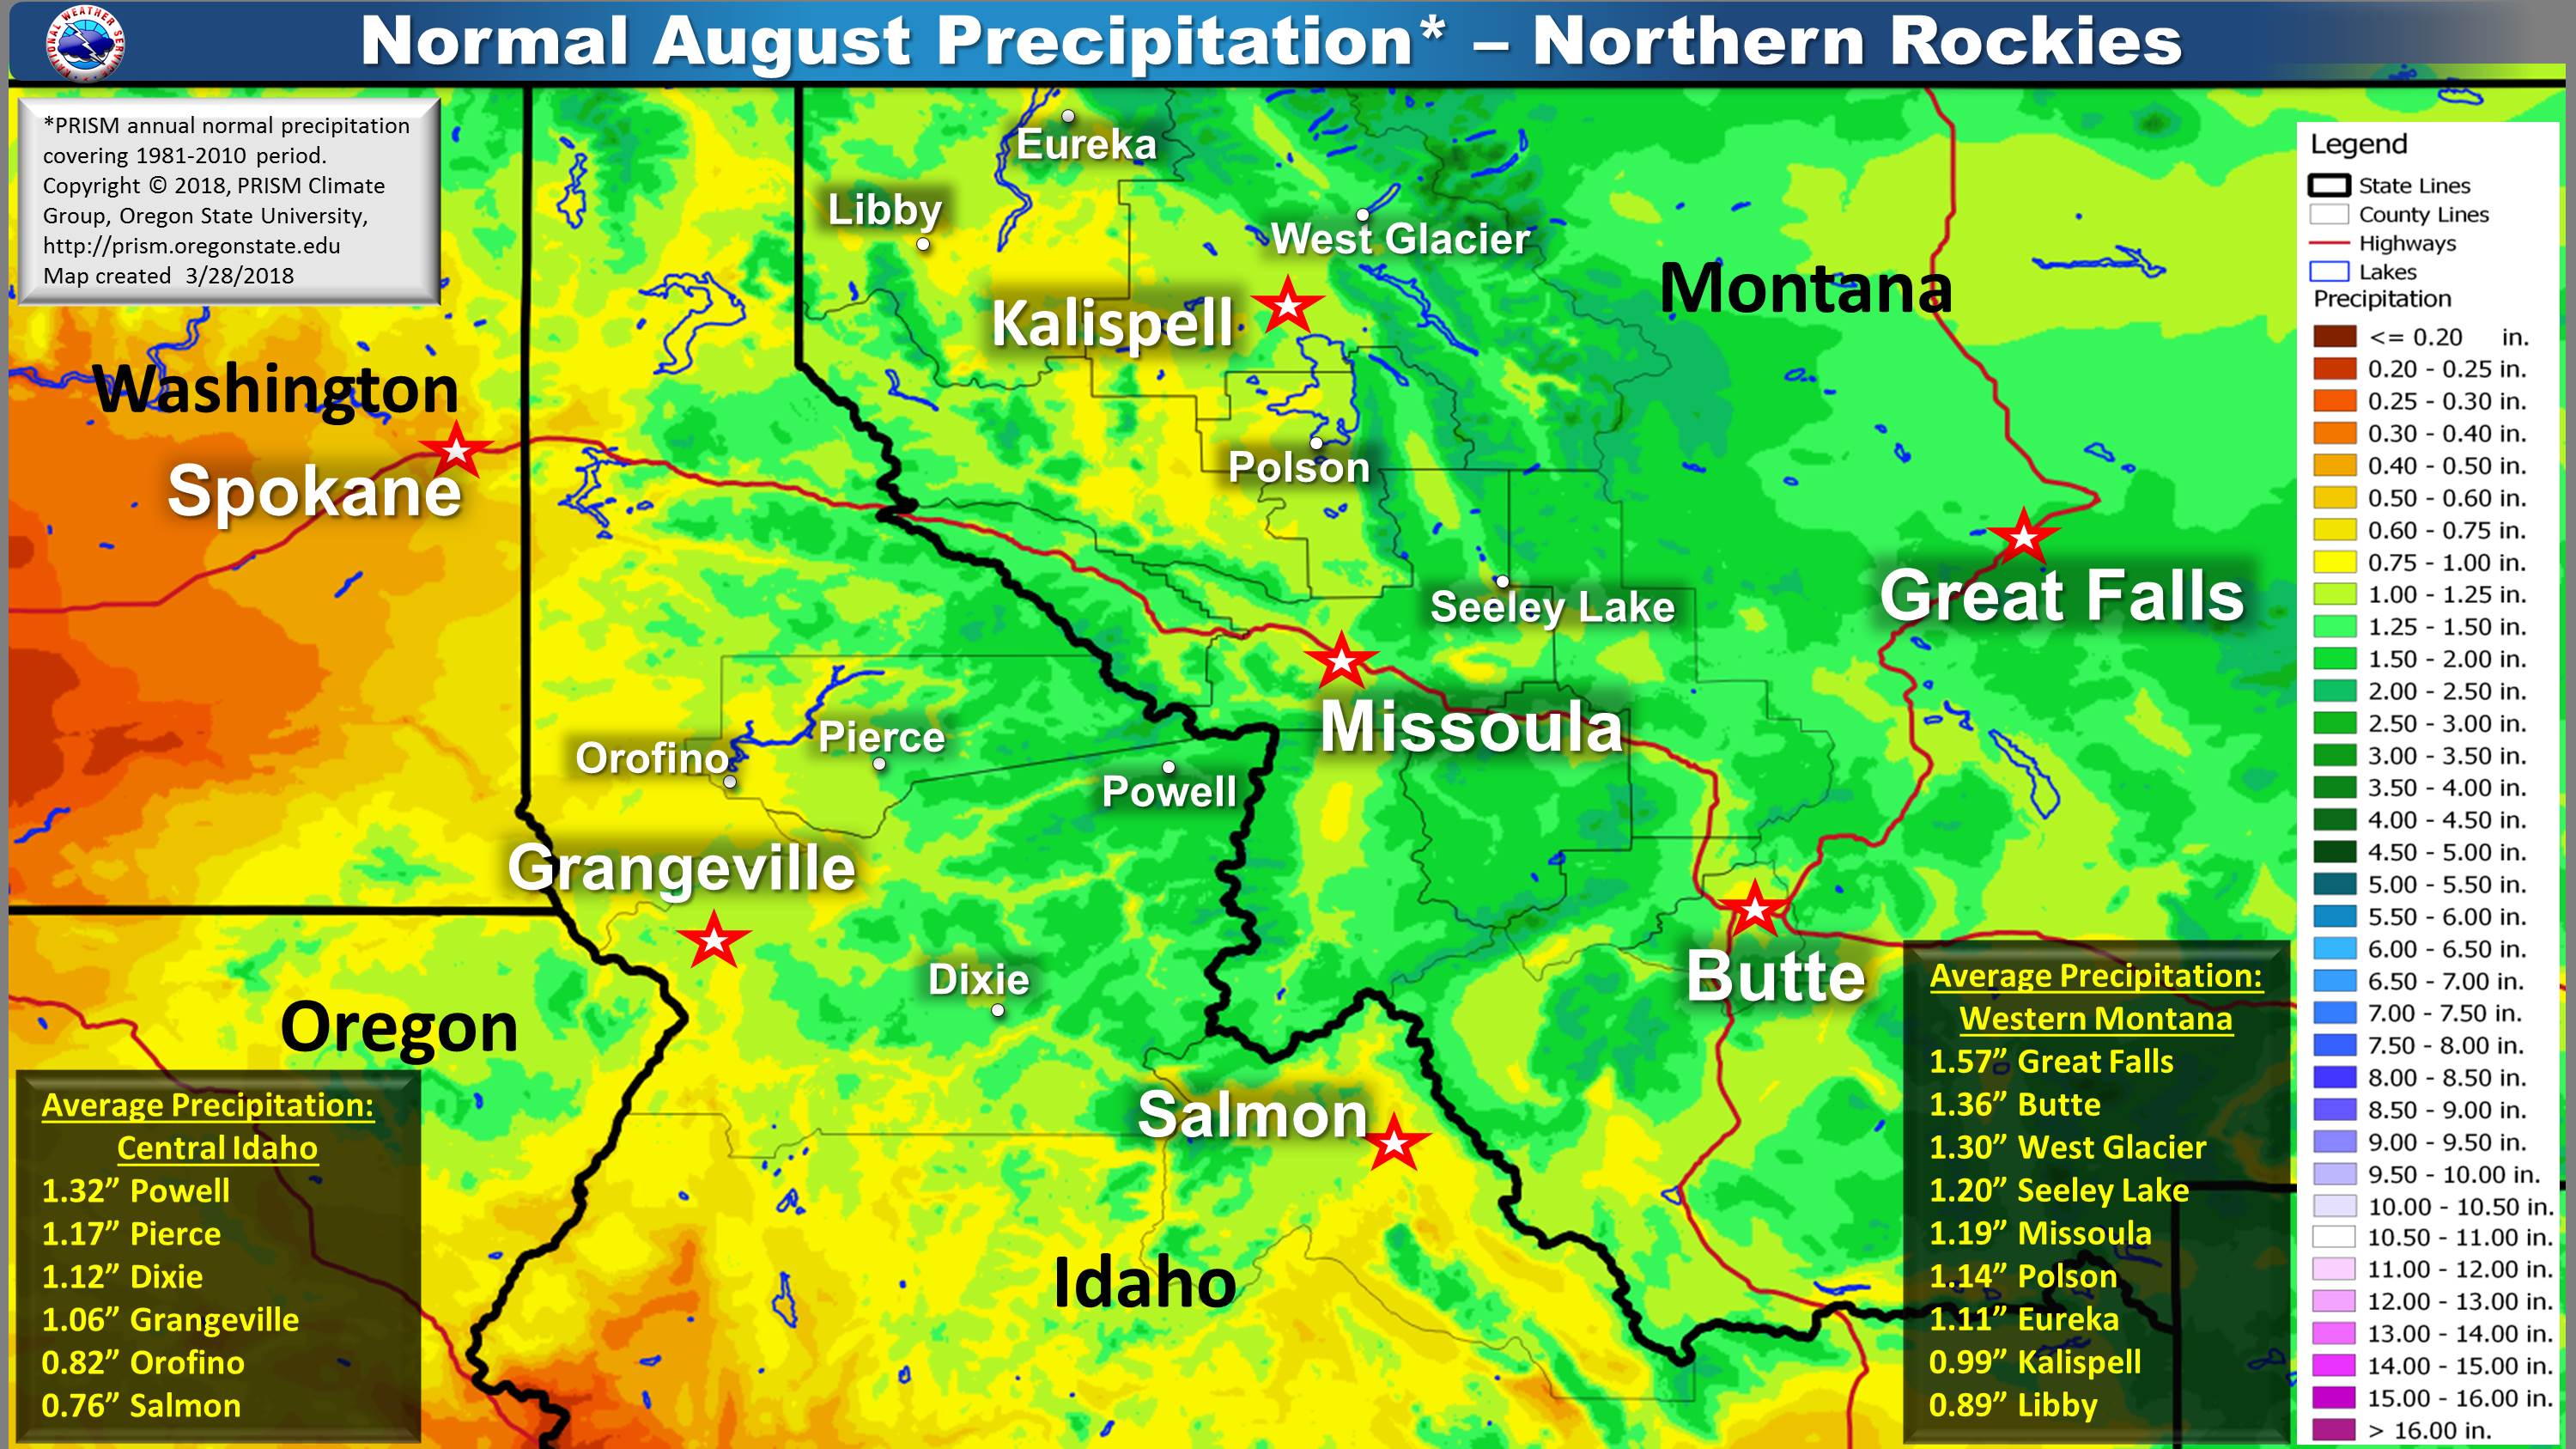 |
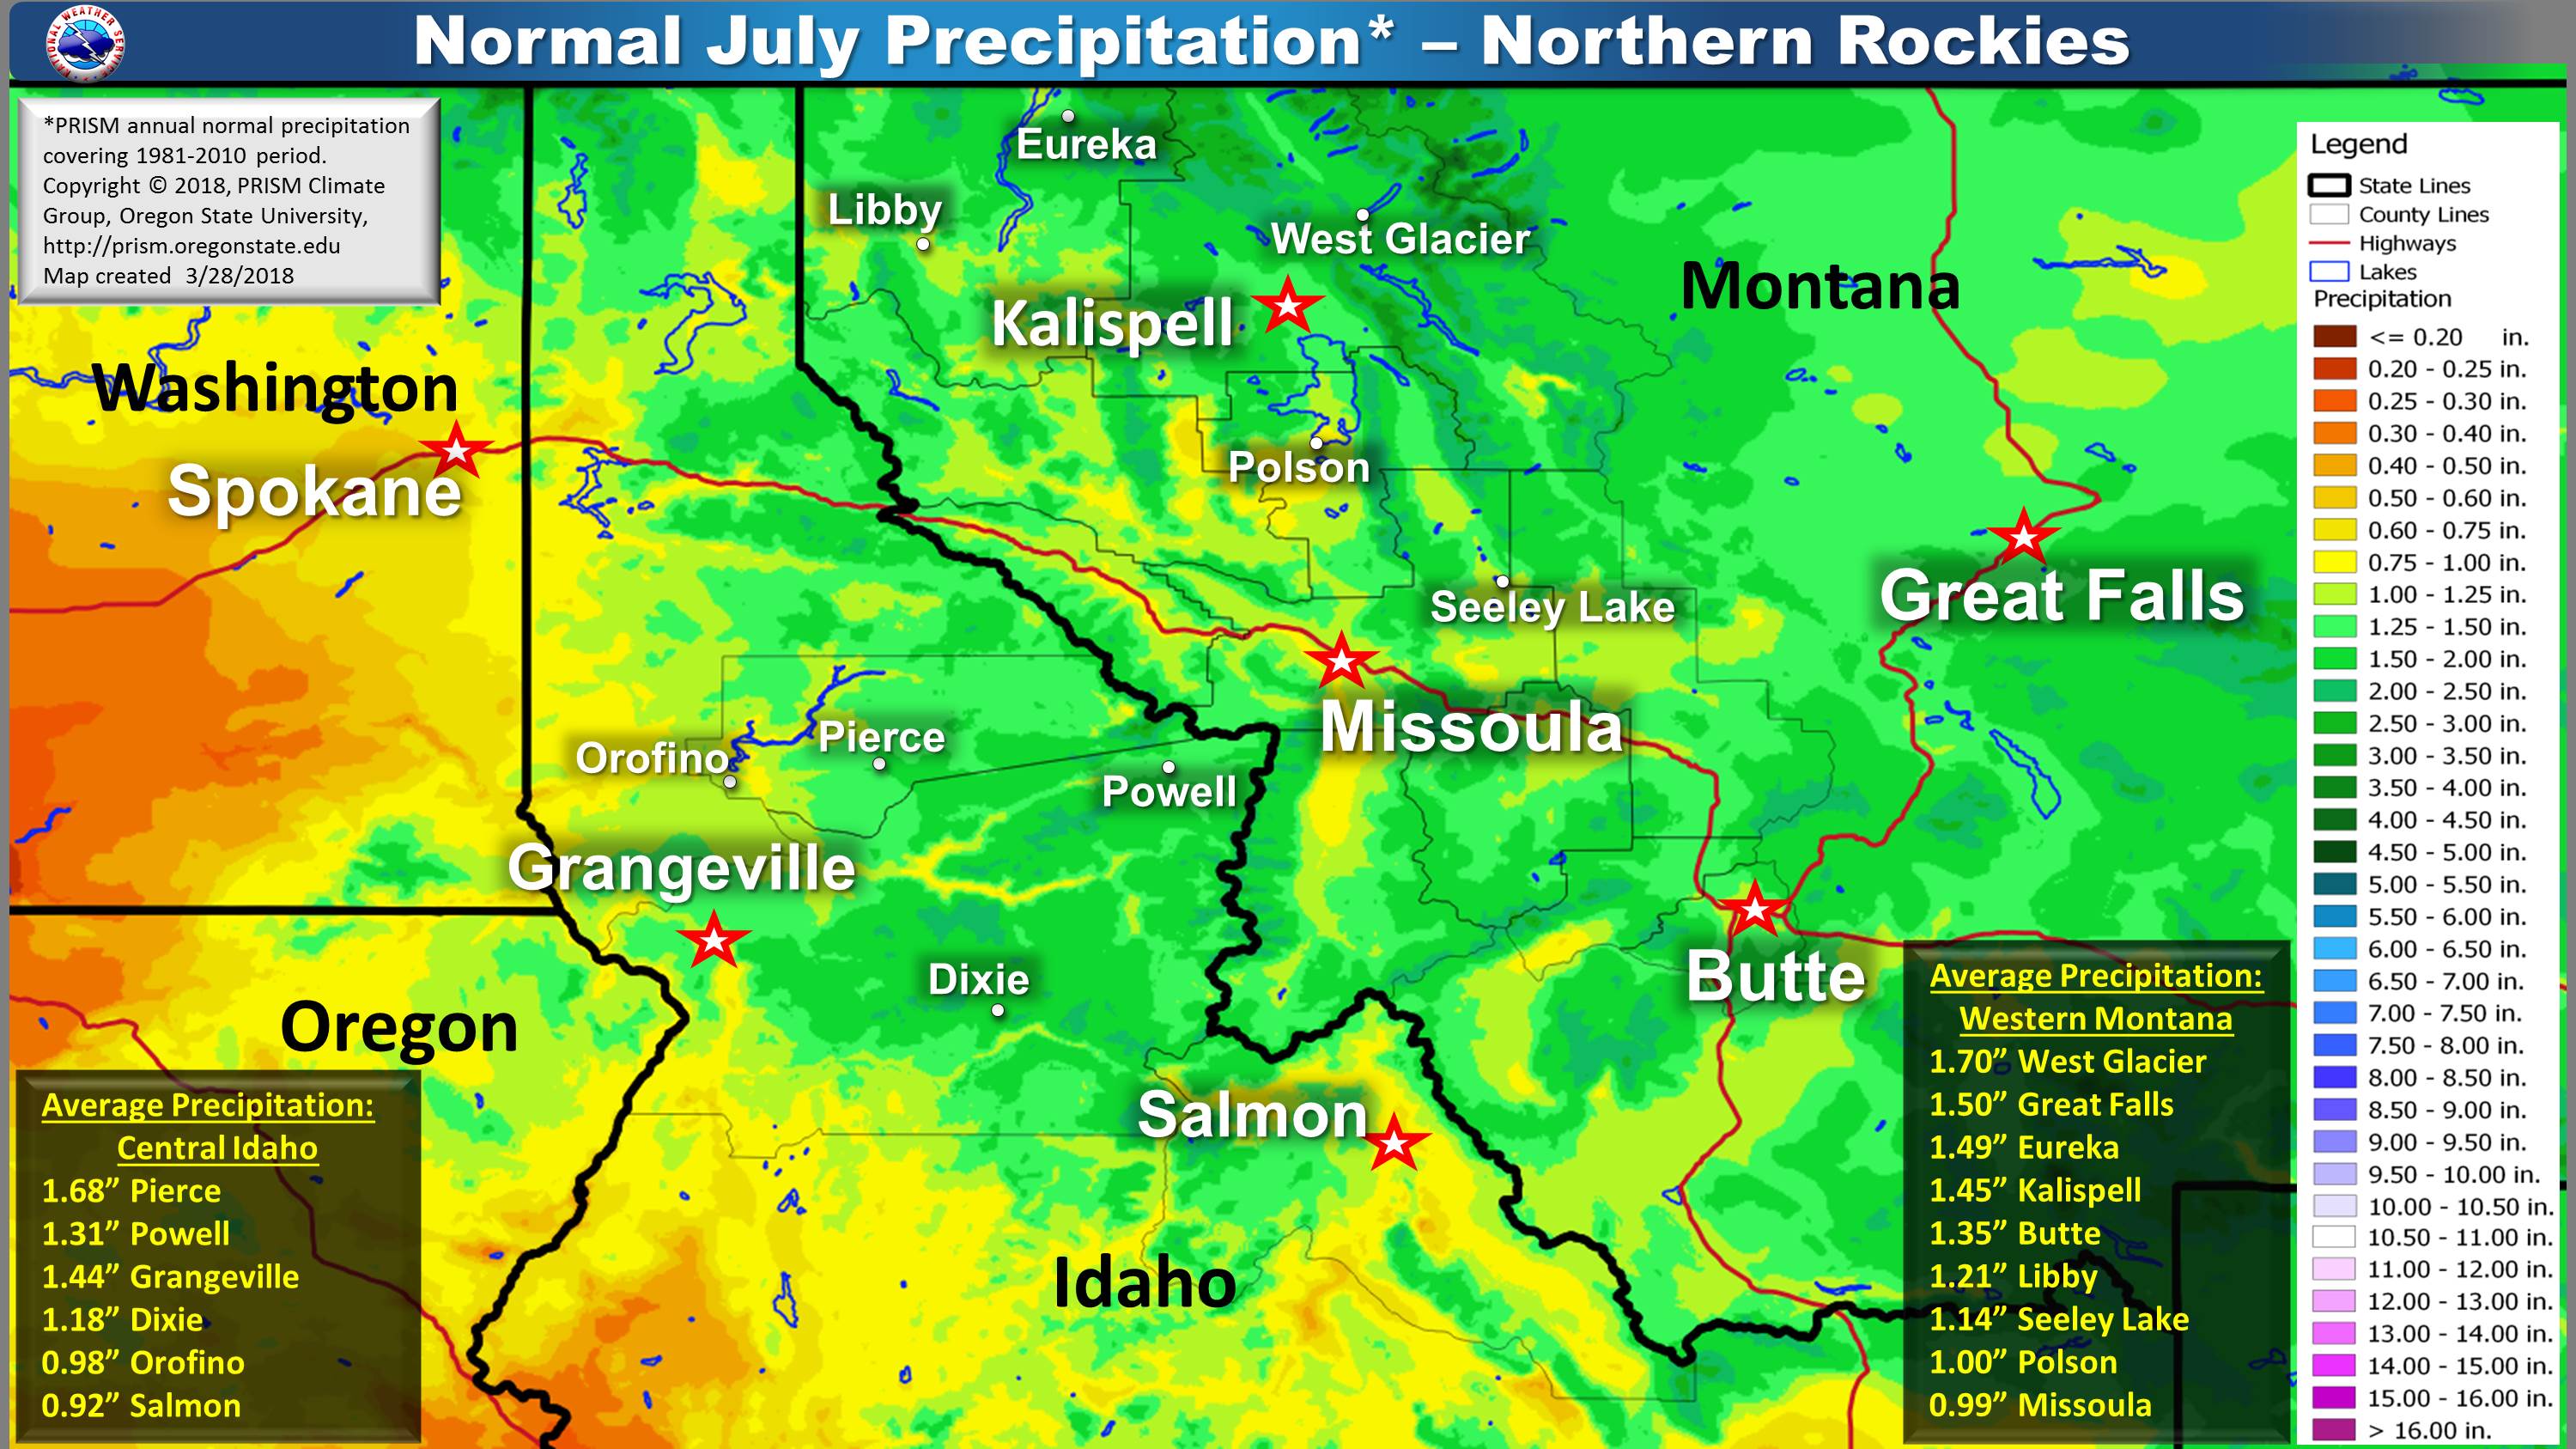
| July | August |
 |
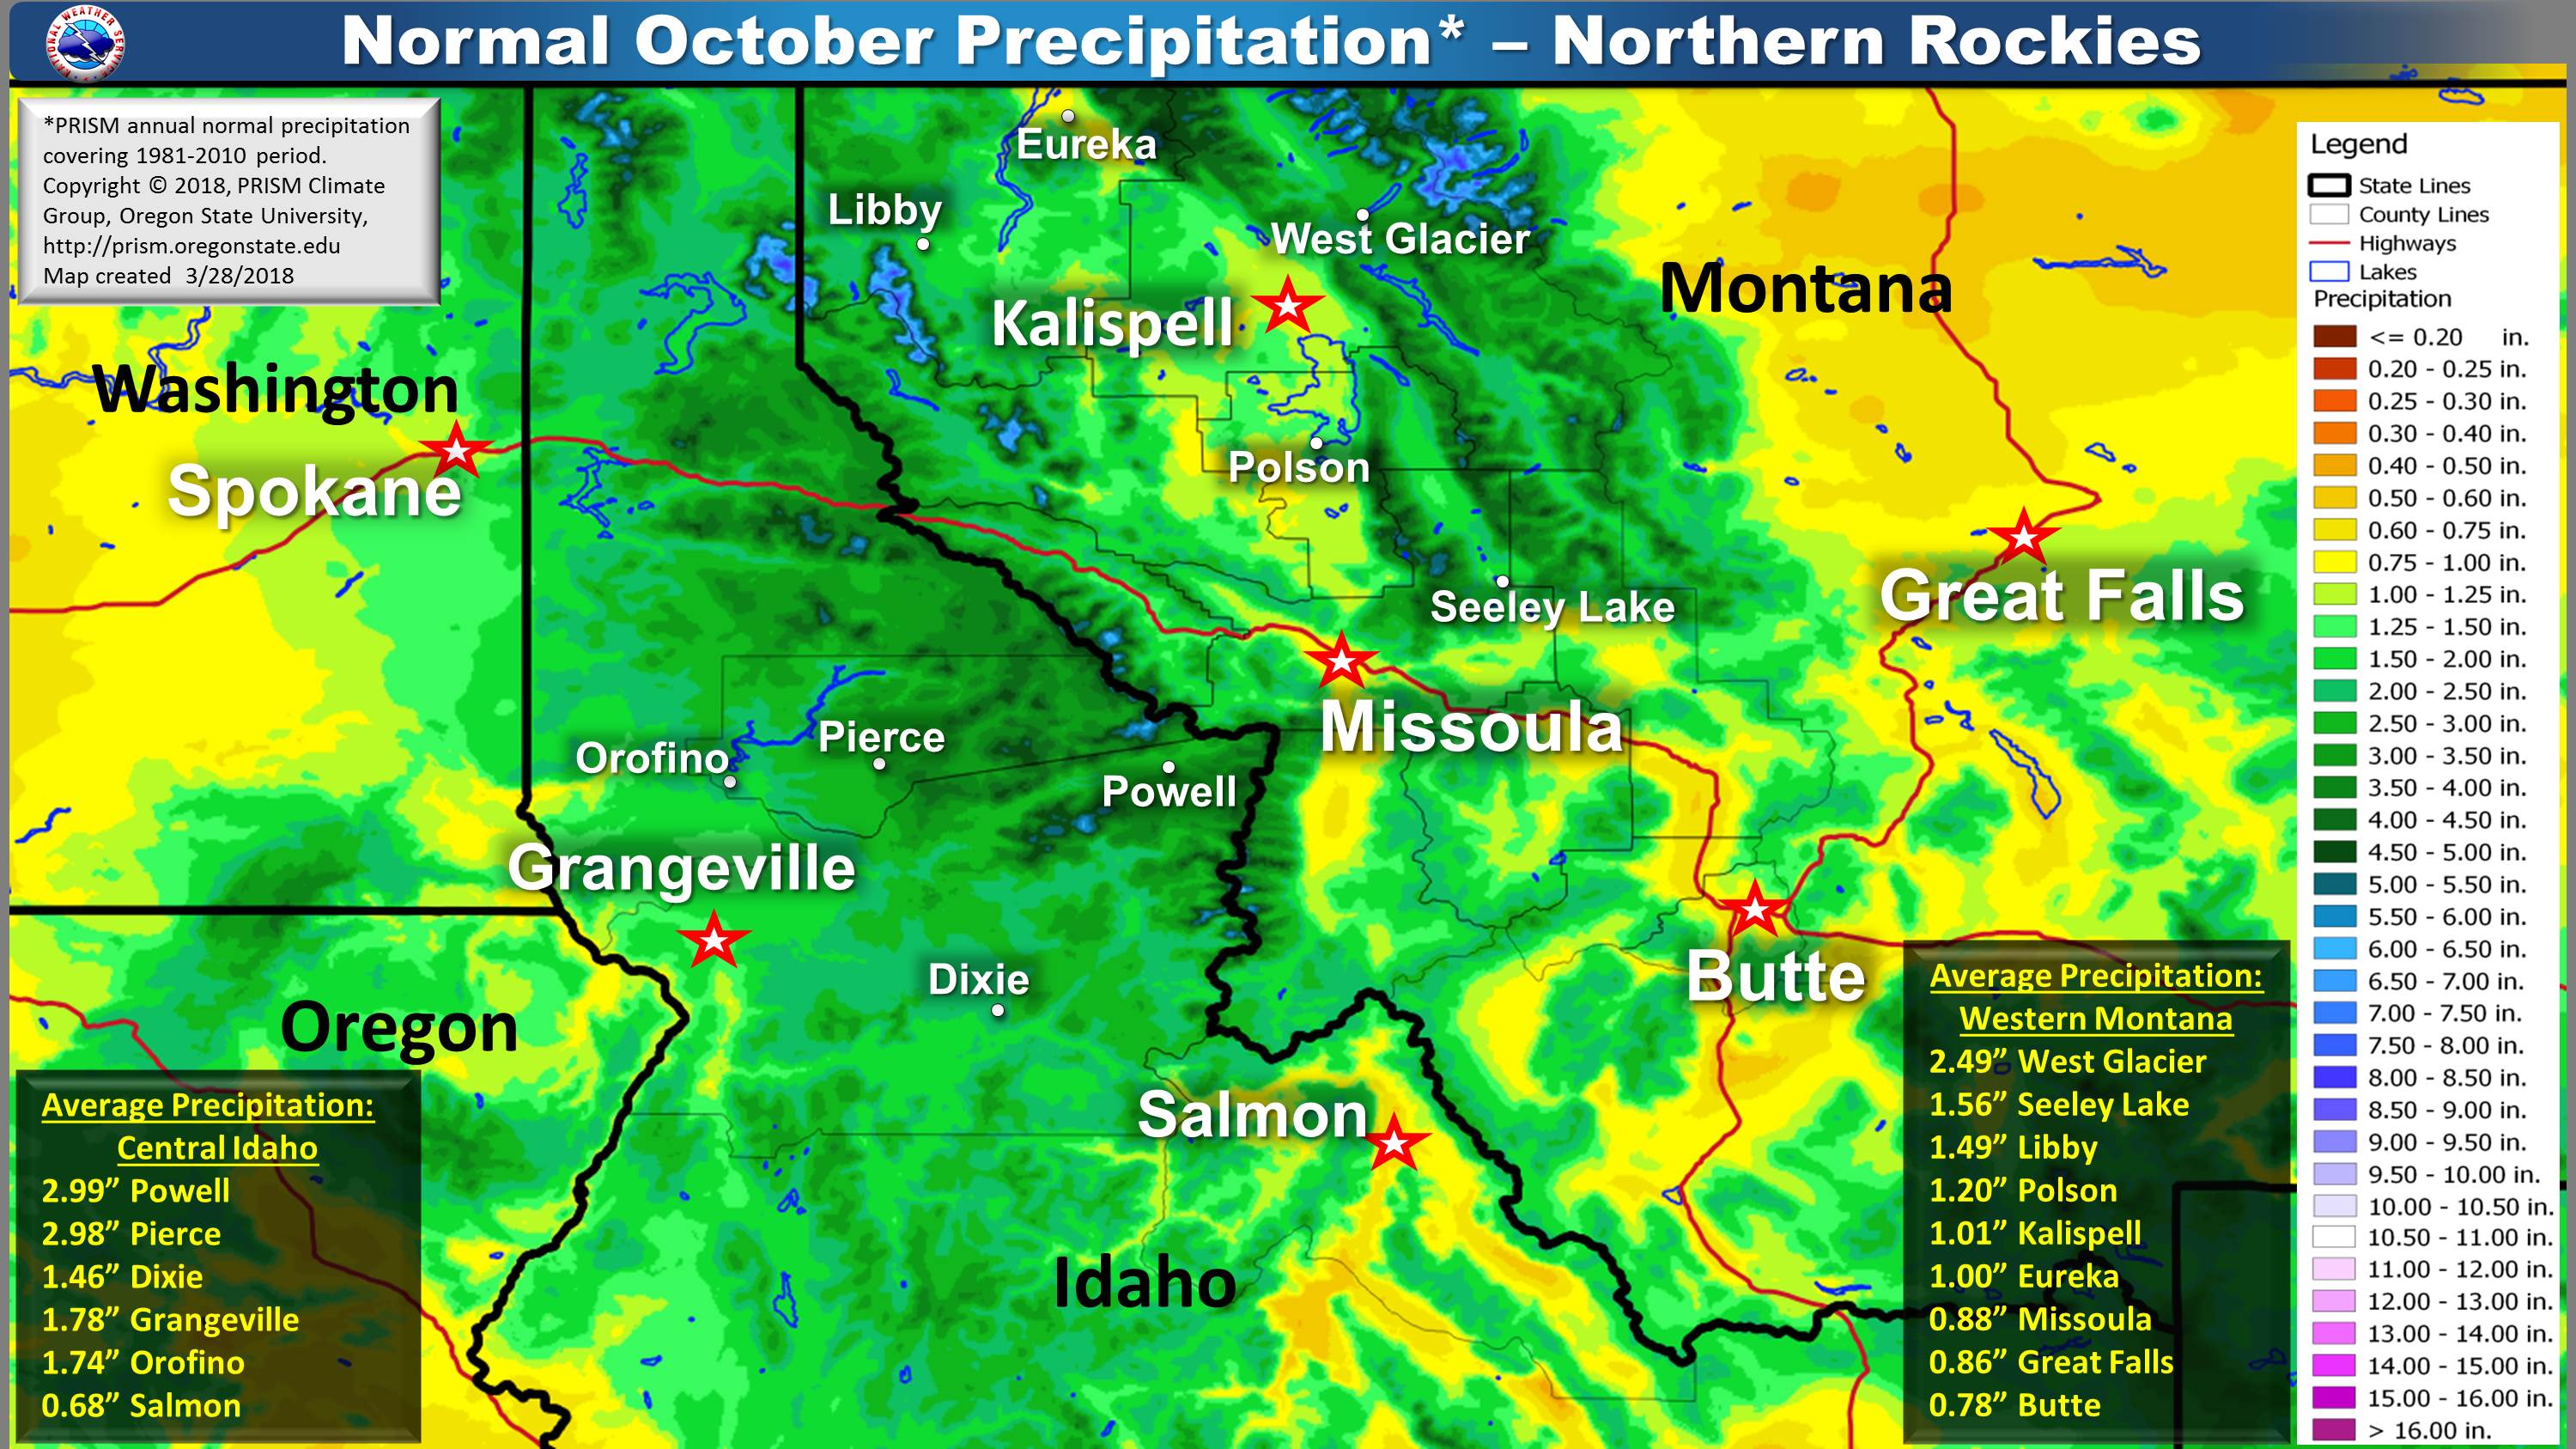 |
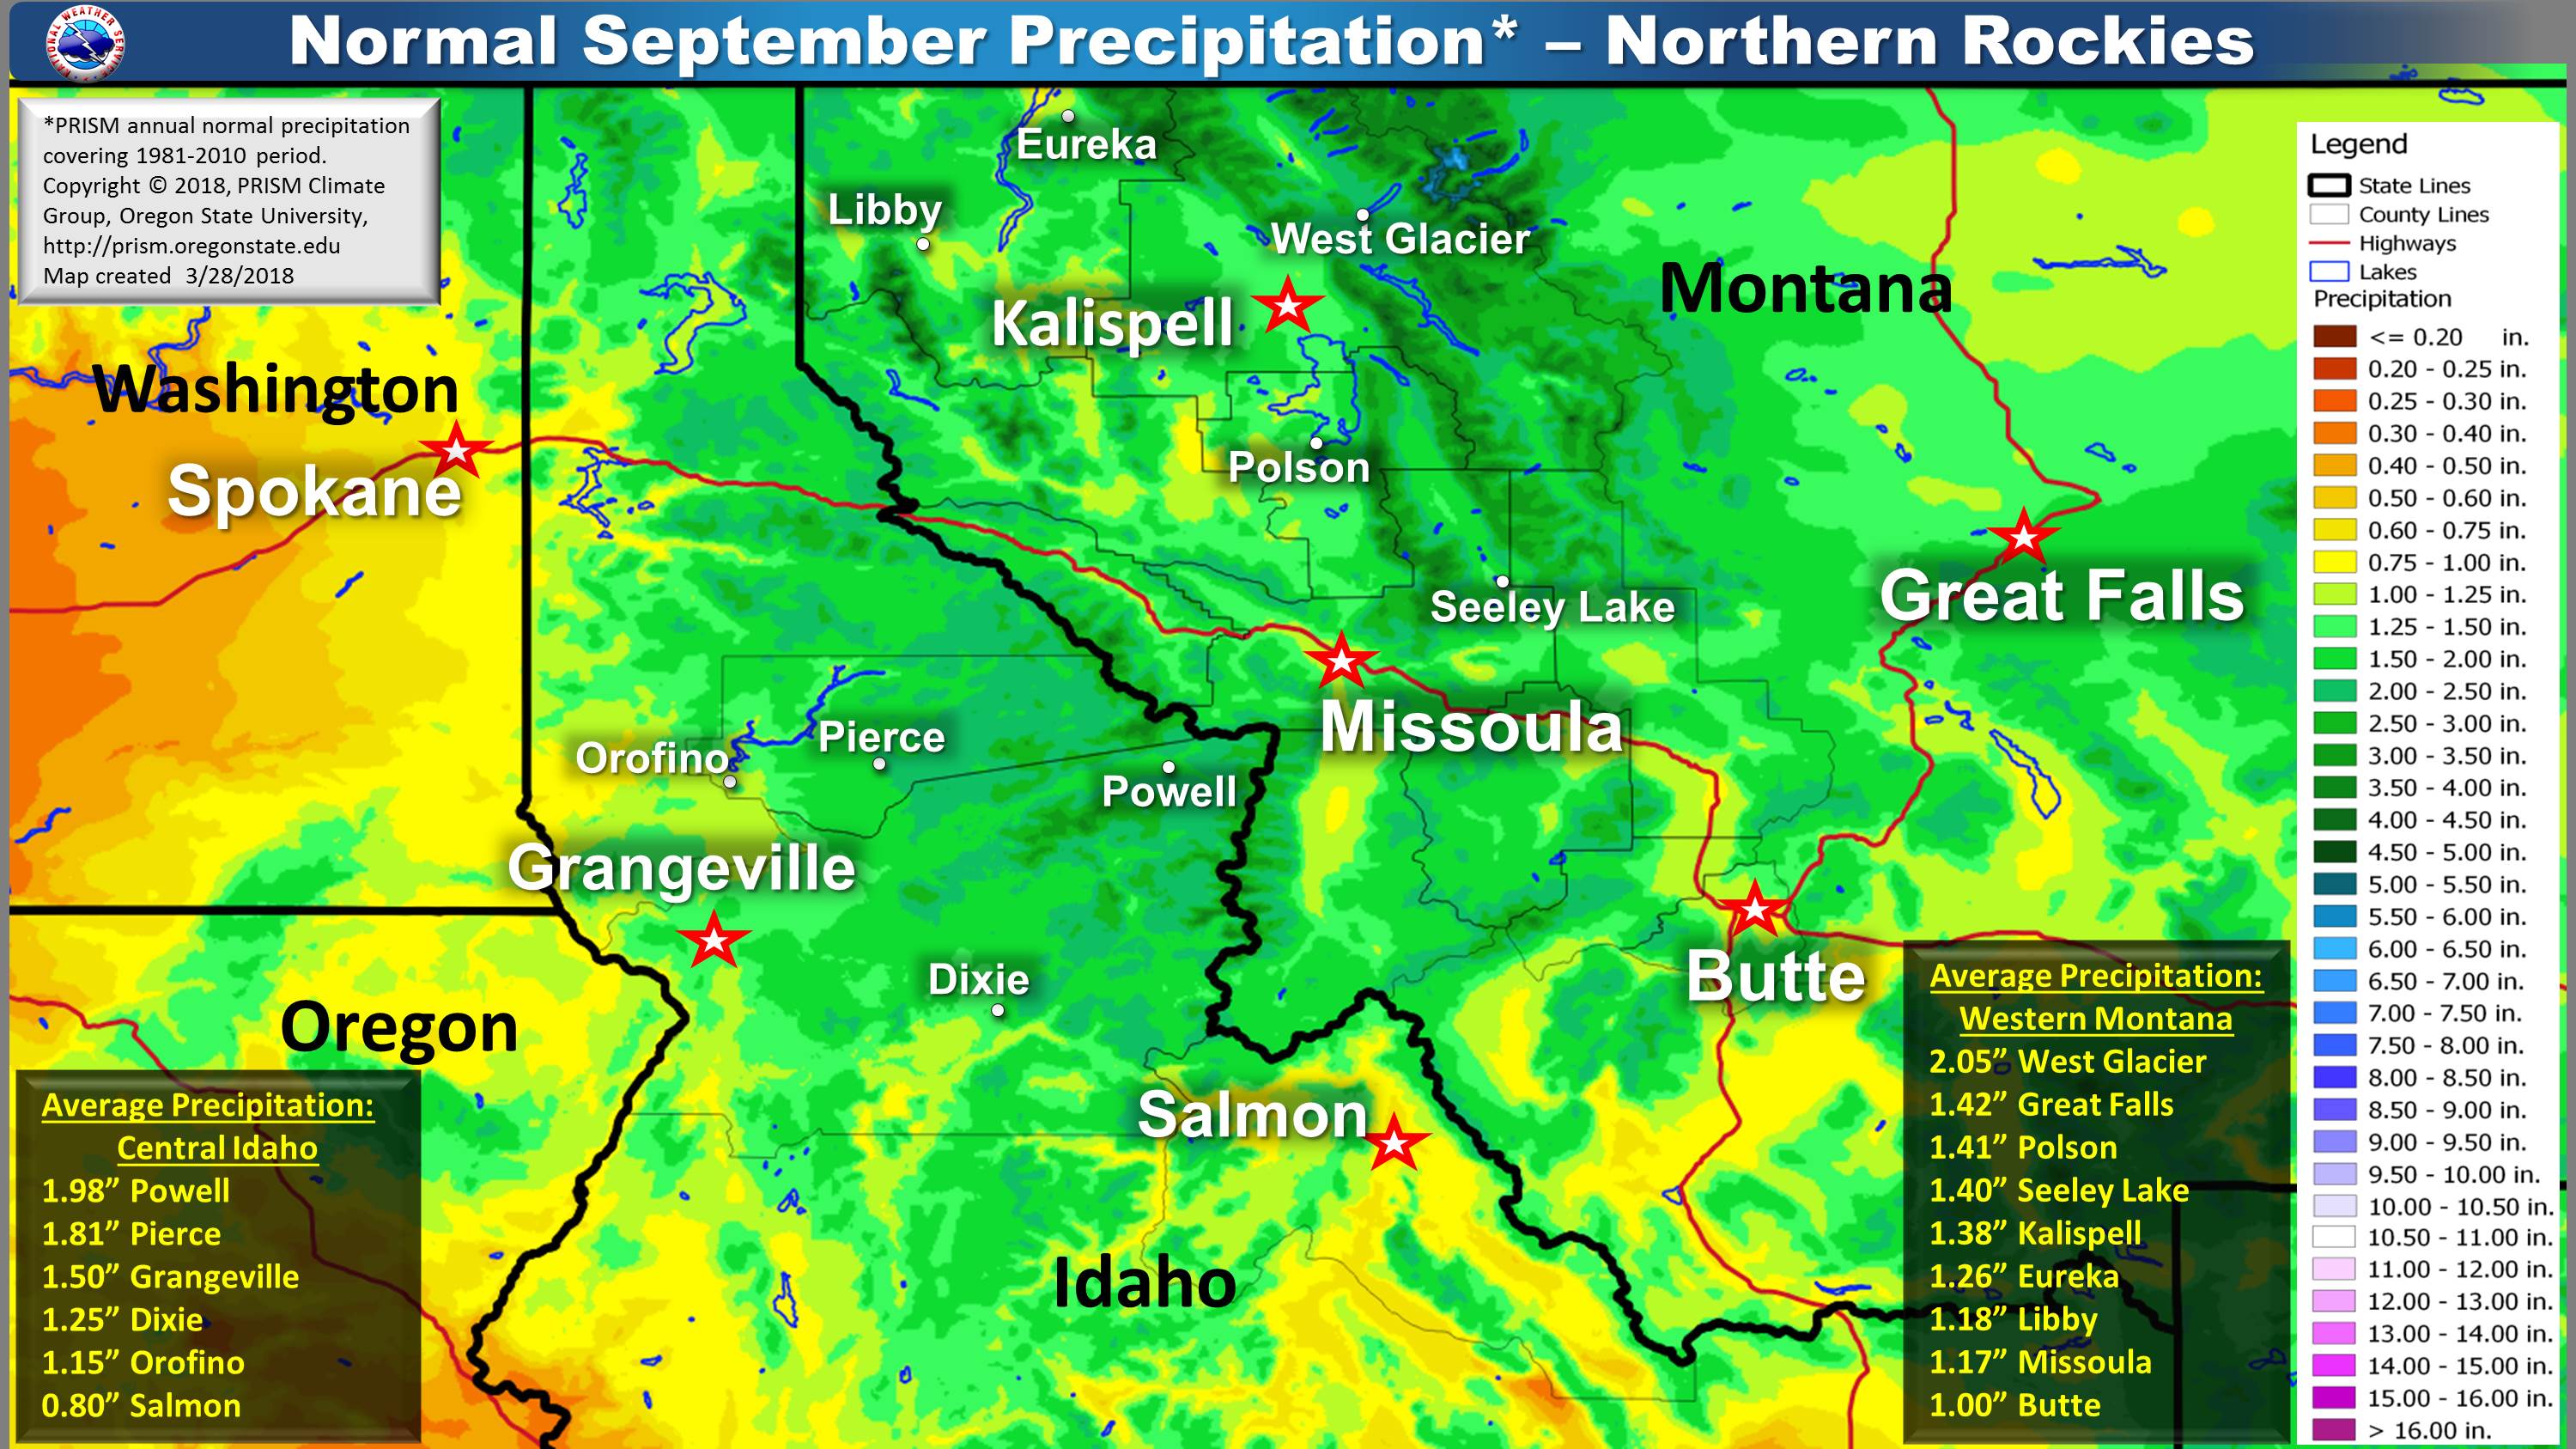
| September | October |
 |
 |
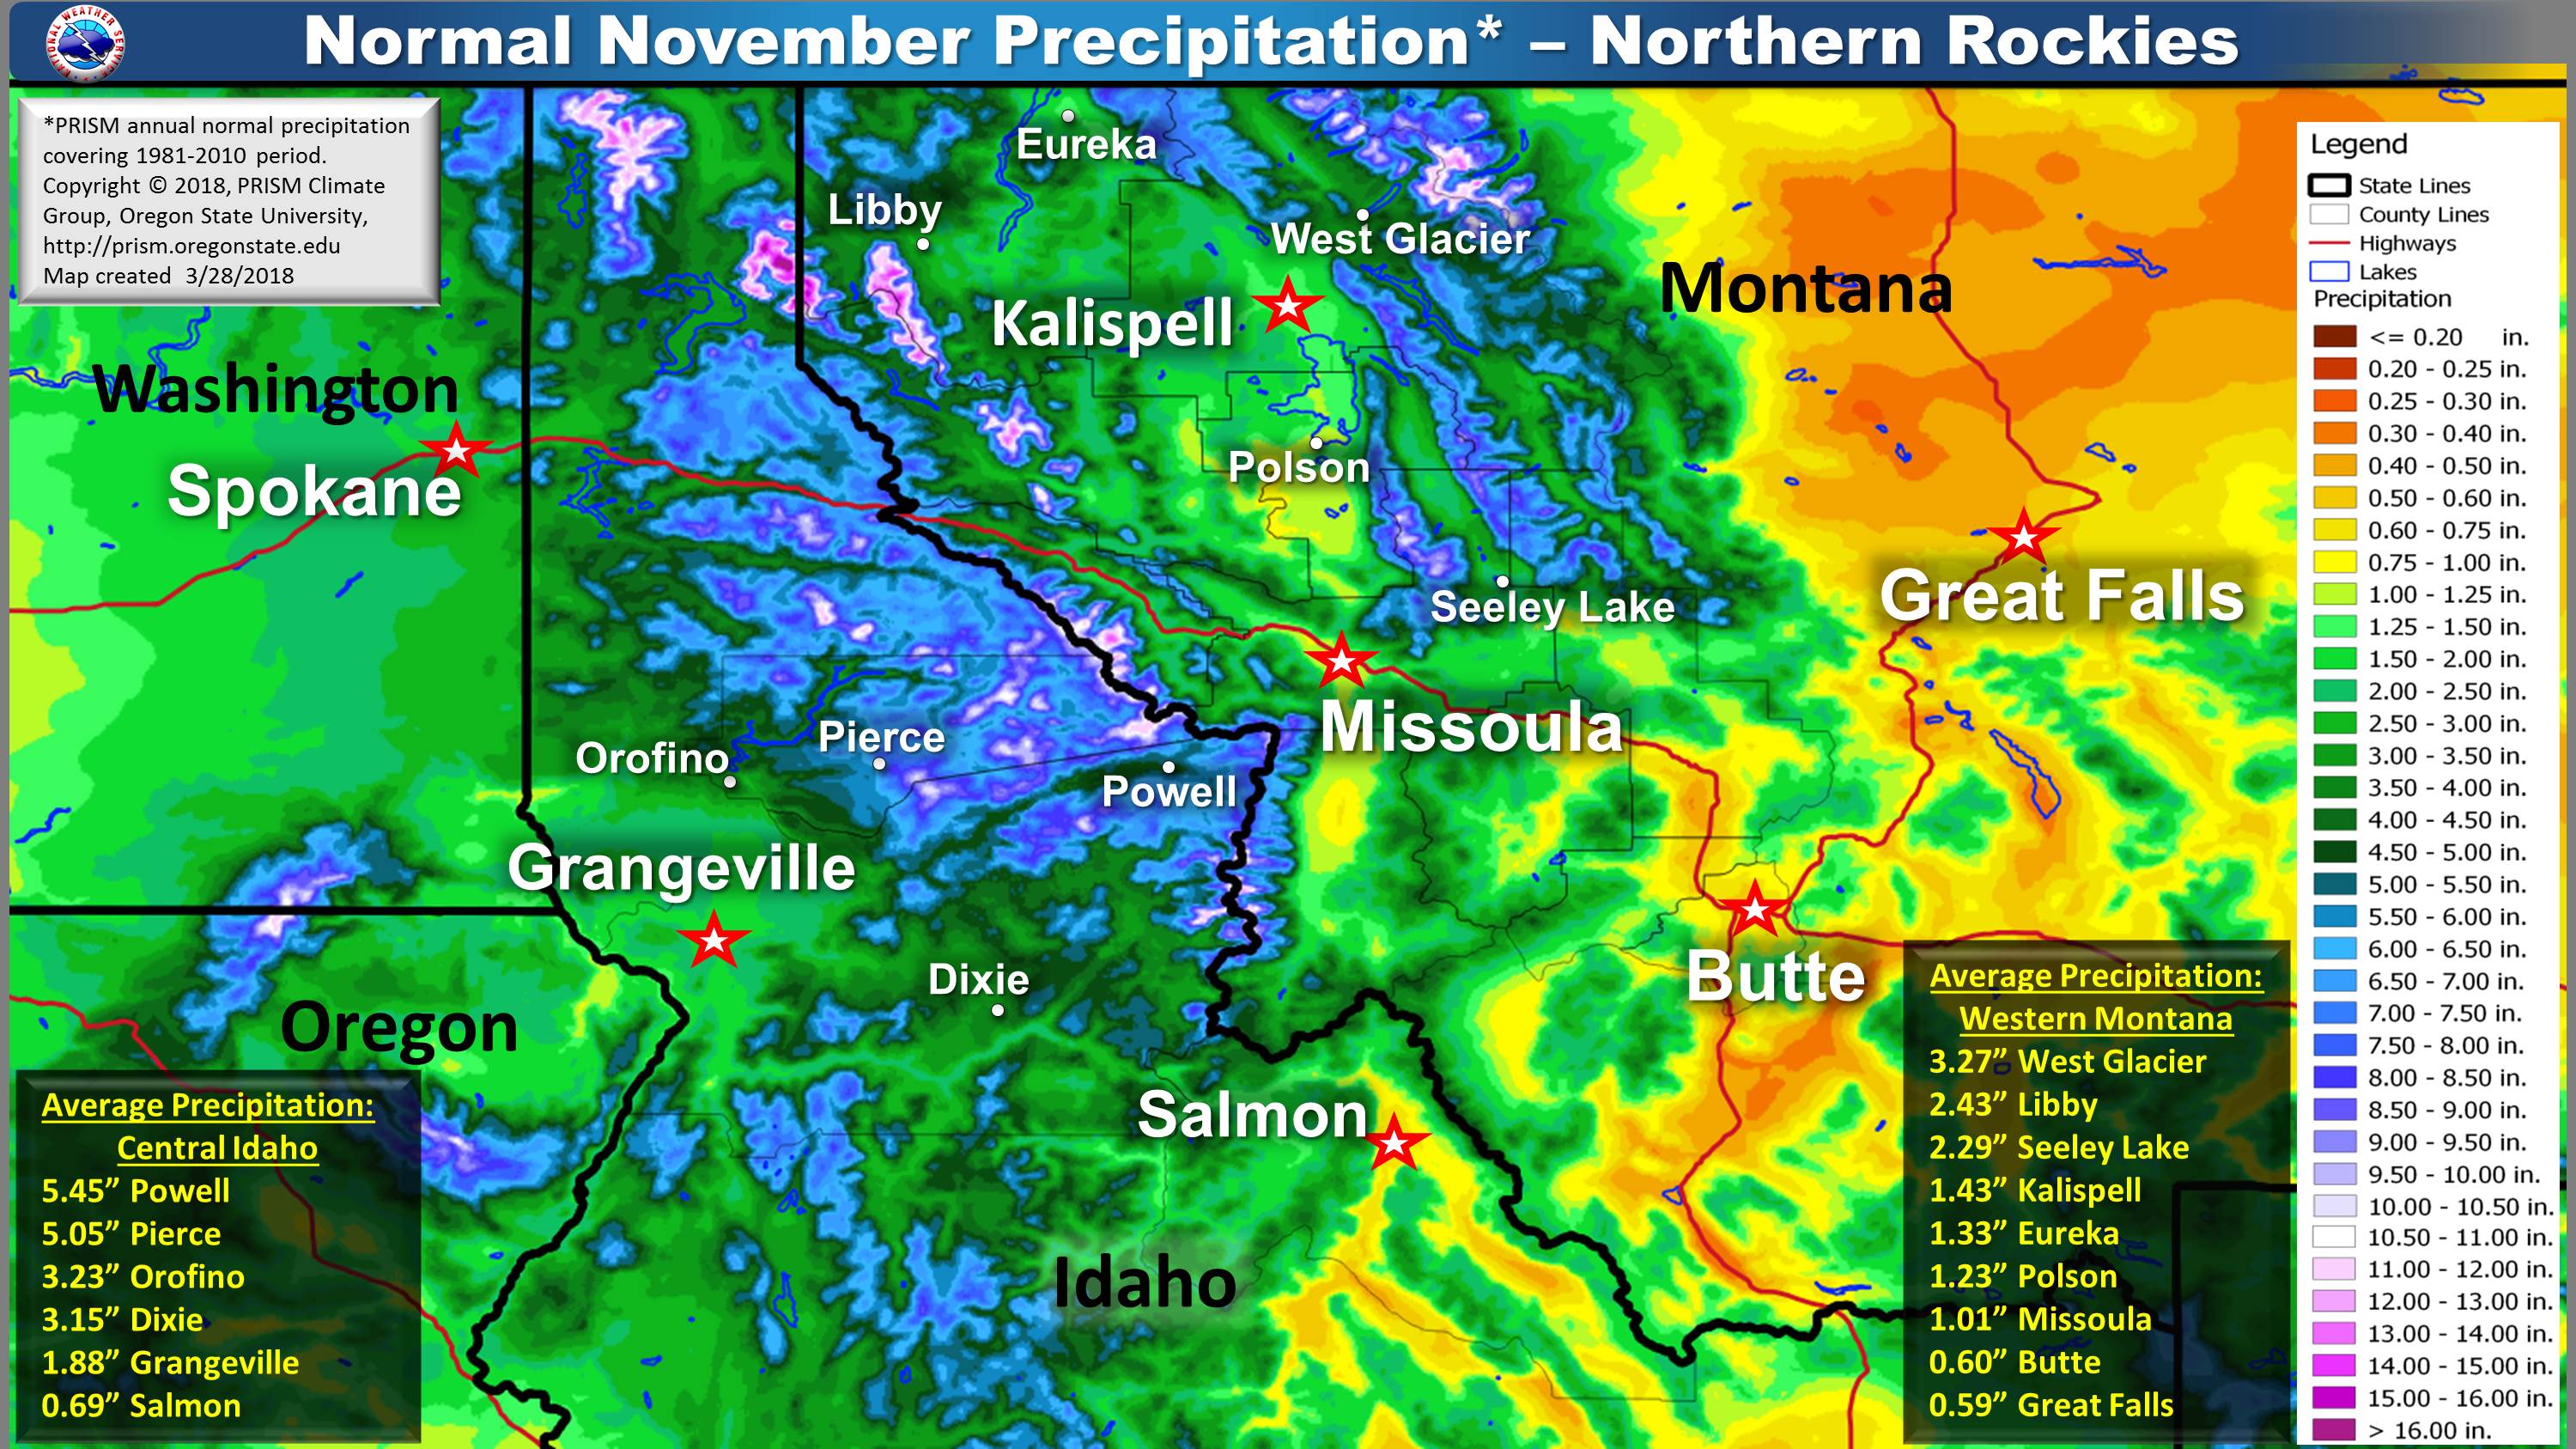
| November | December |
Sun and Moon
Tides and Currents
Time
The U.S. Naval Observatory (USNO) computes astronomical data. Therefore, the NWS does not record, certify, or authenticate astronomical data. Computed times of sunrise, sunset, moonrise, moonset; and twilight, moon phases and other astronomical data are available from USNO's Astronomical Applications Department (http://www.usno.navy.mil). See http://www.usno.navy.mil/USNO/astronomical-applications/astronomical-information-center/litigation for information on using these data for legal purposes.

