
A frontal system is expected to bring showers and thunderstorms along the Gulf Coast and Southeast, and some snow and/or freezing rain/drizzle over the southern Mid-Atlantic into the morning. A series of Clipper systems will bring periods of snow to the Northern Plains and Great Lakes over the next couple of days. Read More >
Overview - Atmospheric Rivers - December 26, 2022 - January 17, 2023
A parade of storms battered the West Coast from late December through mid January
|
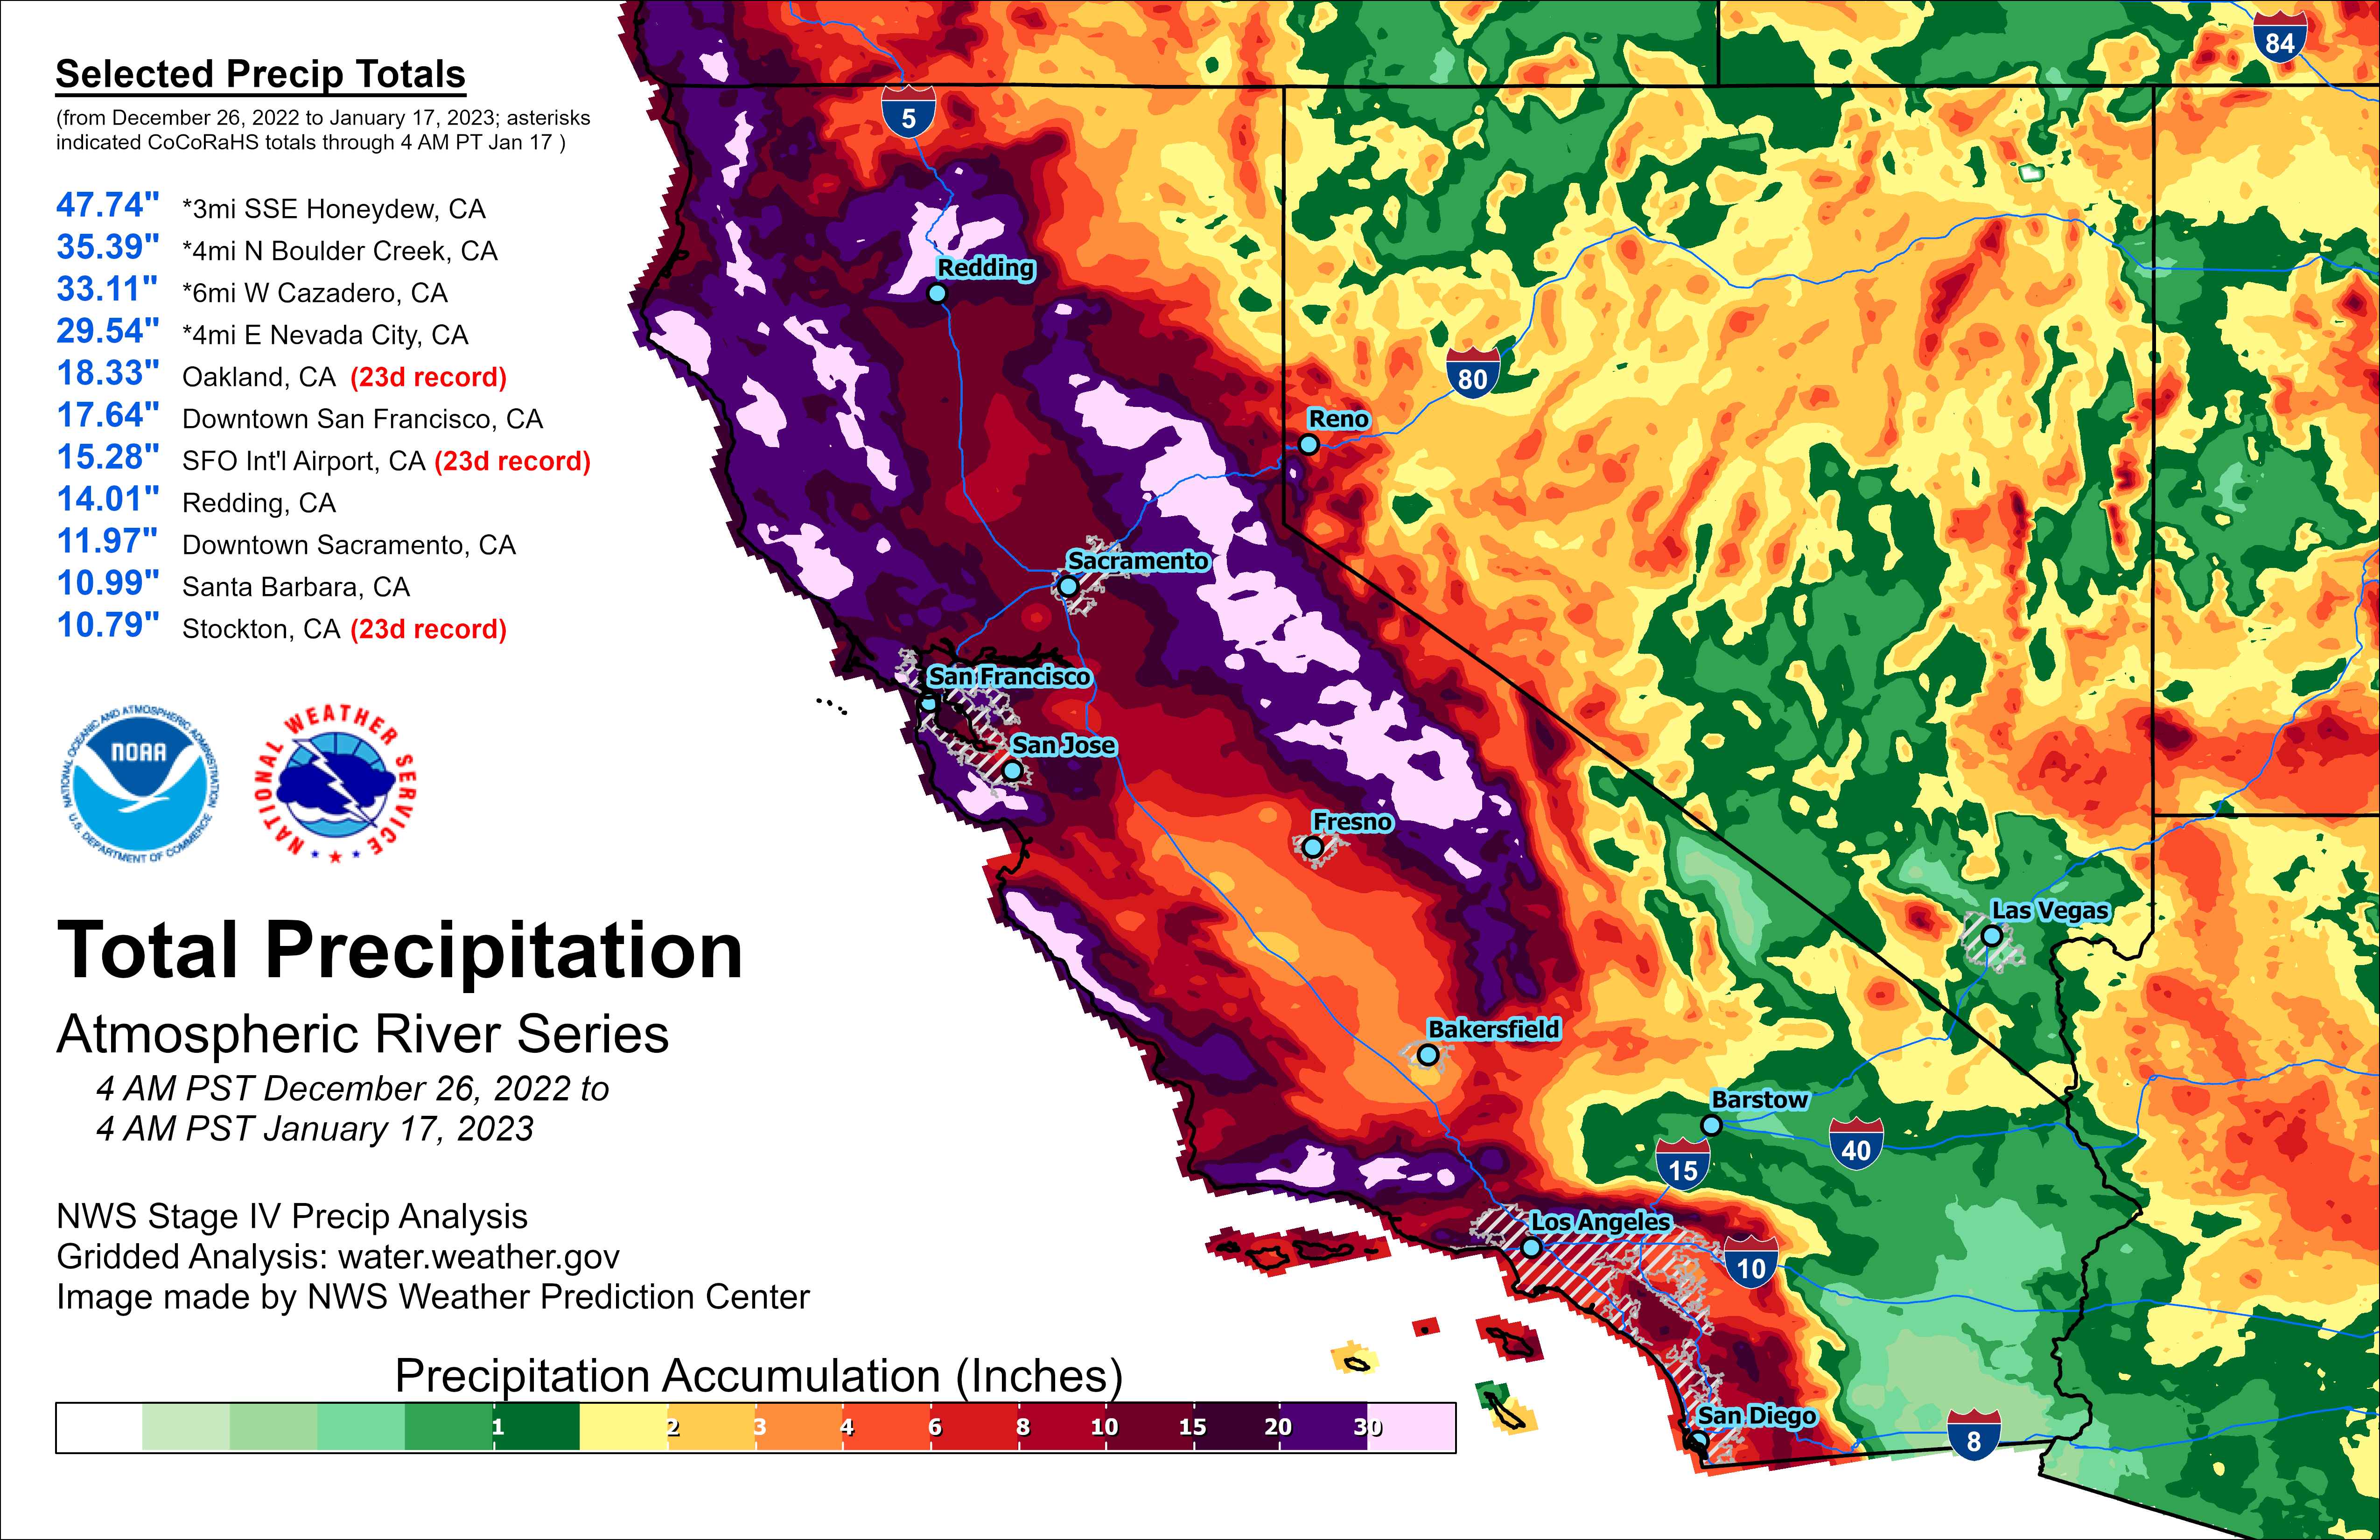
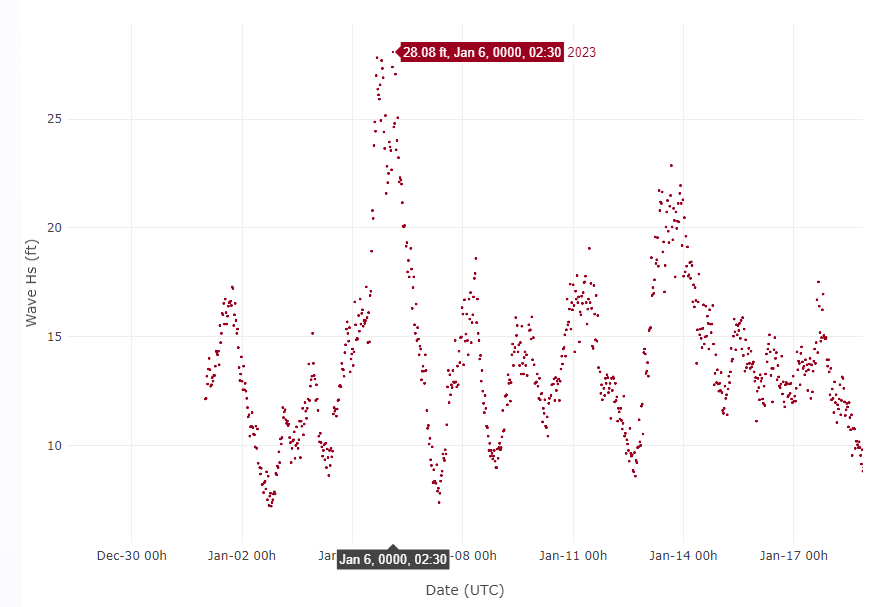
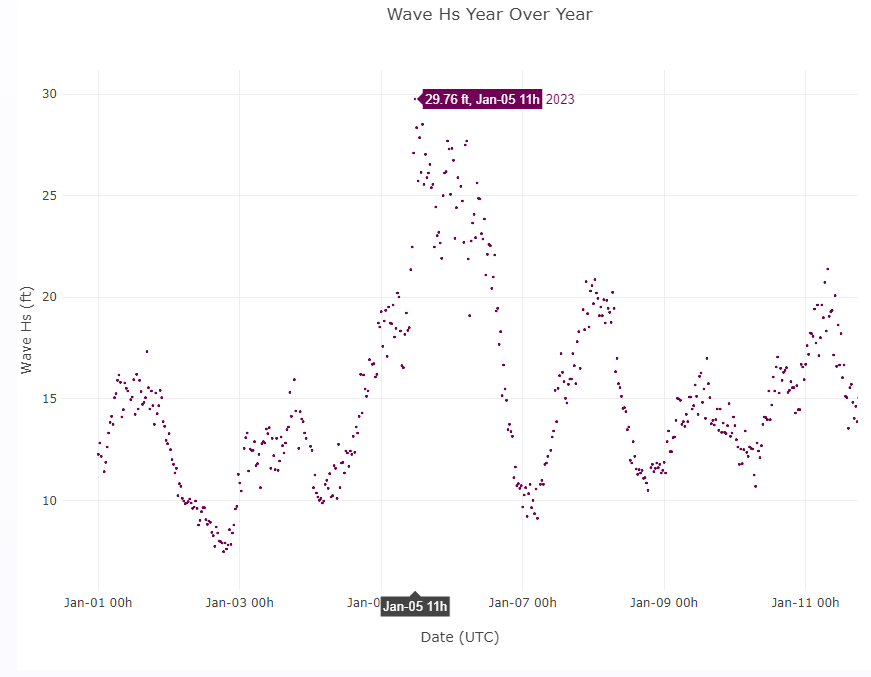
From the beginning of the water year (Oct 1, 2022) through Christmas, the Bay Area had received generally 5” to 7” of rain. This mainly came from weak fronts moving across the region. December 26, 2022, saw a change to the pattern as it ushered in the first in a series of storms that tapped into the high moisture content of the sub-tropics. This storm series engulfed the Bay Area and Monterey Bay regions, and much of the state, from late December through mid-January. While “breaks” in the main storms did occur, there remained lingering showers, which dotted the area. This left many residents feeling exhausted from near constant rainfall. From late December through mid-January there were approximately six storm systems that brought a wide variety of hazardous weather to the Bay Area and Central Coast. These systems varied in dynamic set-up from narrow cold-frontal rain bands (NCFR), atmospheric rivers and even included a low-pressure center that underwent "bomb cyclogenesis". The result of these storms produced hazardous weather over a three-week period which included: large surf over 30 feet, wind gusts over 100 mph, widespread flooding which included river flooding, gusty thunderstorm outflow winds, small hail, two waterspouts and several reported shallow landslides, just to name a few. Unfortunately, there was loss of life experienced from these storms, while other people's lives forever will forever be changed. Drier conditions returned after January 19th, but not without a lasting impact throughout the State of California. Between December 26th, 2022, and January 17th, 2023, Downtown San Francisco received 17.64" of rain. SFO Airport set a 23-day rainfall record at 15.28", while the city of Oakland set their own 23-day rainfall record with 18.33" of rain. The State maximum total rain was in Honeydew, California (Humboldt County) which received 47.74" since December 26th. Many of the area coastal peaks as well as the Sierra Nevada received between 20" to 35" of rain! All of this rain saw a modest improvement in drought monitoring as well as much greener satellite imagery.
CW3E has a few event summaries available here https://cw3e.ucsd.edu/cw3e-event-summary-29-december-2022-1-january-2023/ https://cw3e.ucsd.edu/cw3e-event-summary-26-27-december-2022/ https://cw3e.ucsd.edu/cw3e-event-summary-29-december-2022-1-january-2023/
Composed by: MMehle / DKing |
River impacting the Bay Area and Central Coast. Additional Satellite loops available via RAMMB-CIRA
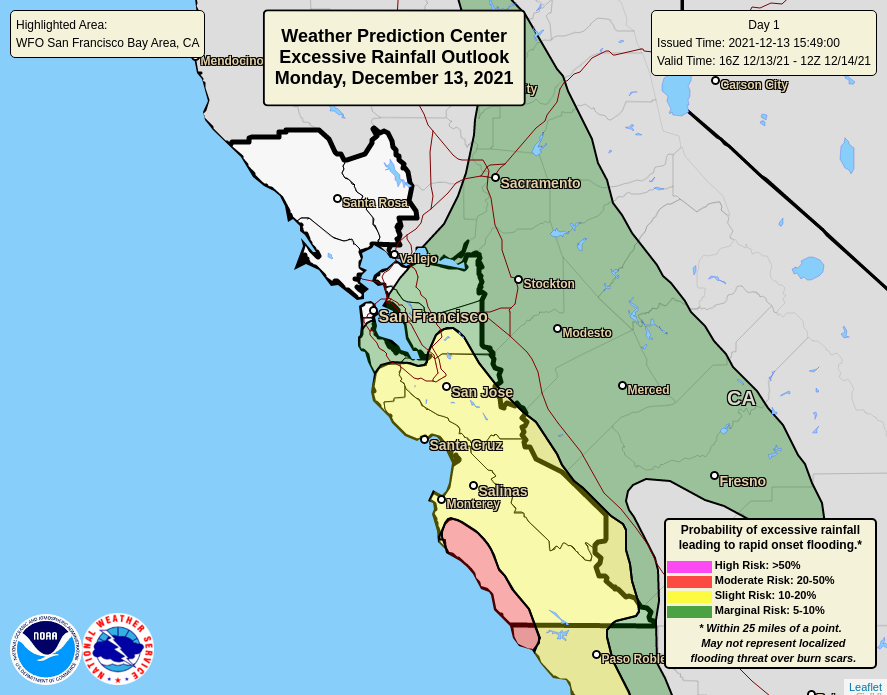
the West Coast.
late December '22 to January '23. |
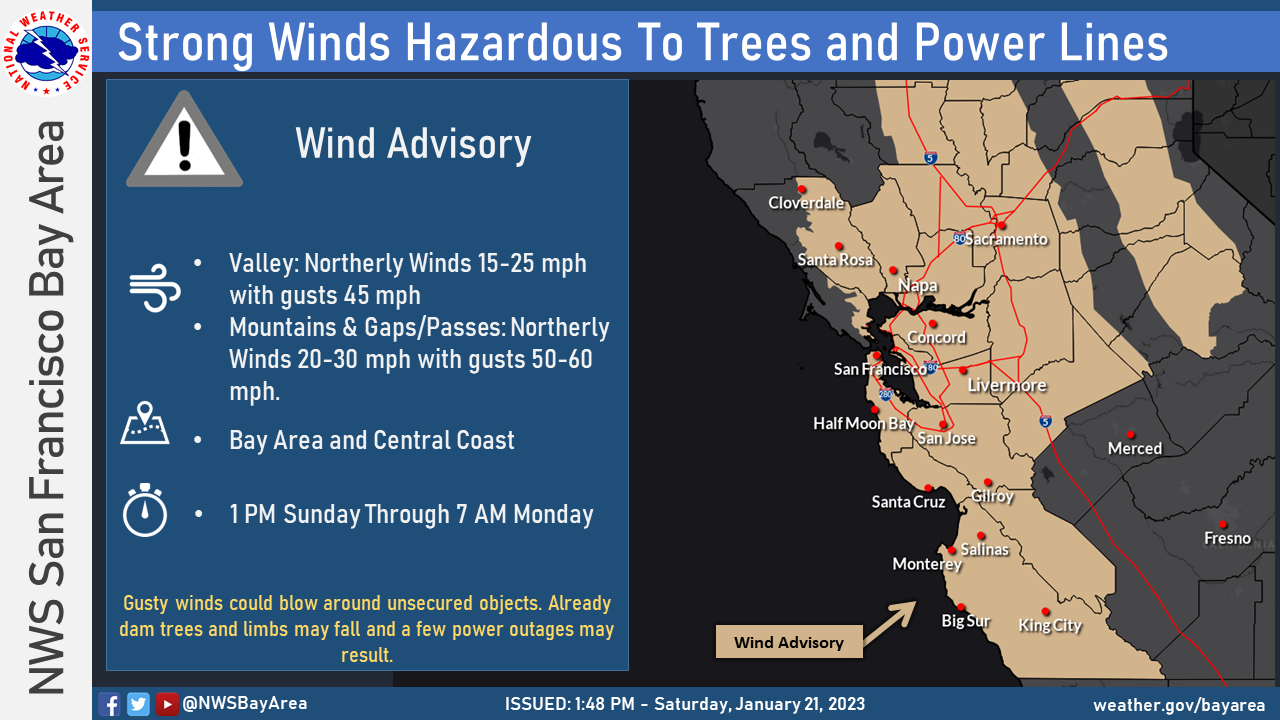
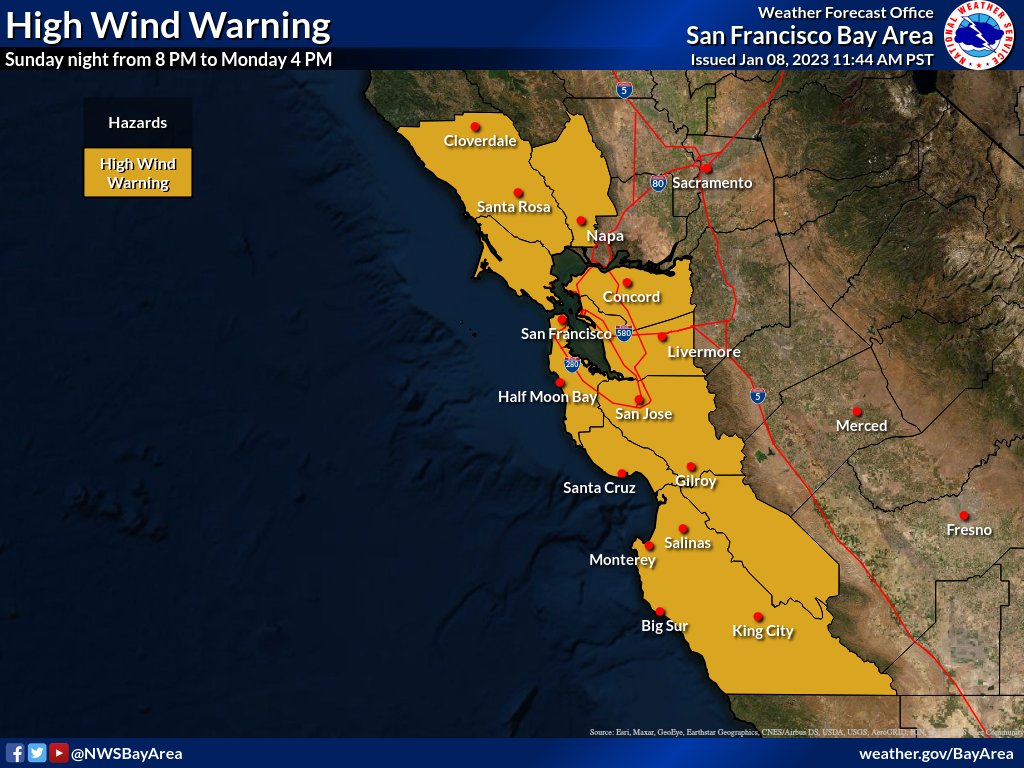
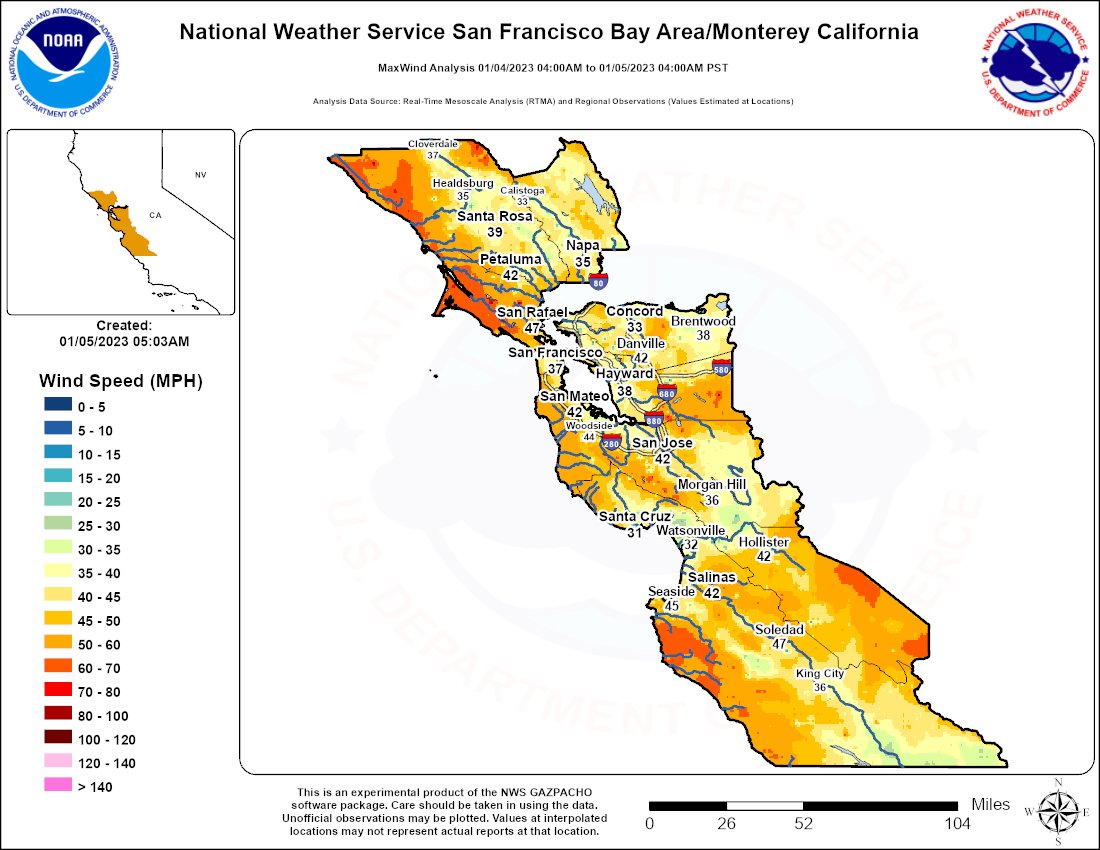
Damaging Winds
Local Storm Reports from December 26, 2022 to January 09, 2023 and January 10-17, 2023
 |
 |
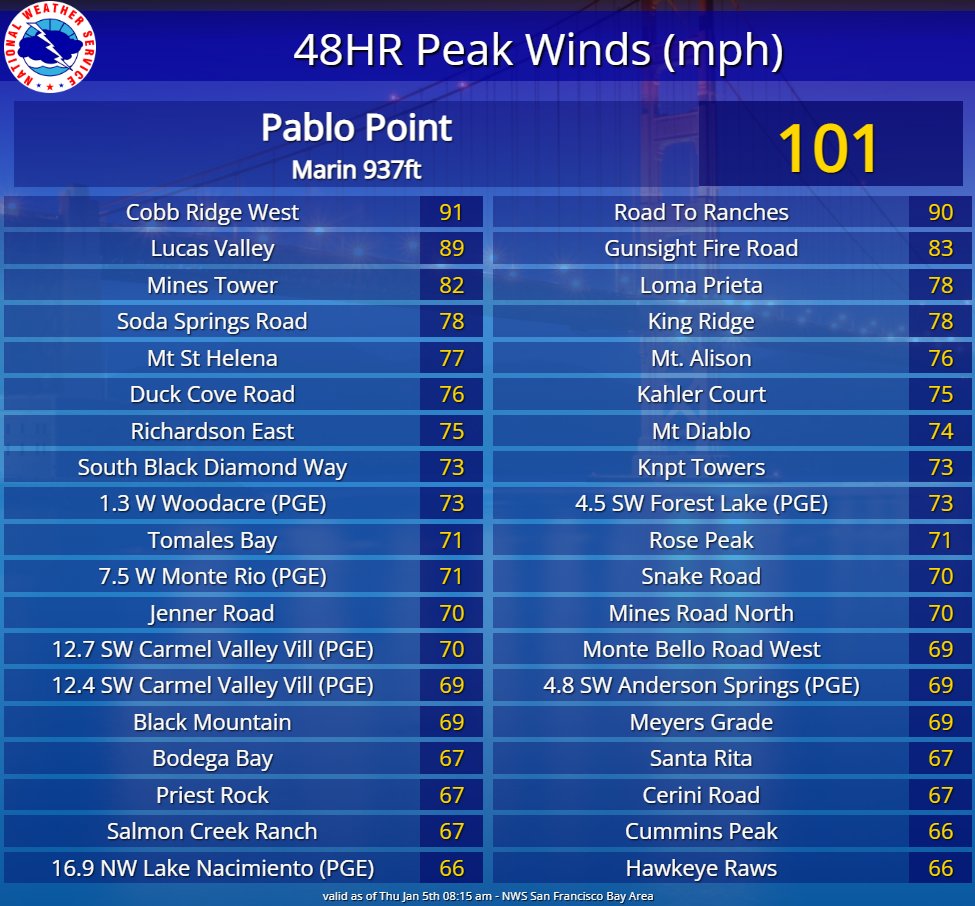 |
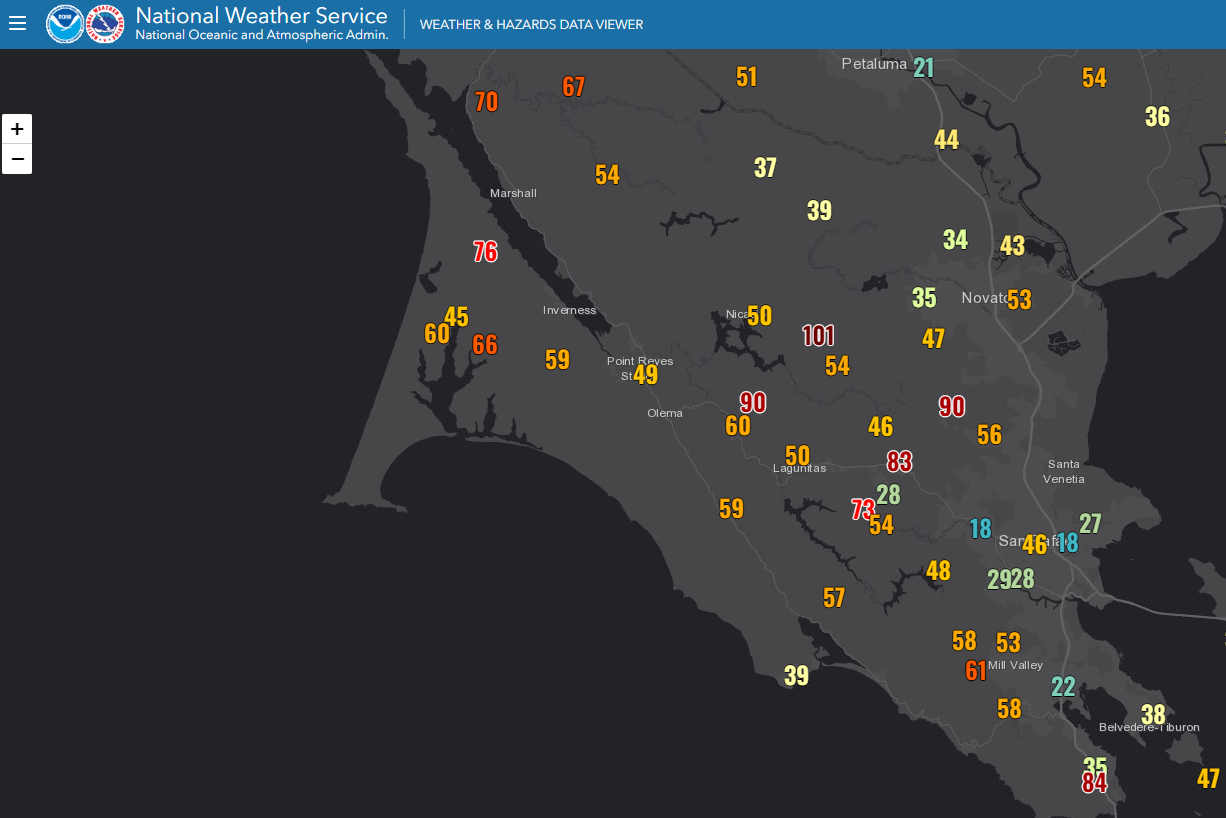
| Wind Advisory | High Wind Warning | 24 hour peak wind gusts. |
 |
 |
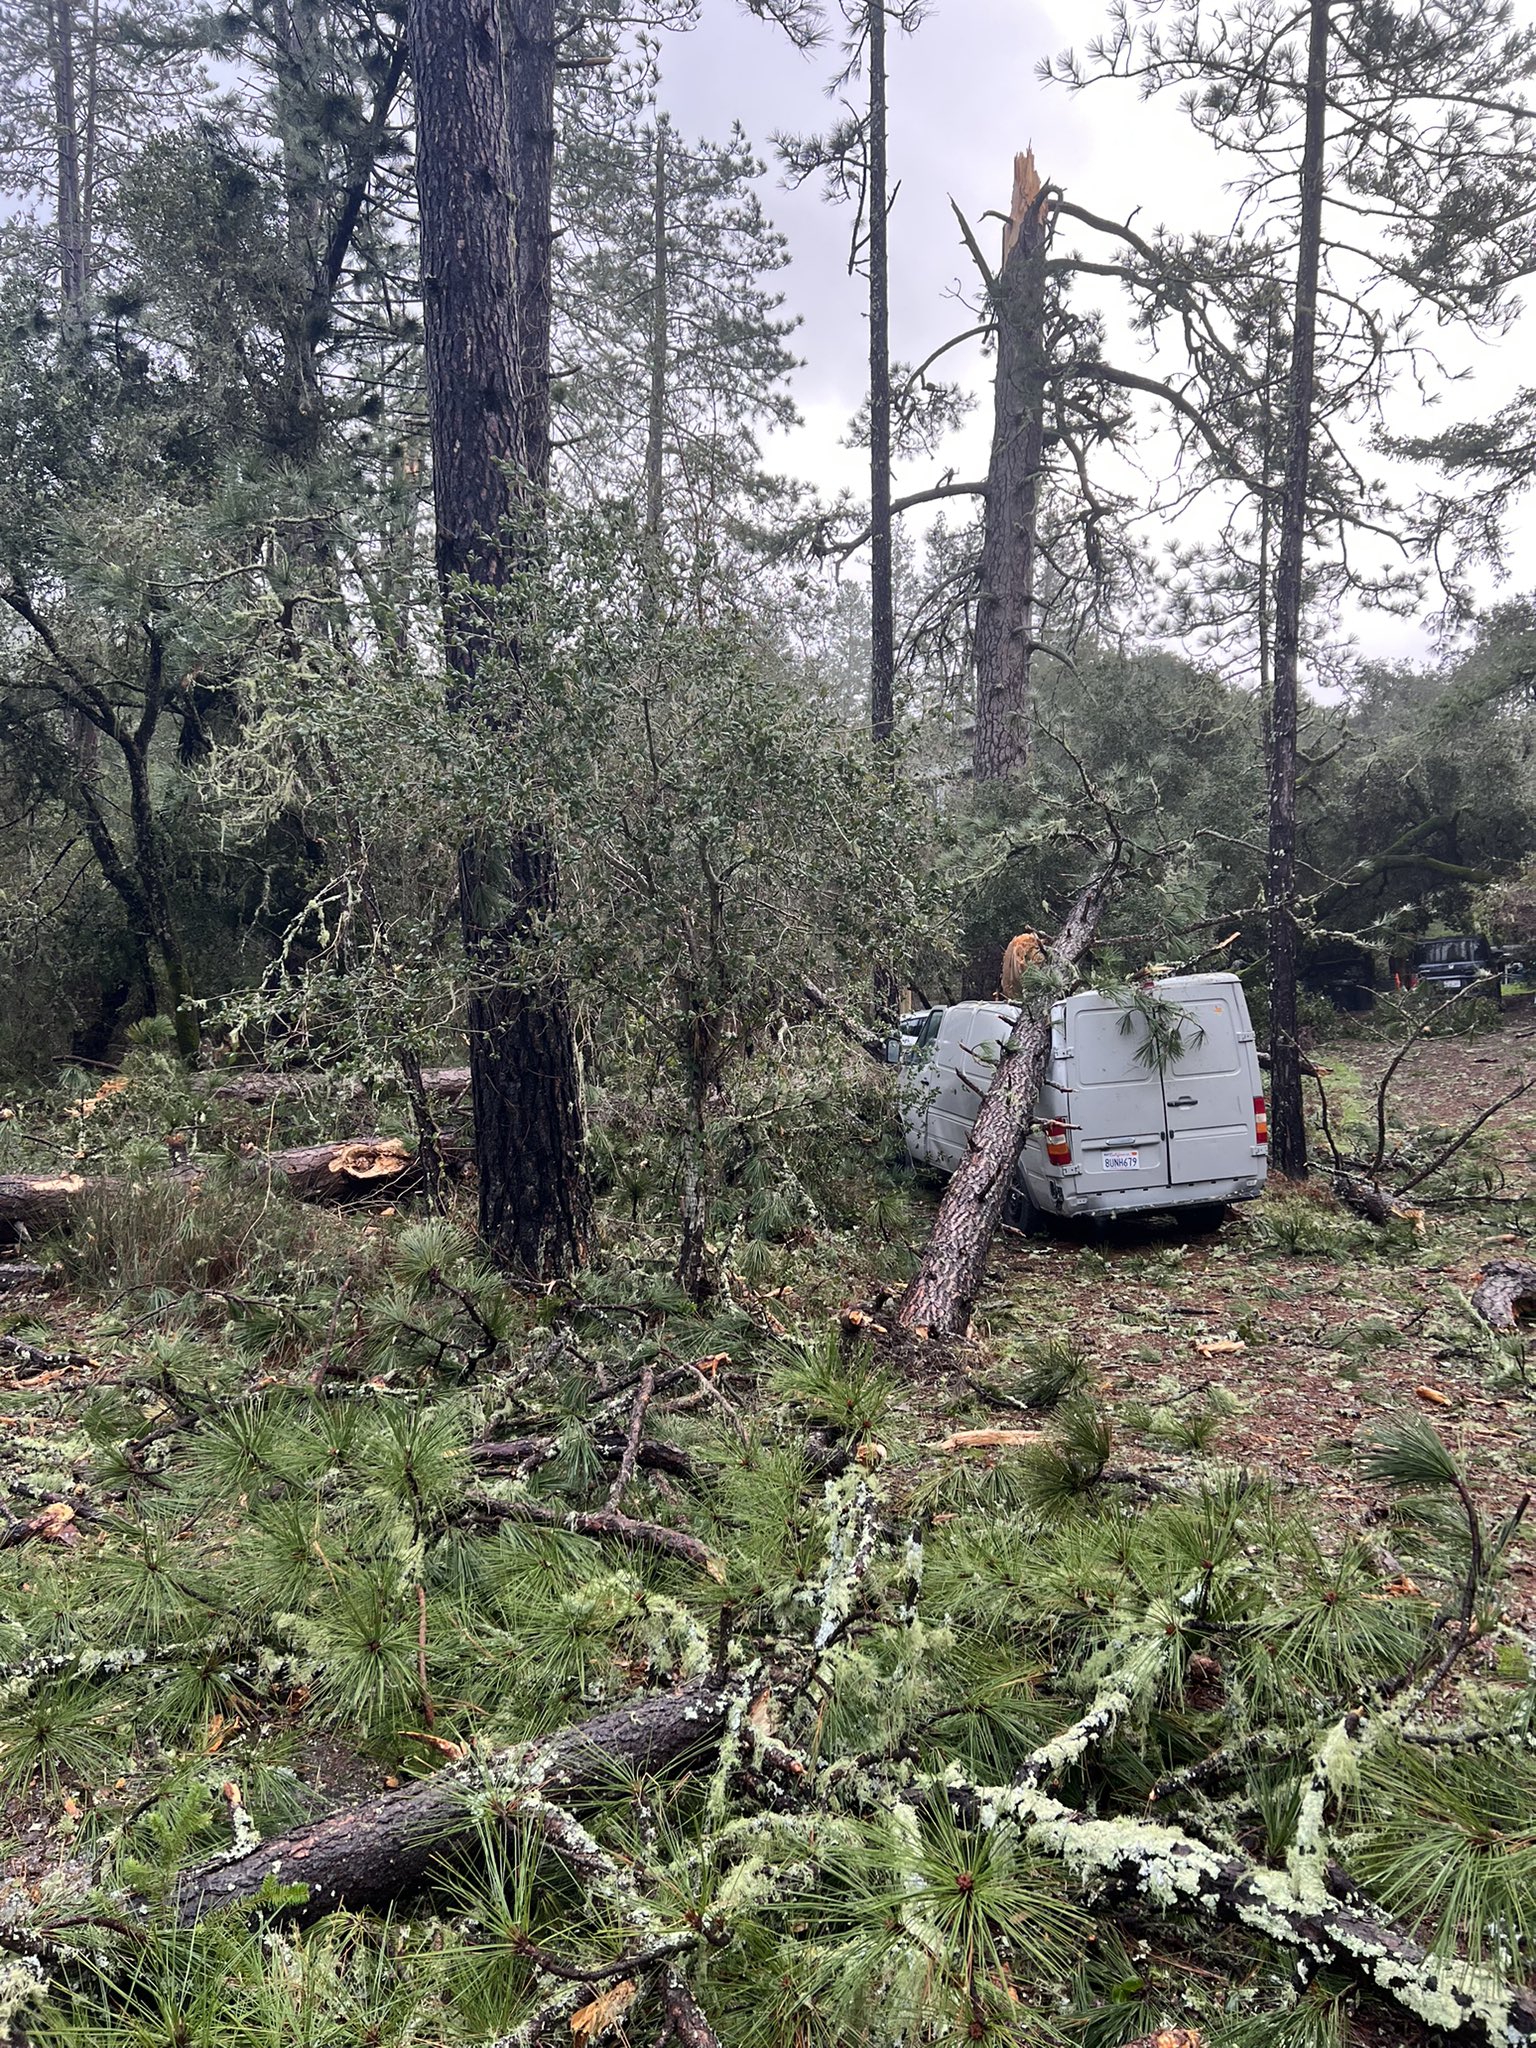 |
| 101 mph gusts January 4 to January 5 | 101 mph gusts January 4 to January 5 | Tree Damage in Ben Lomond |
Landslides/Mud Flows and Flooding
Flooding
 |
 |
 |
 |
|
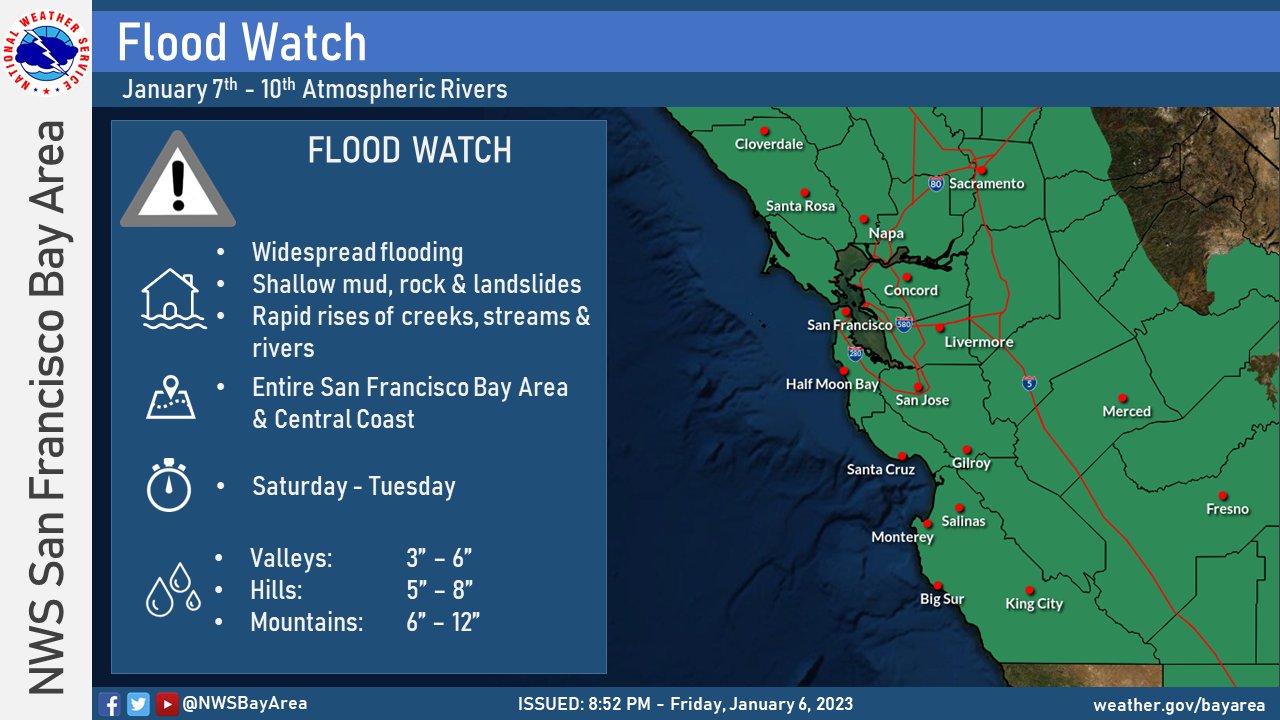
Flood Watch |
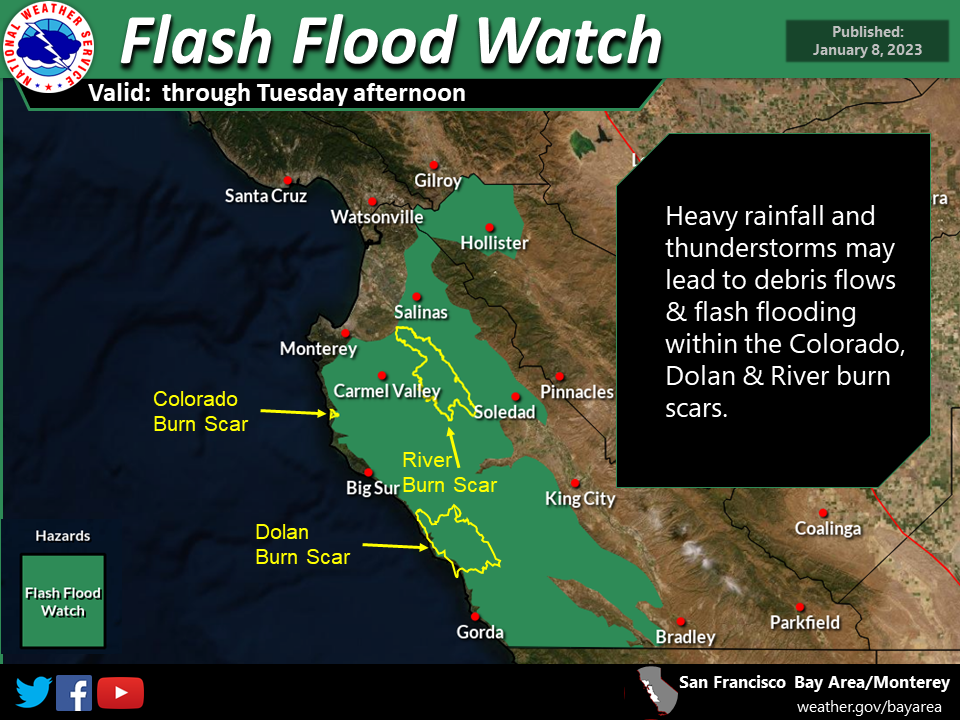
Flash Flood Watch for burn areas |
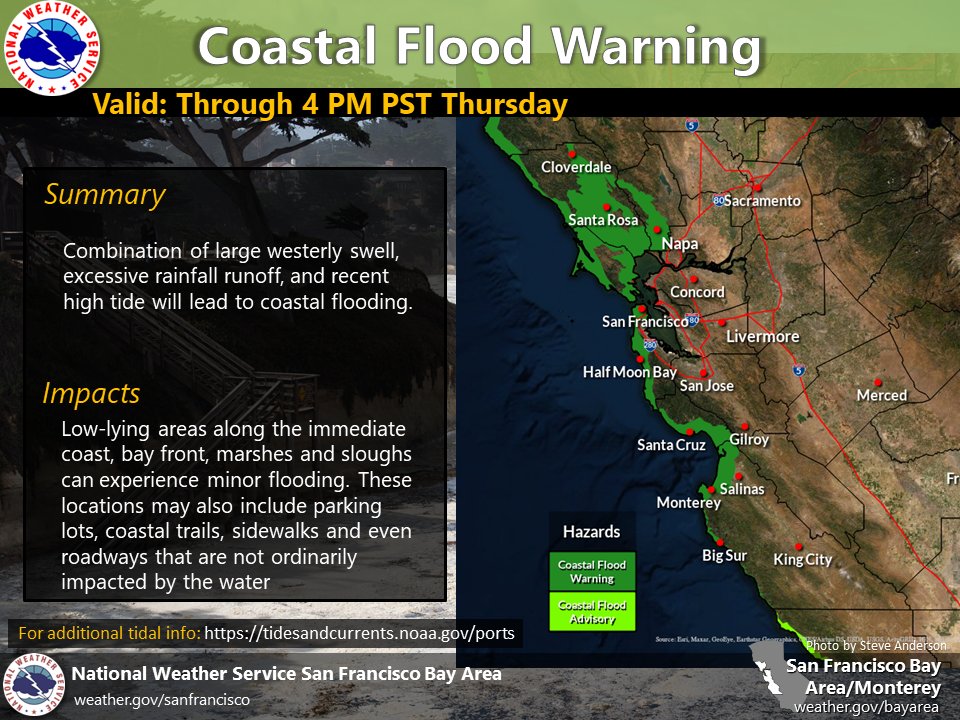
Coastal Flood Warning - high tide and excessive rainfall runoff |
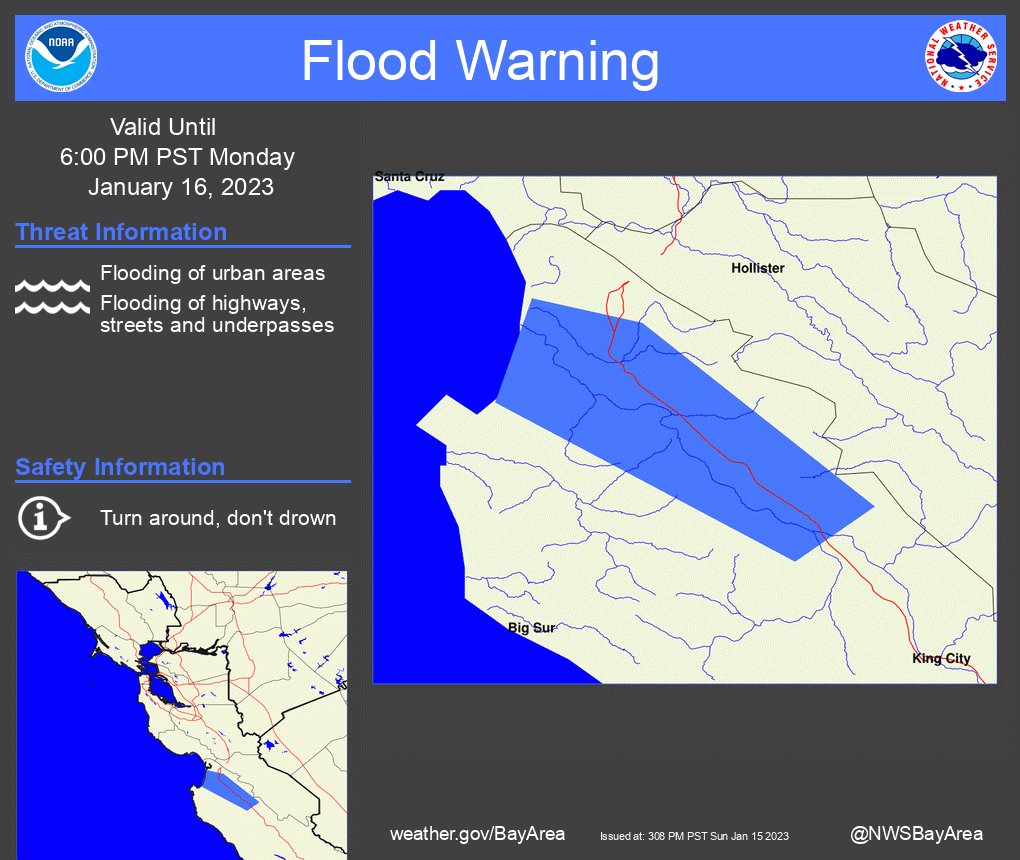
Flood Warning for Salinas River |
 |
 |
 |
 |
|
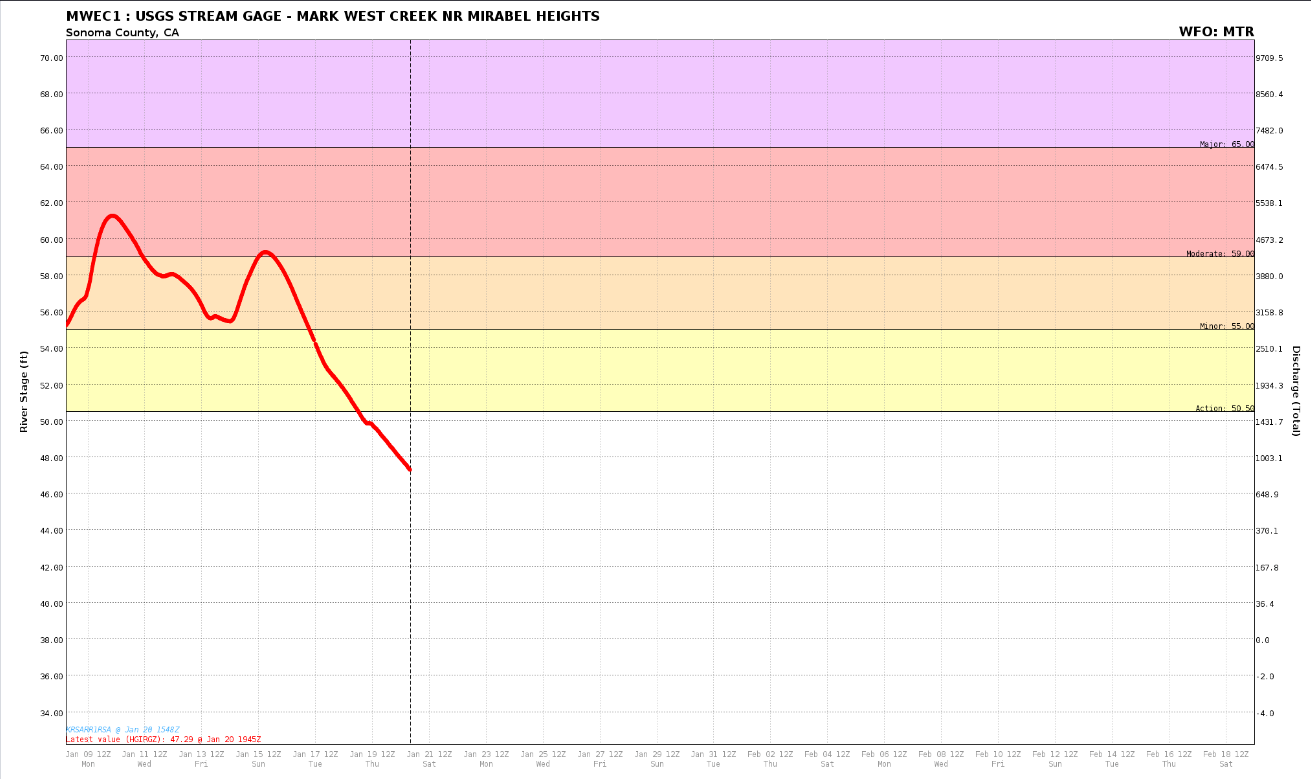
Mark West Stream Gage |
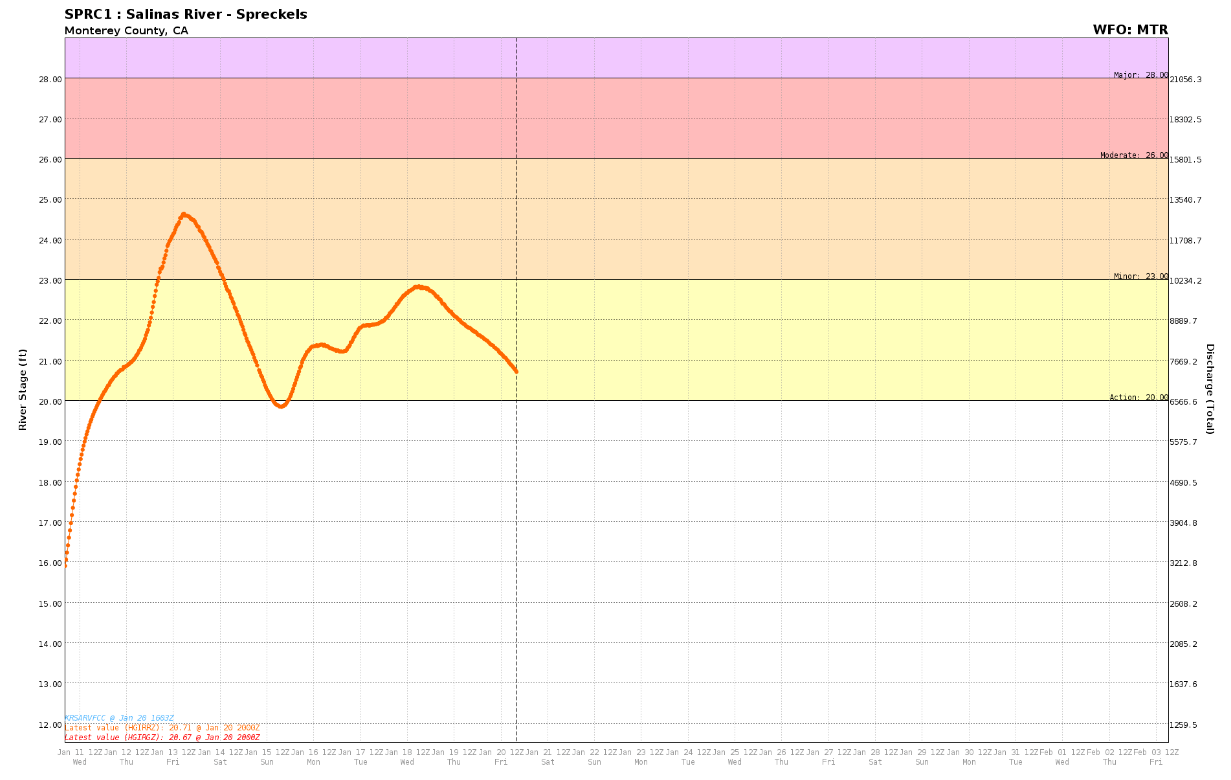
Salinas River Gage |
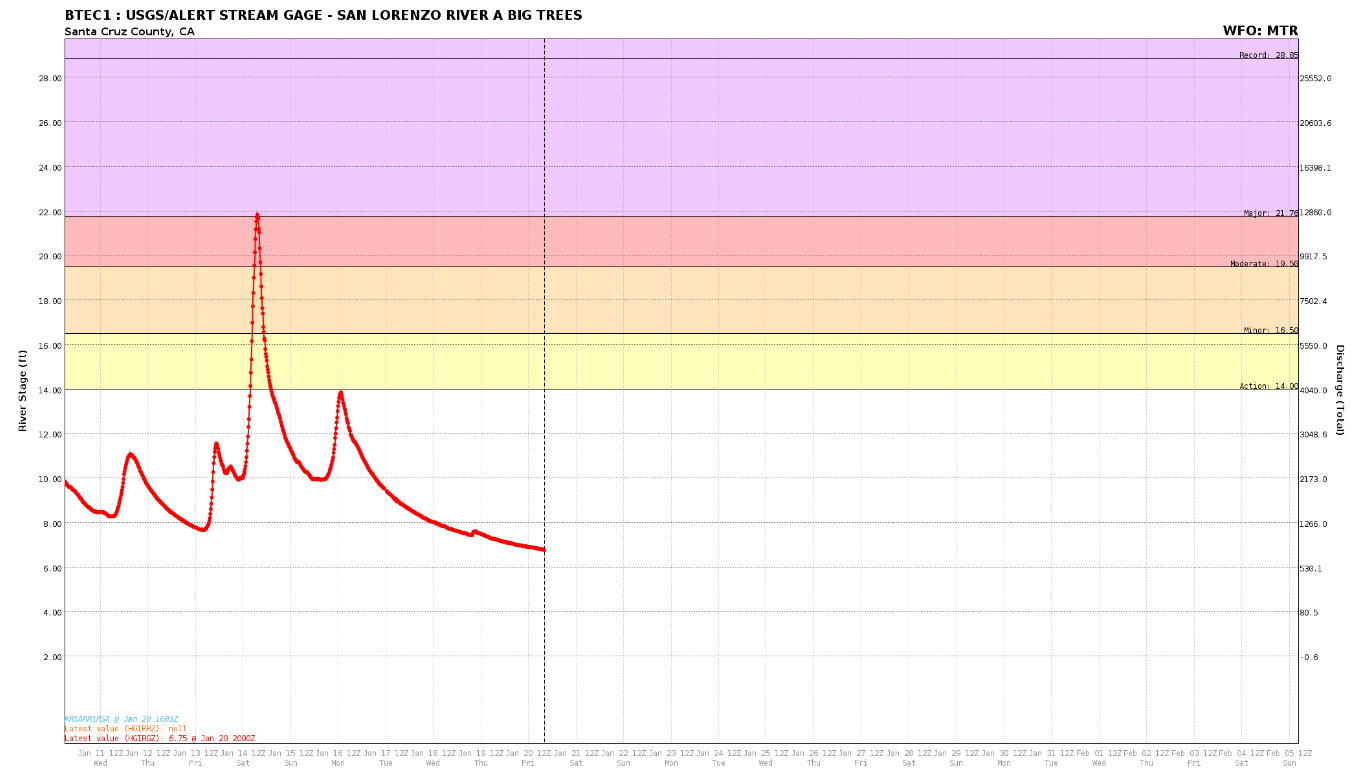
San Larenzo River Gage |
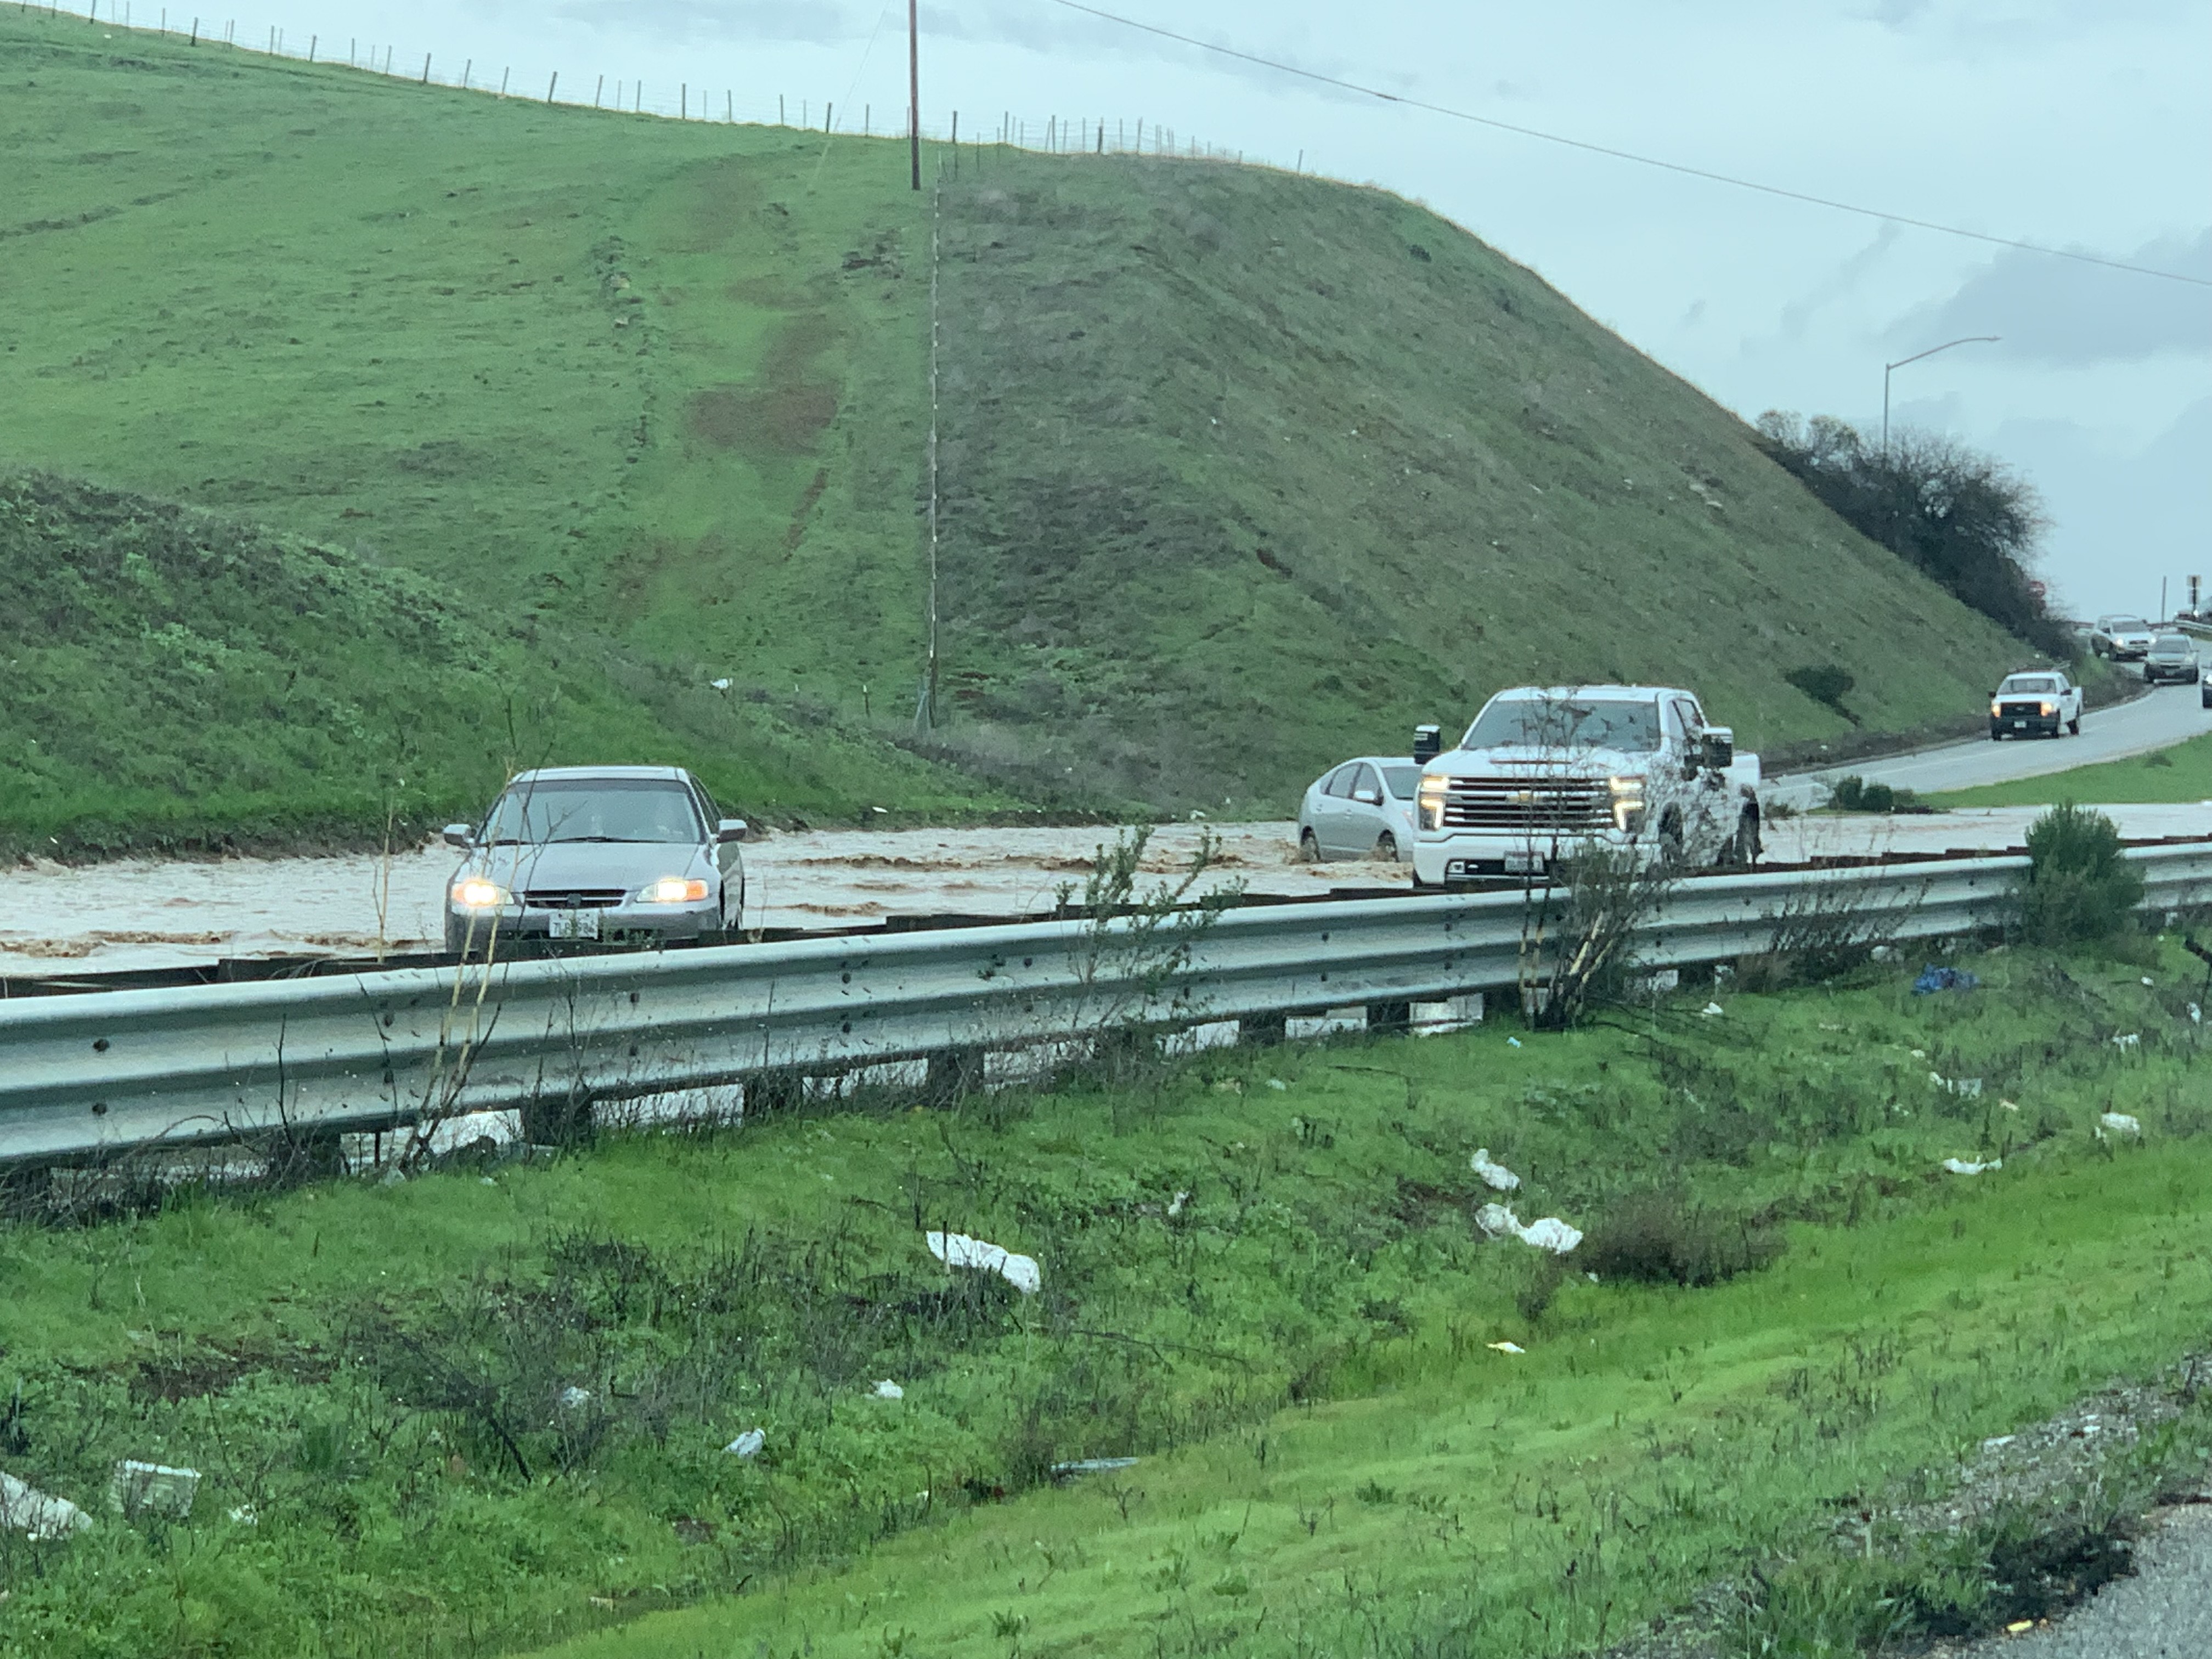
Flooding on Hwy 101 Photo by NWS Employee |
 |
 |
||
|
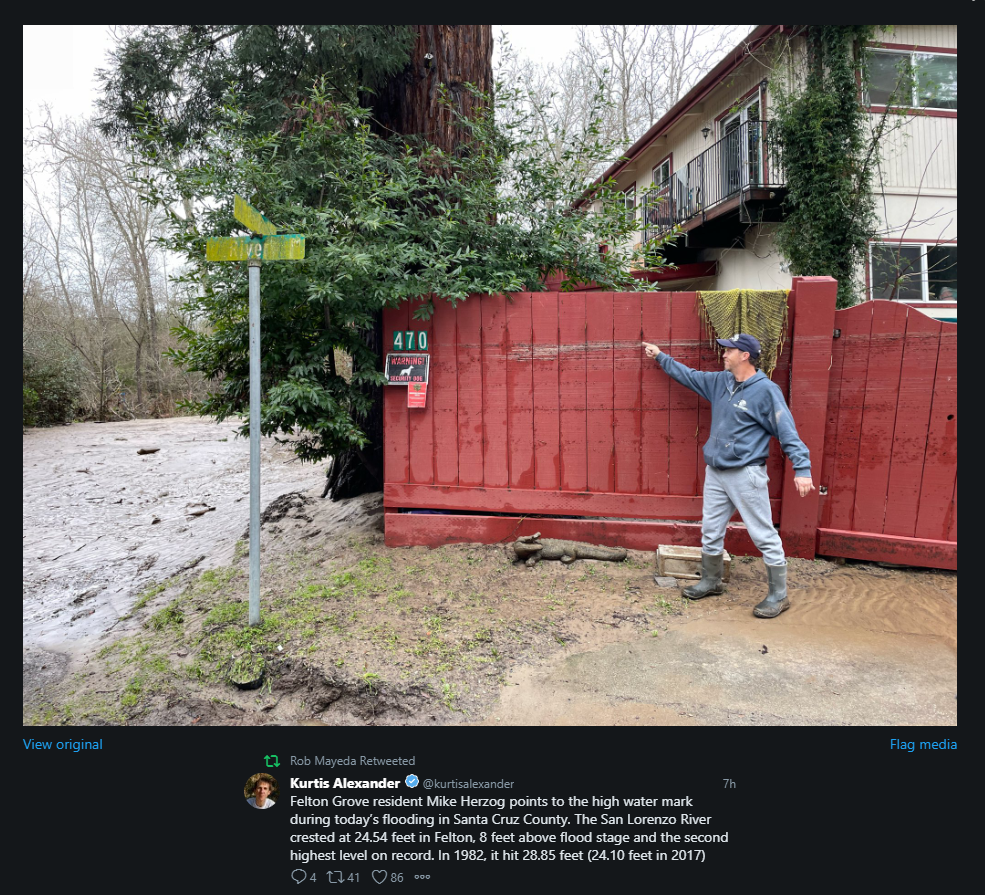
Felton Grove resident marking flood level Photo @kurtisalexander |
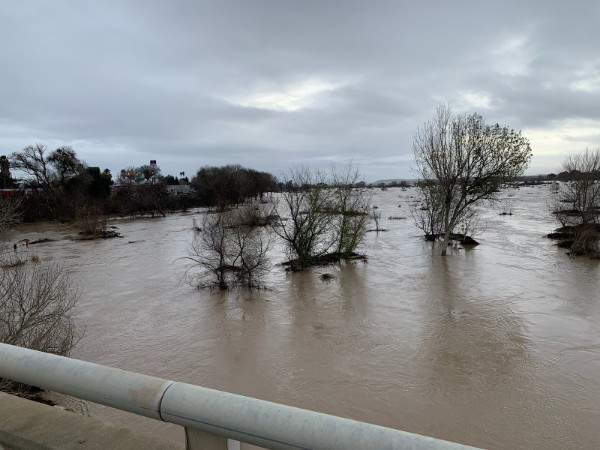
Flooding on the Salinas River. Photo by NWS Employee |
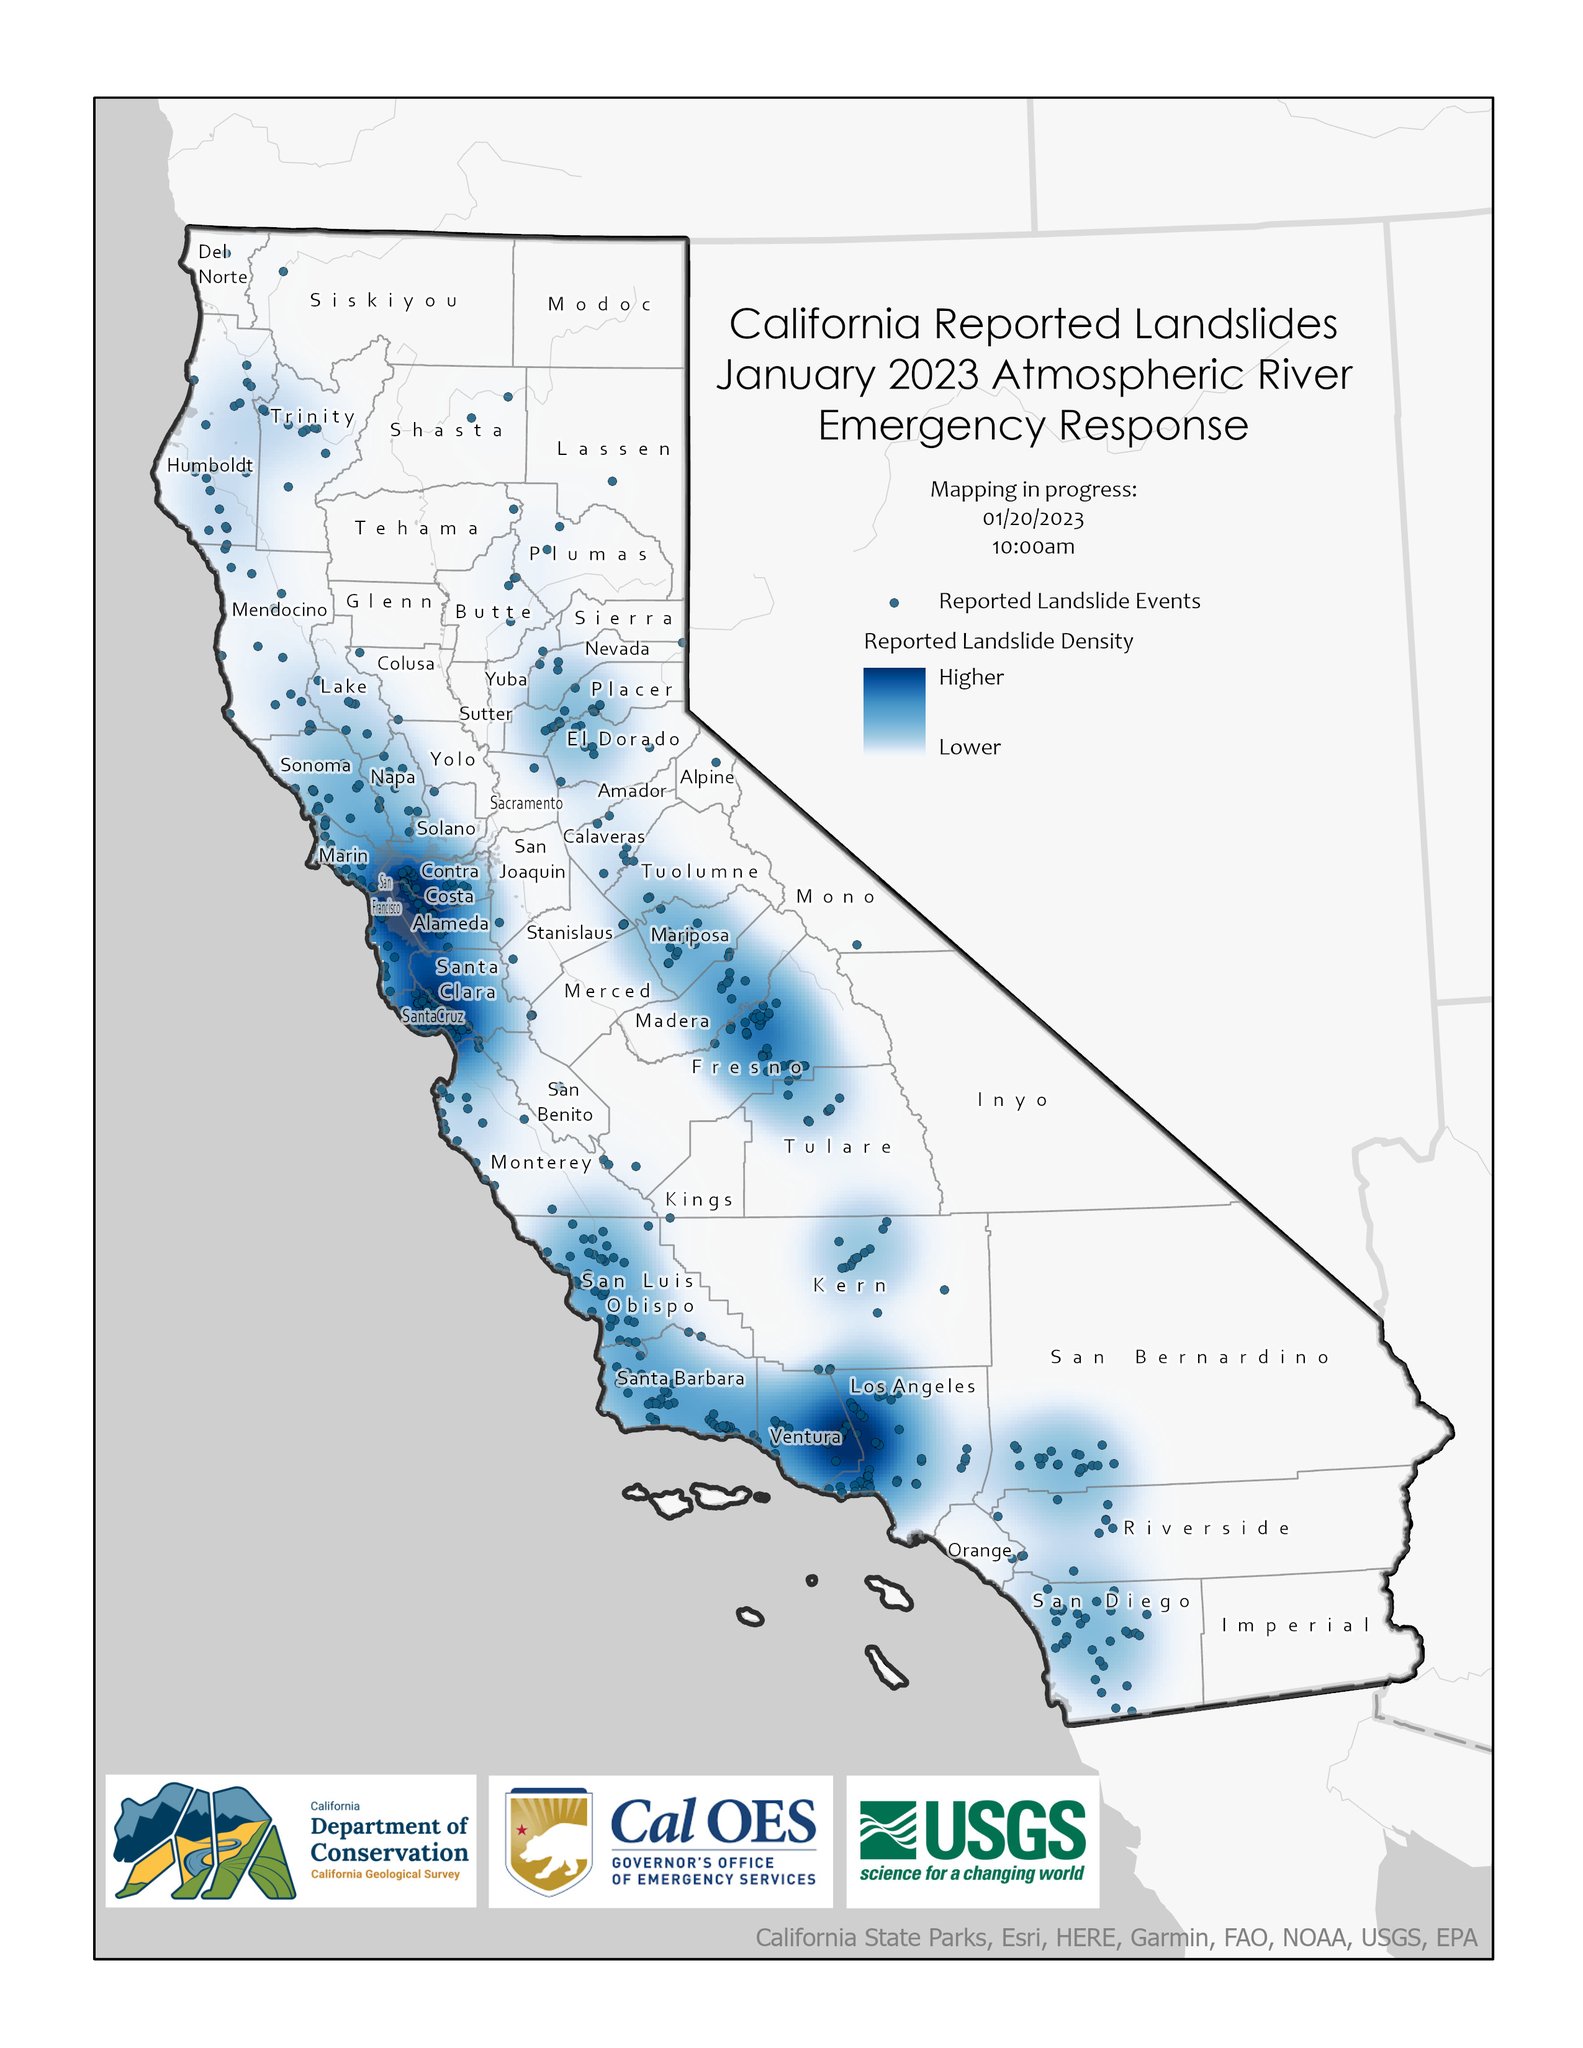
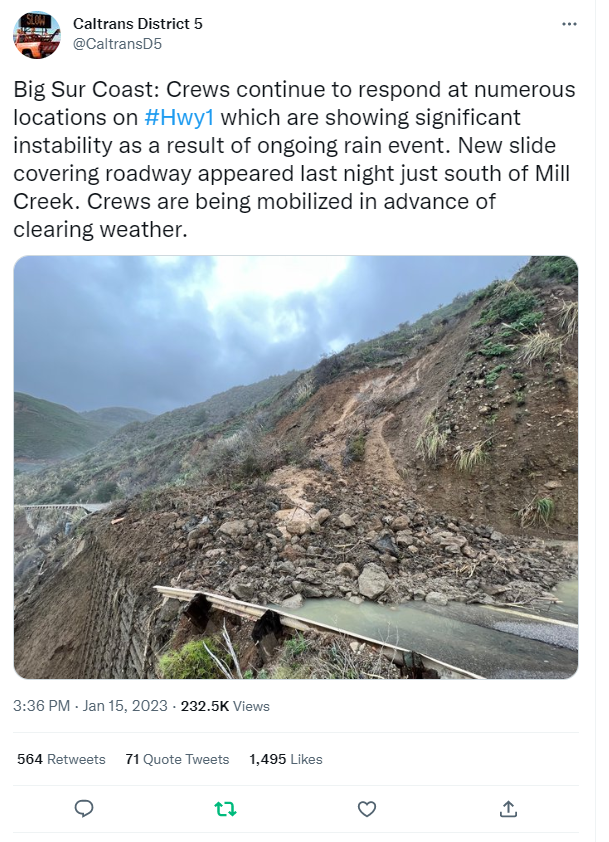
Landslides
 |
 |
||
|
Landslides across CA |
Debris covering Hwy 1 |
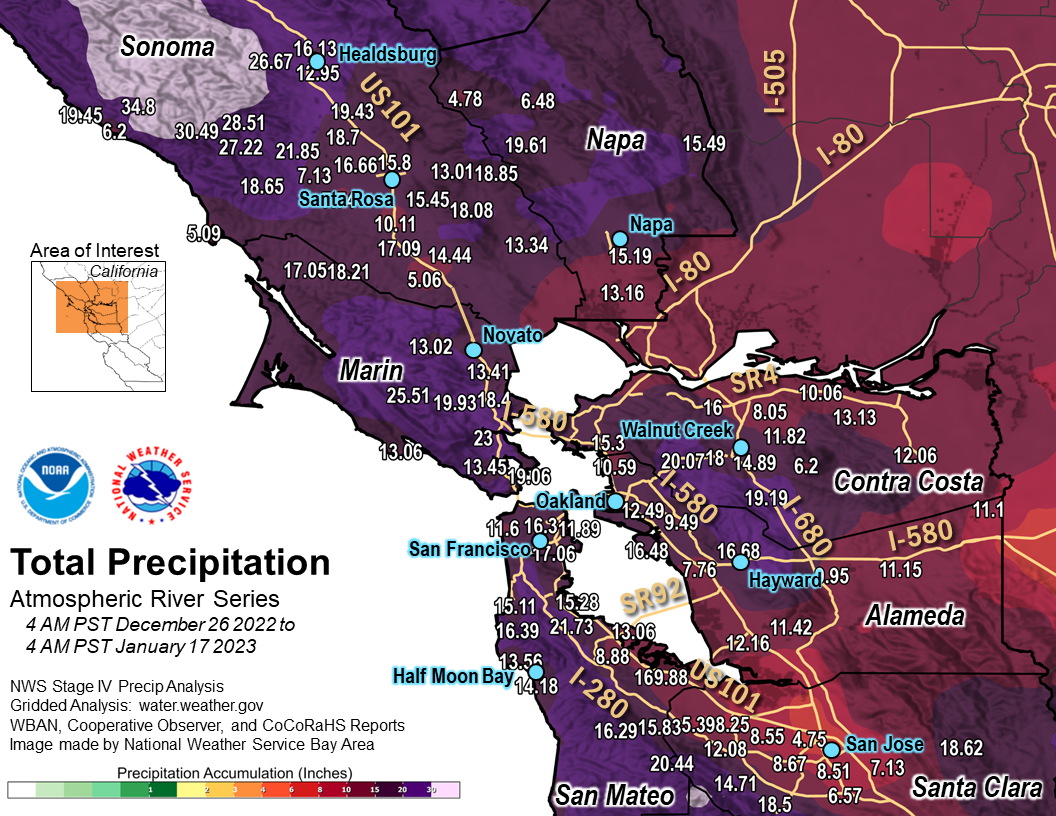
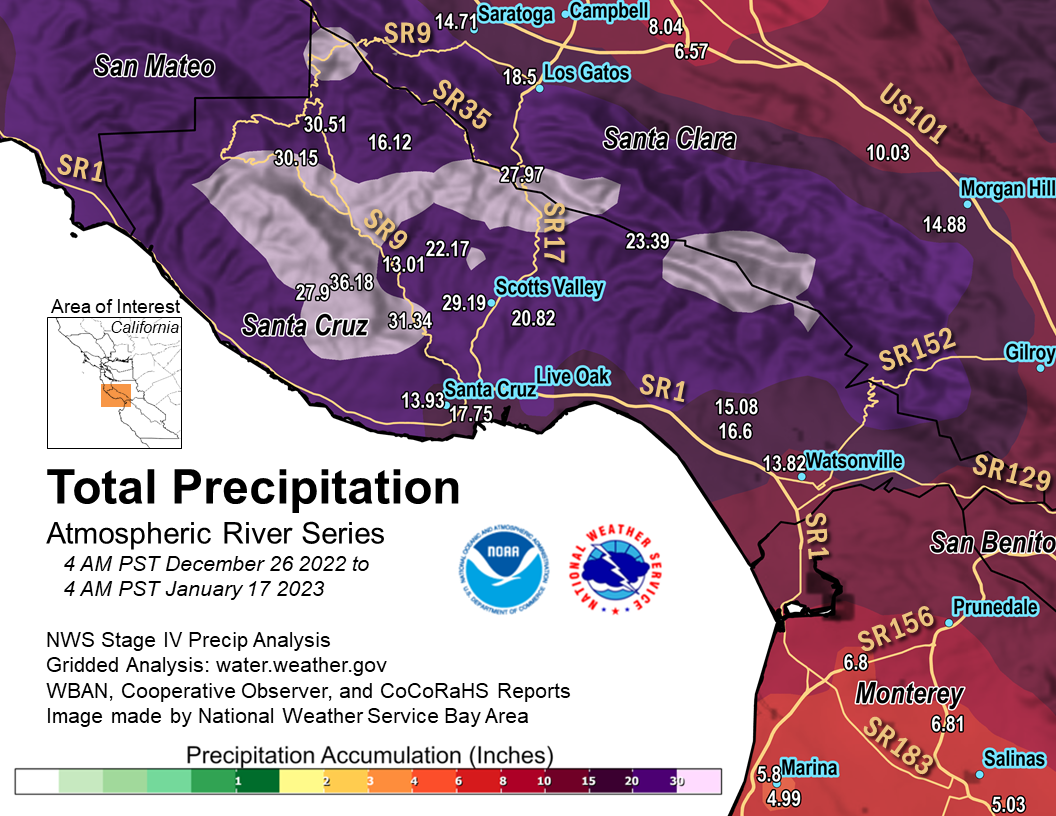
Numerous Atmospheric Rivers brought record breaking rainfall
 |
 |
 |
|
Total Precipitation for the North Bay. |
Total Precipitation for the Santa Cruz Mountains. |
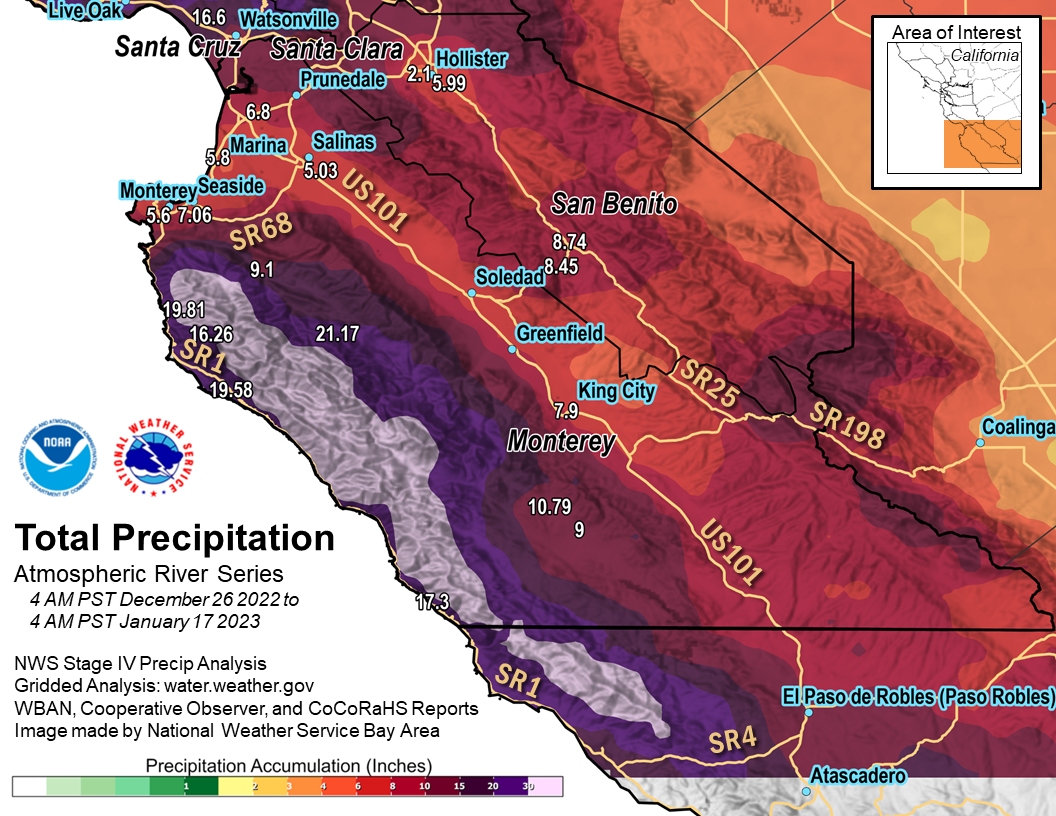
Total Precipitation for the Central Coast. |
 |
 |
 |
|
State map showing Total precipitation. |
One of many Excessive Rainfall Outlooks by WPC to show risk potential for |
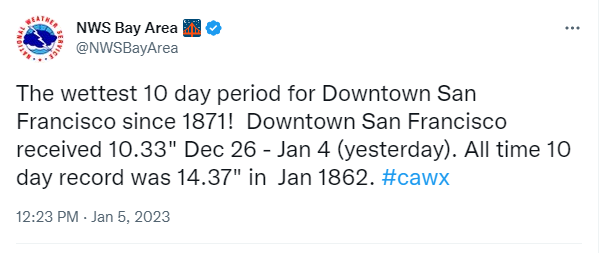
One of many impressive rain stats captured during the storm weather. |
 |
 |
 |
|
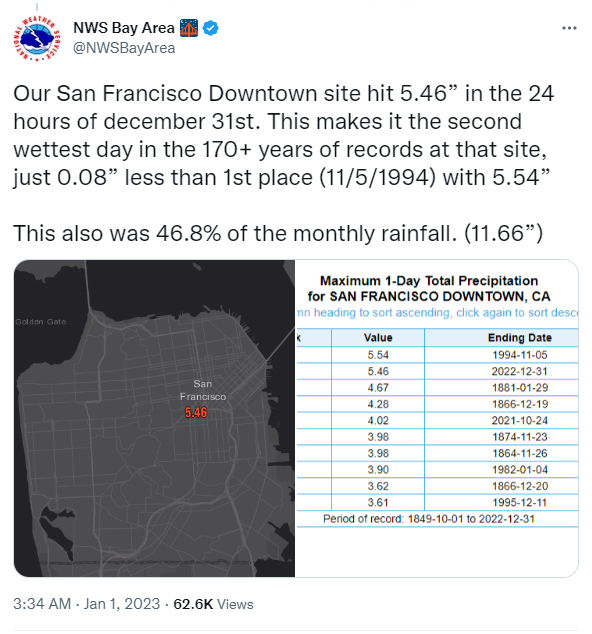
San Francisco Daily Rainfall record for December 31 at 5.46 inches |
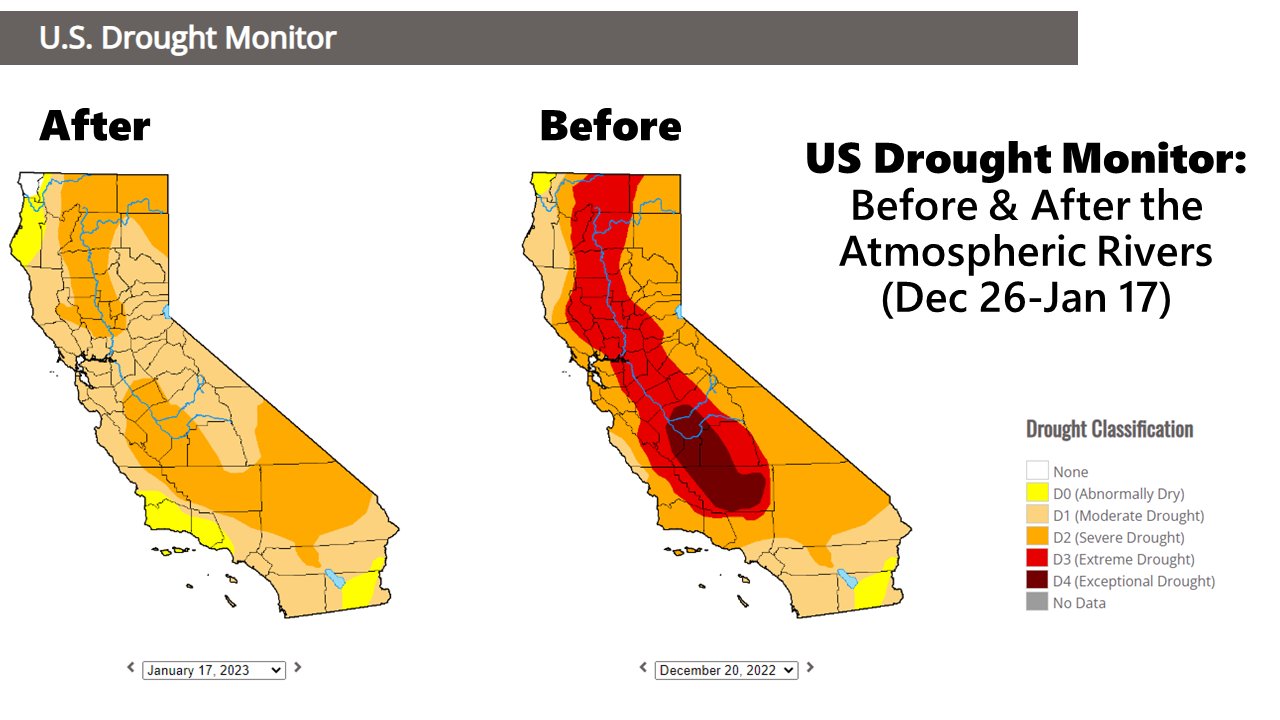
Not a drought buster, but a step in the right direction. Drought map before and after the stormy weather showing improvement. |
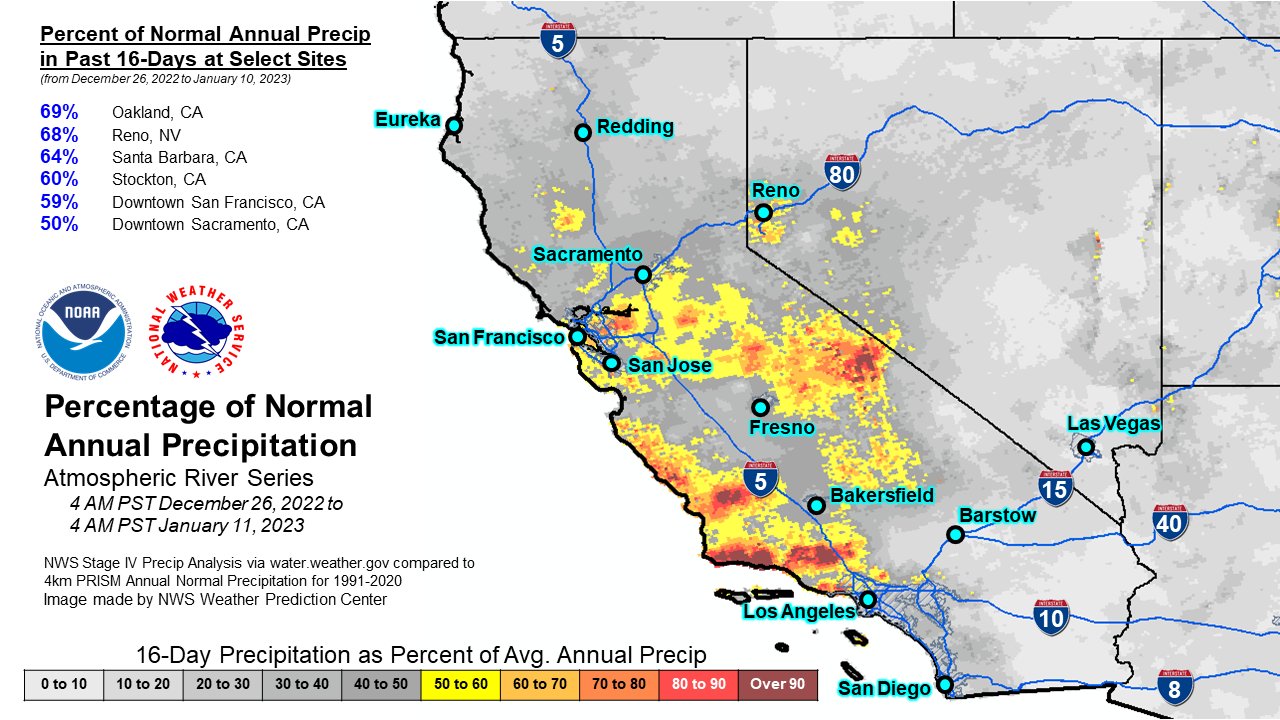
Percent of Normal rainfall map. |
 |
||
|
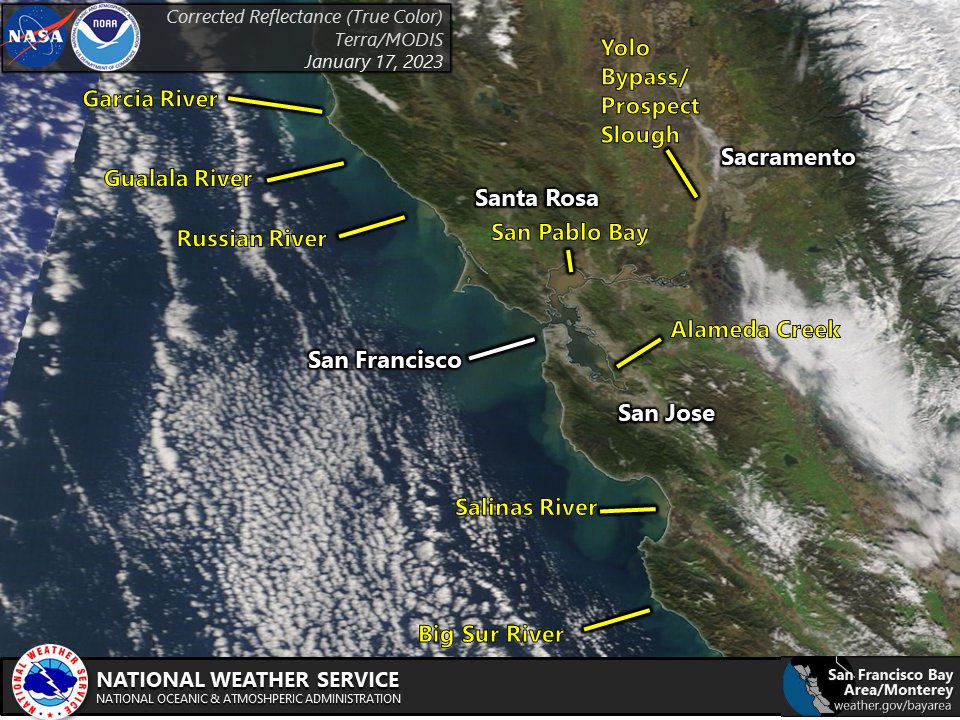
True Color imagery showing full creeks and rivers flowing to the Pacific. |
Thunderstorms
 |
 |
 |
|
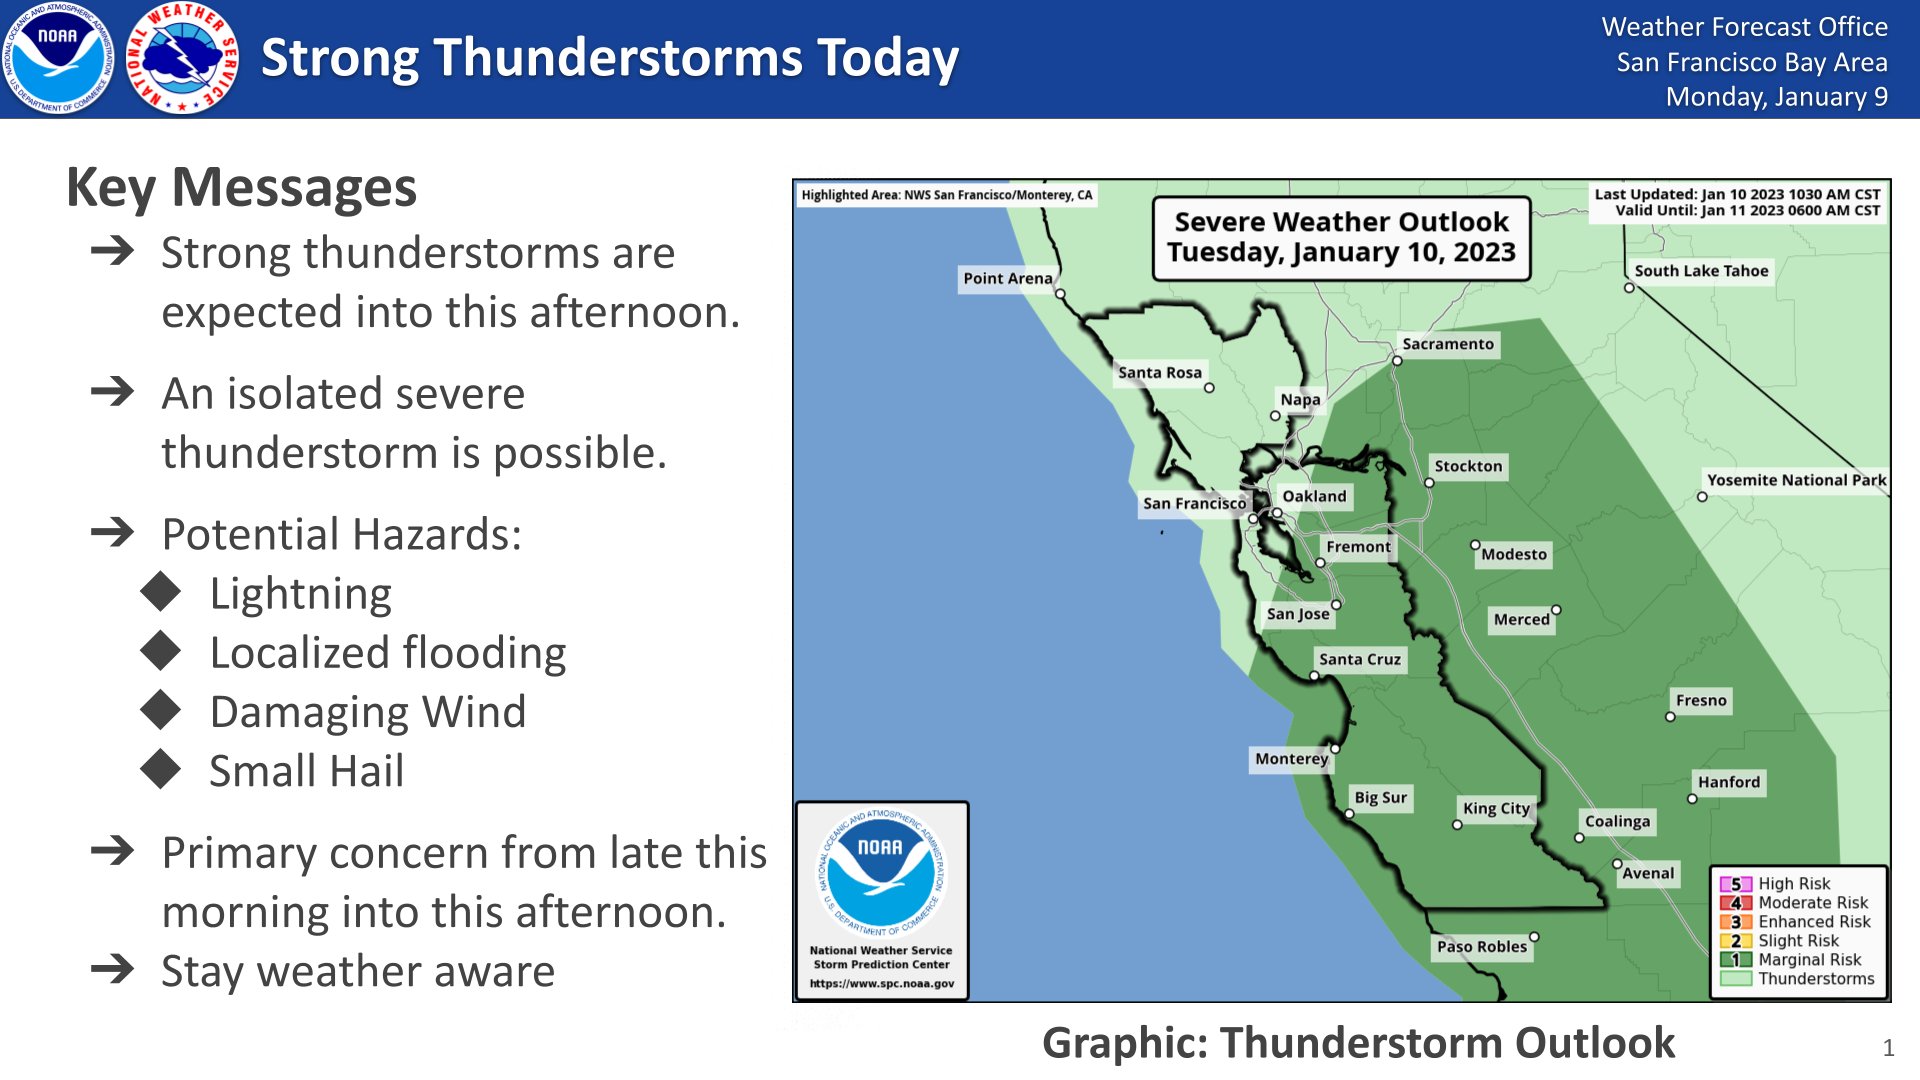
SPC Outlook highlighting severe weather potential across portions of CA. This happened numerous times during the three week period. Highest potential was Marginal Risk on January 10. |
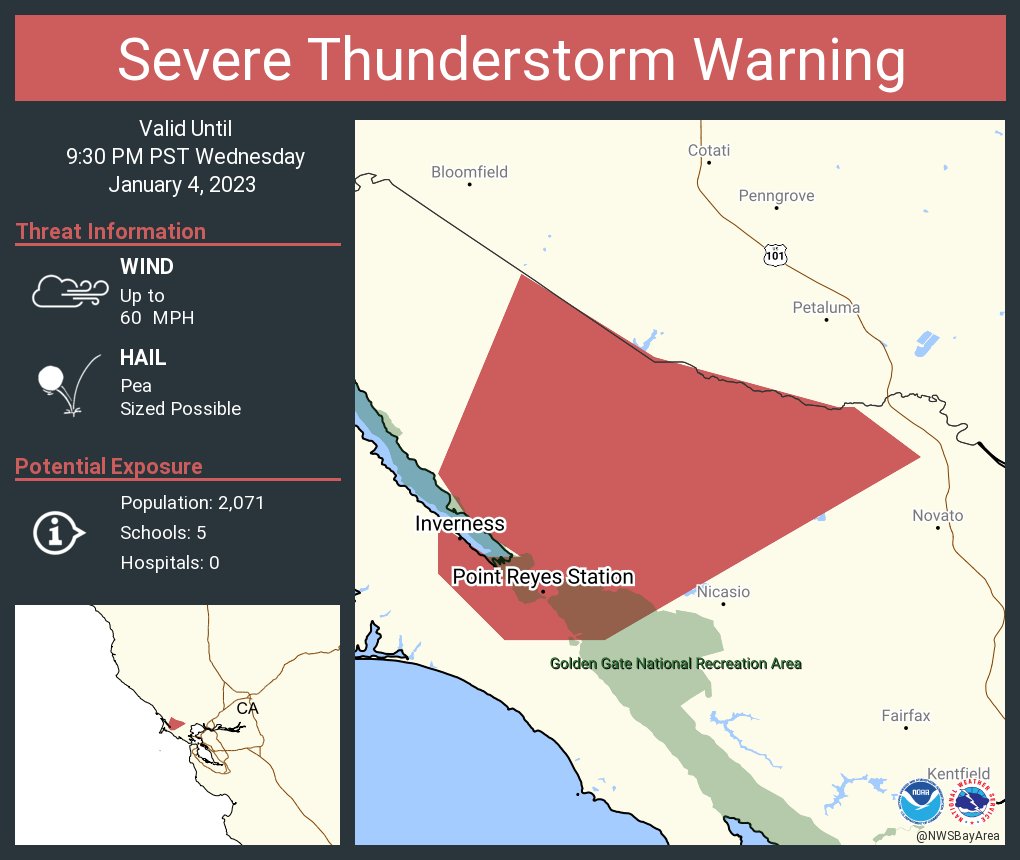
Rare Severe Thunderstorm Warning |
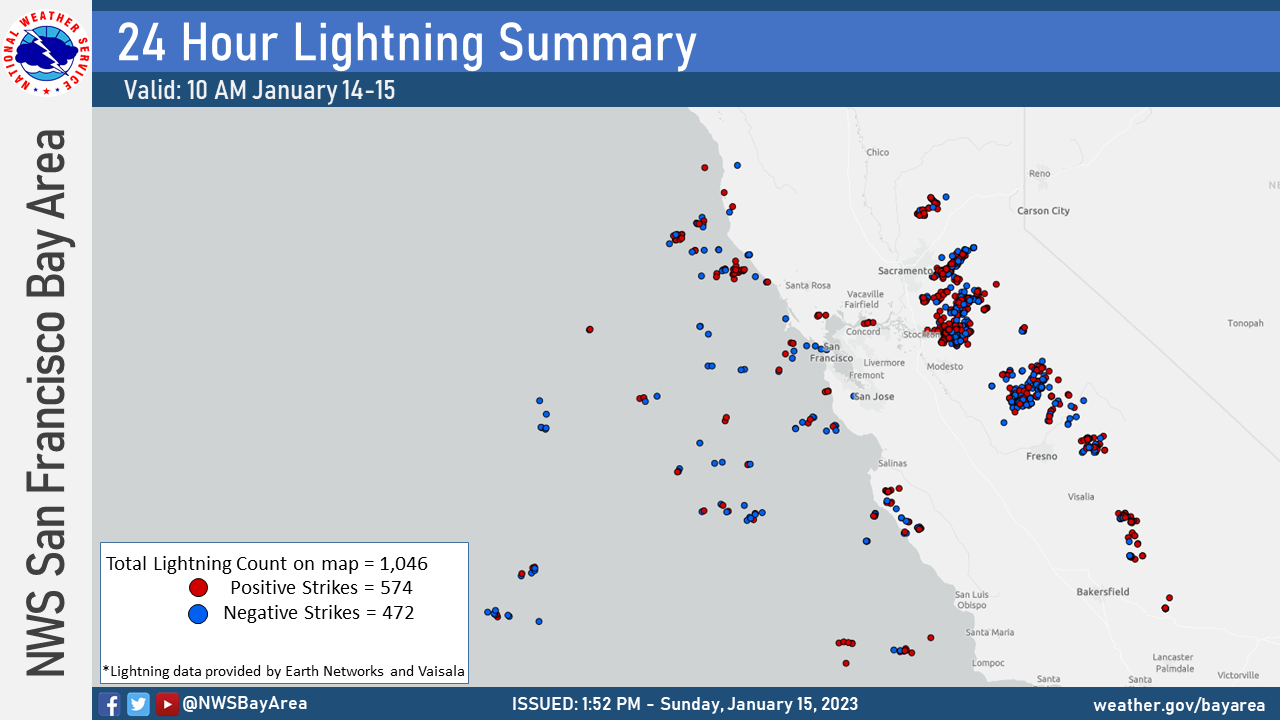
One of the bigger bursts of lightning activity during the three week period. |
 |
 |
 |
|
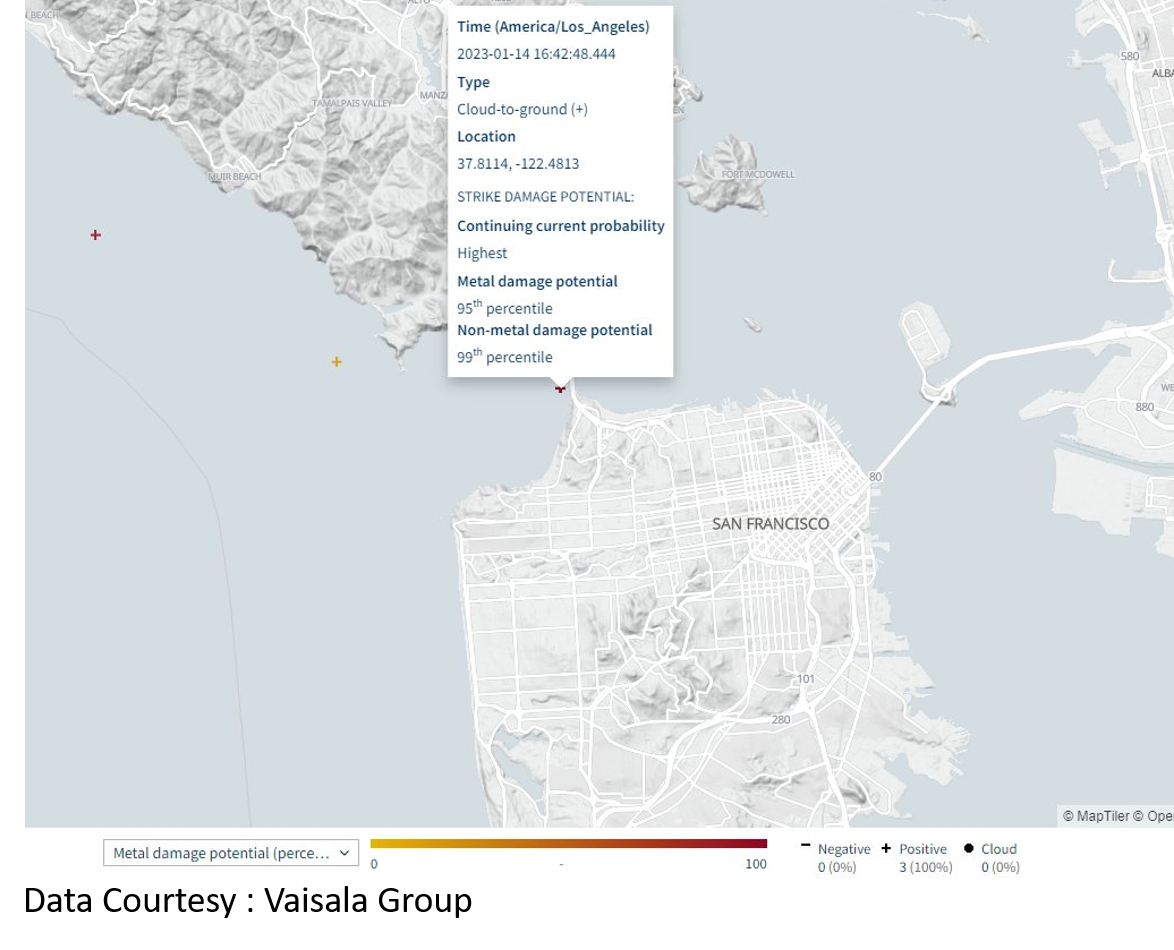
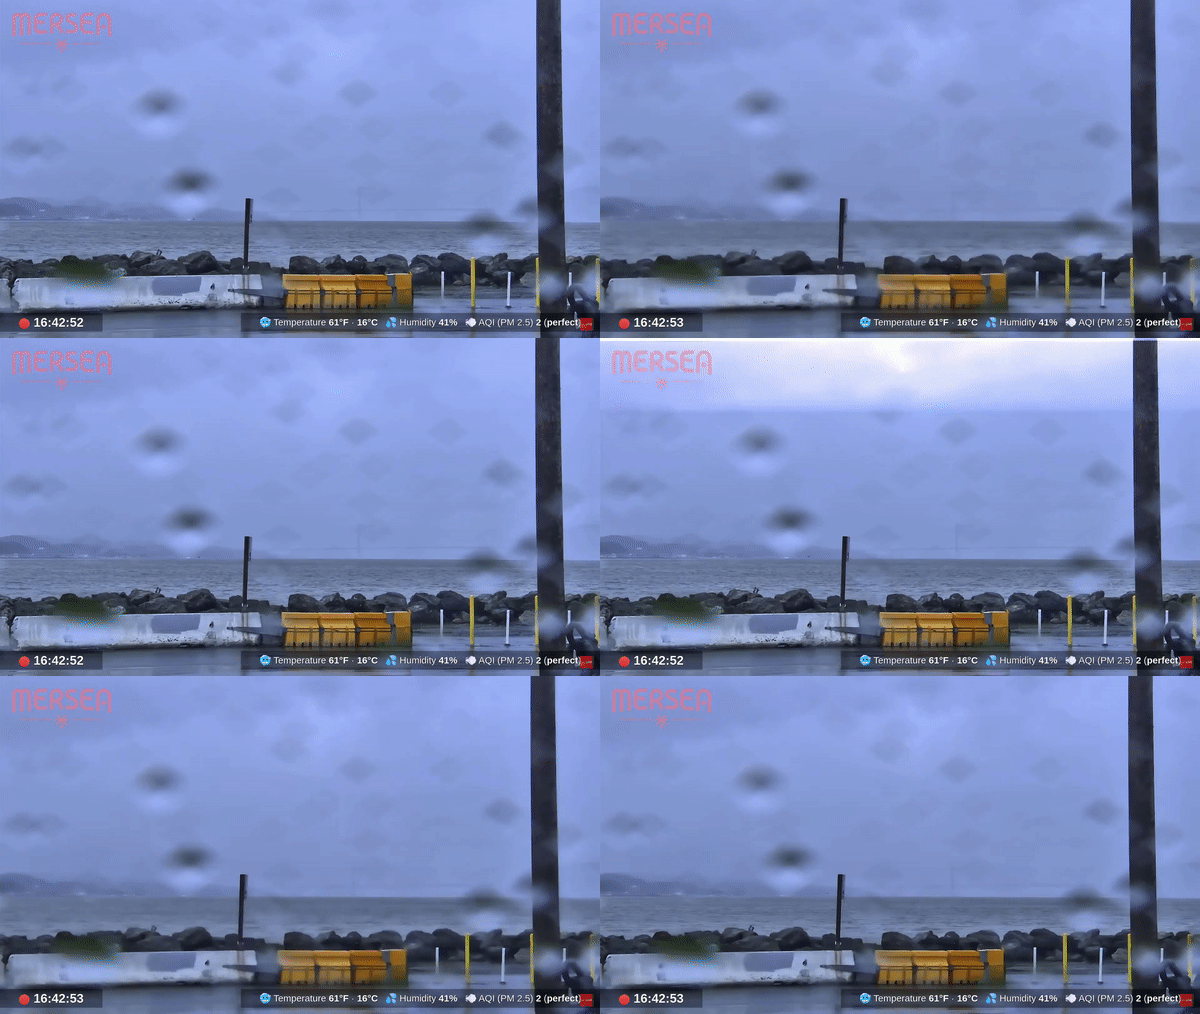
Lightning sensors detect strike of the Golden Gate Bridge. |
Lightning strike hitting the Golden Gate Bridge. |
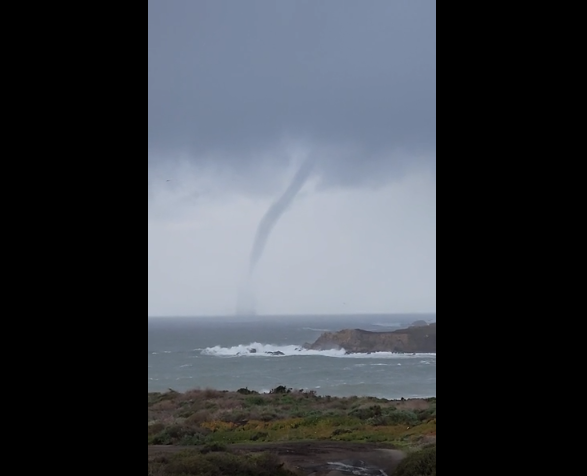
Waterspout off Sonoma Coast Photo by Crazy_specific_9407 |
Surf
 |
 |
 |
|
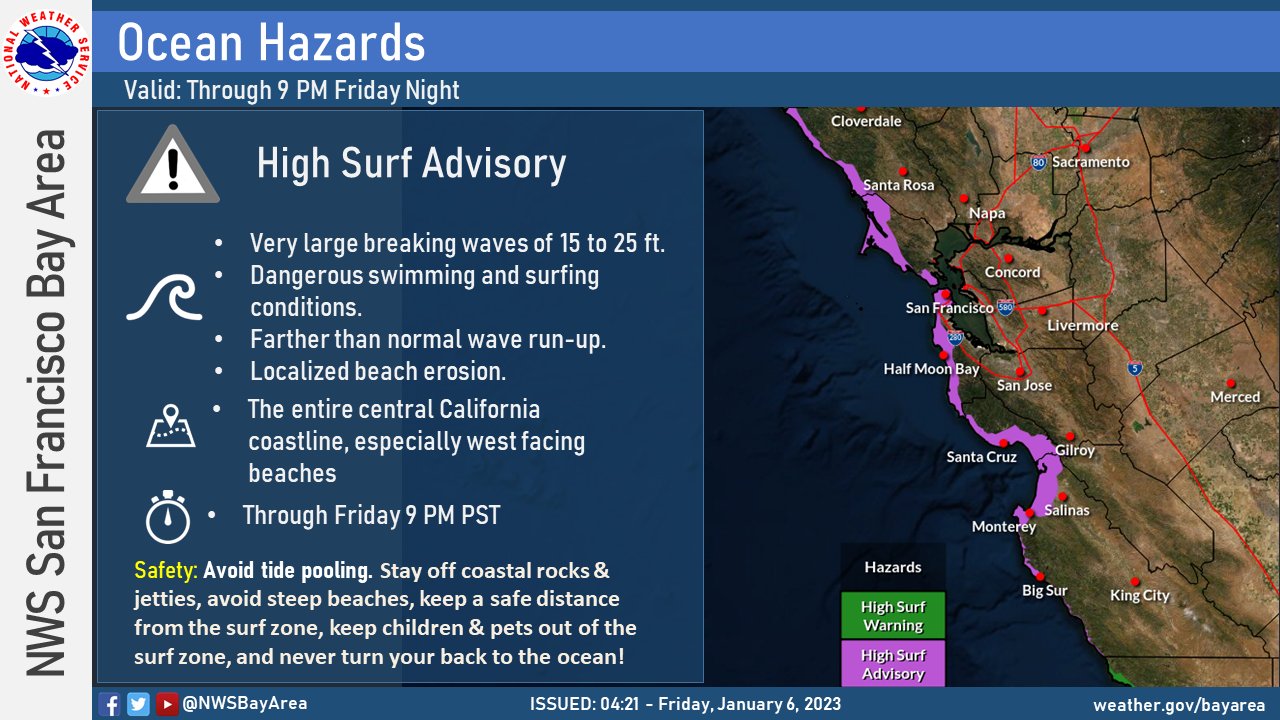
High Surf Advisory for entire Bay Area Coastline |
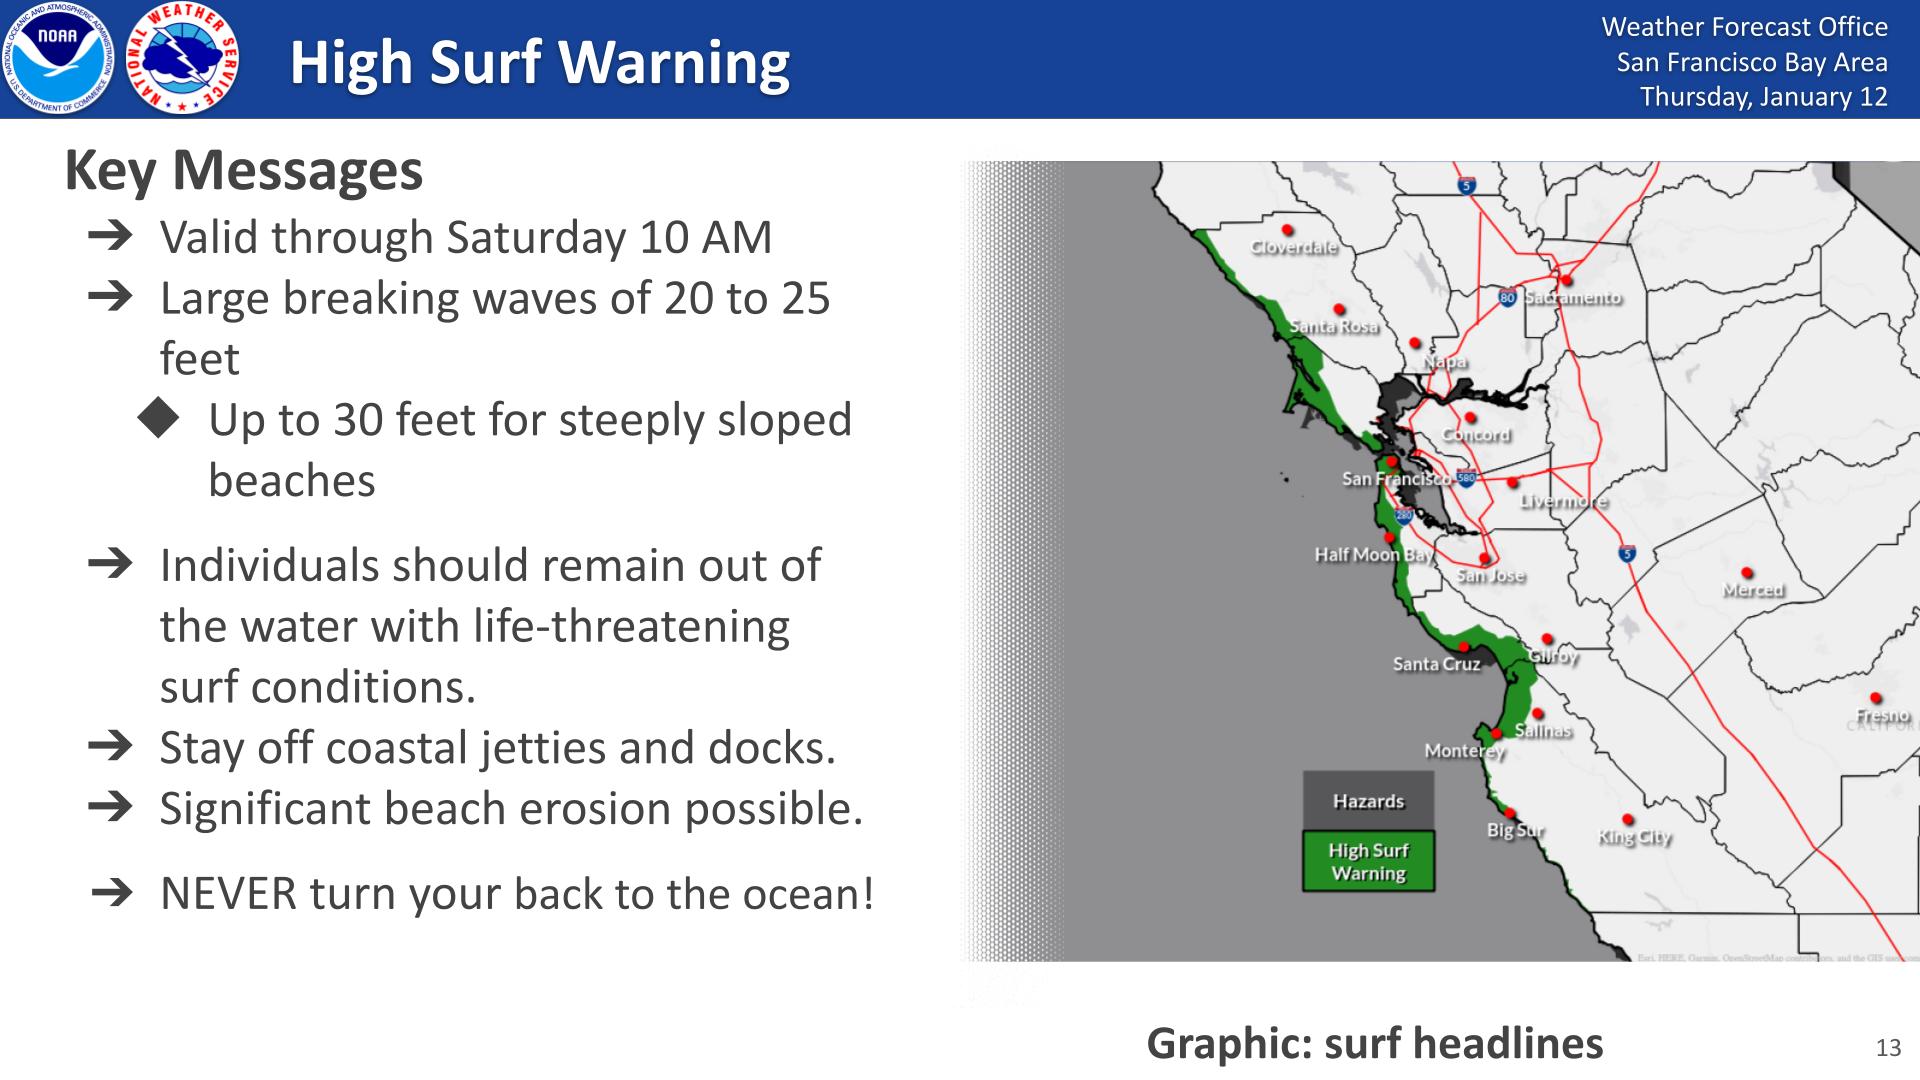
High Surf Warning for entire Bay Area Coastline |
Daily record buoy wave heights outside of Monterey Bay. |
 |
 |
 |
|
Daily record buoy wave heights outside of near Point Reyes. |
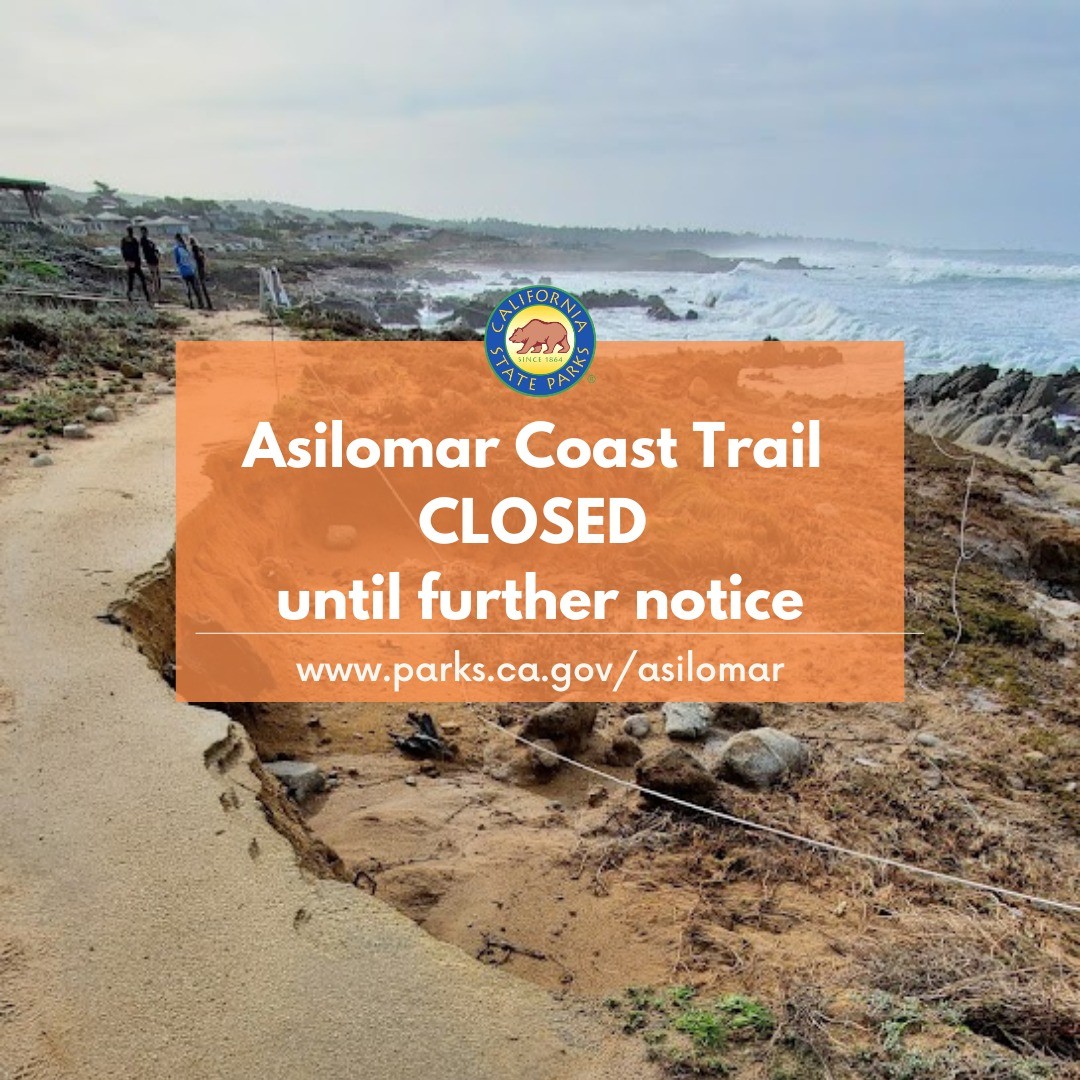
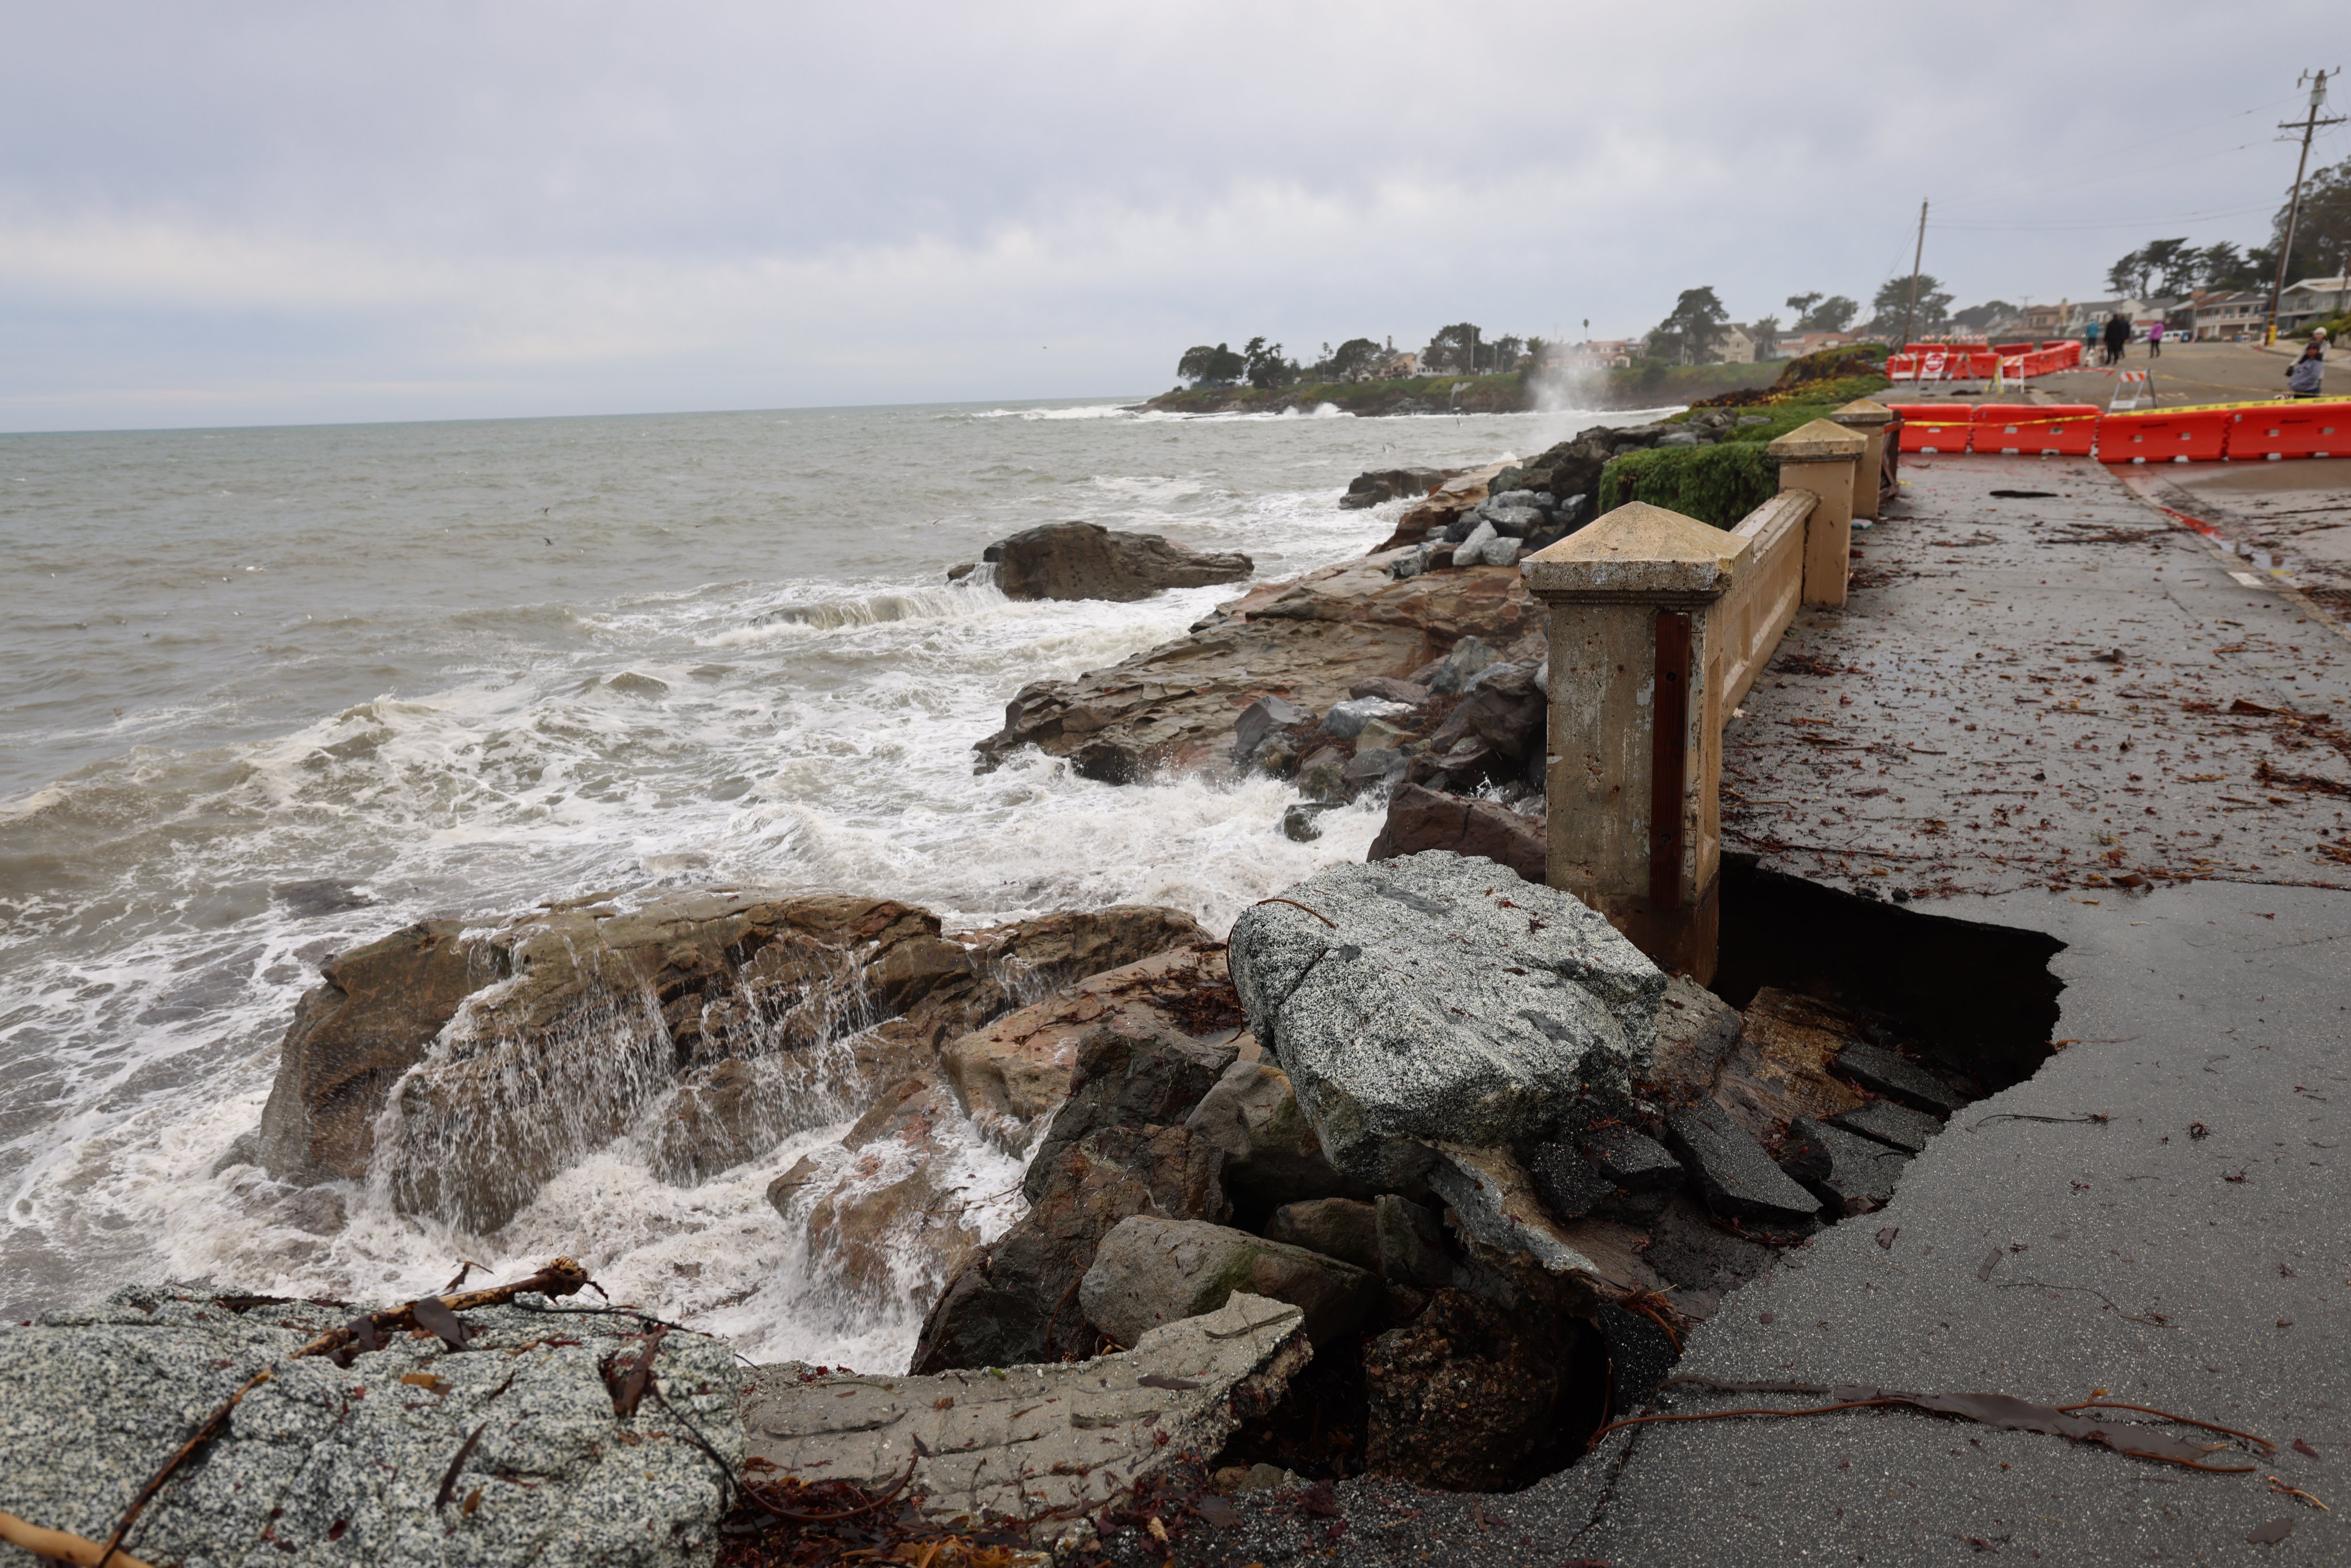
Surf damage in Pacific Grove. |
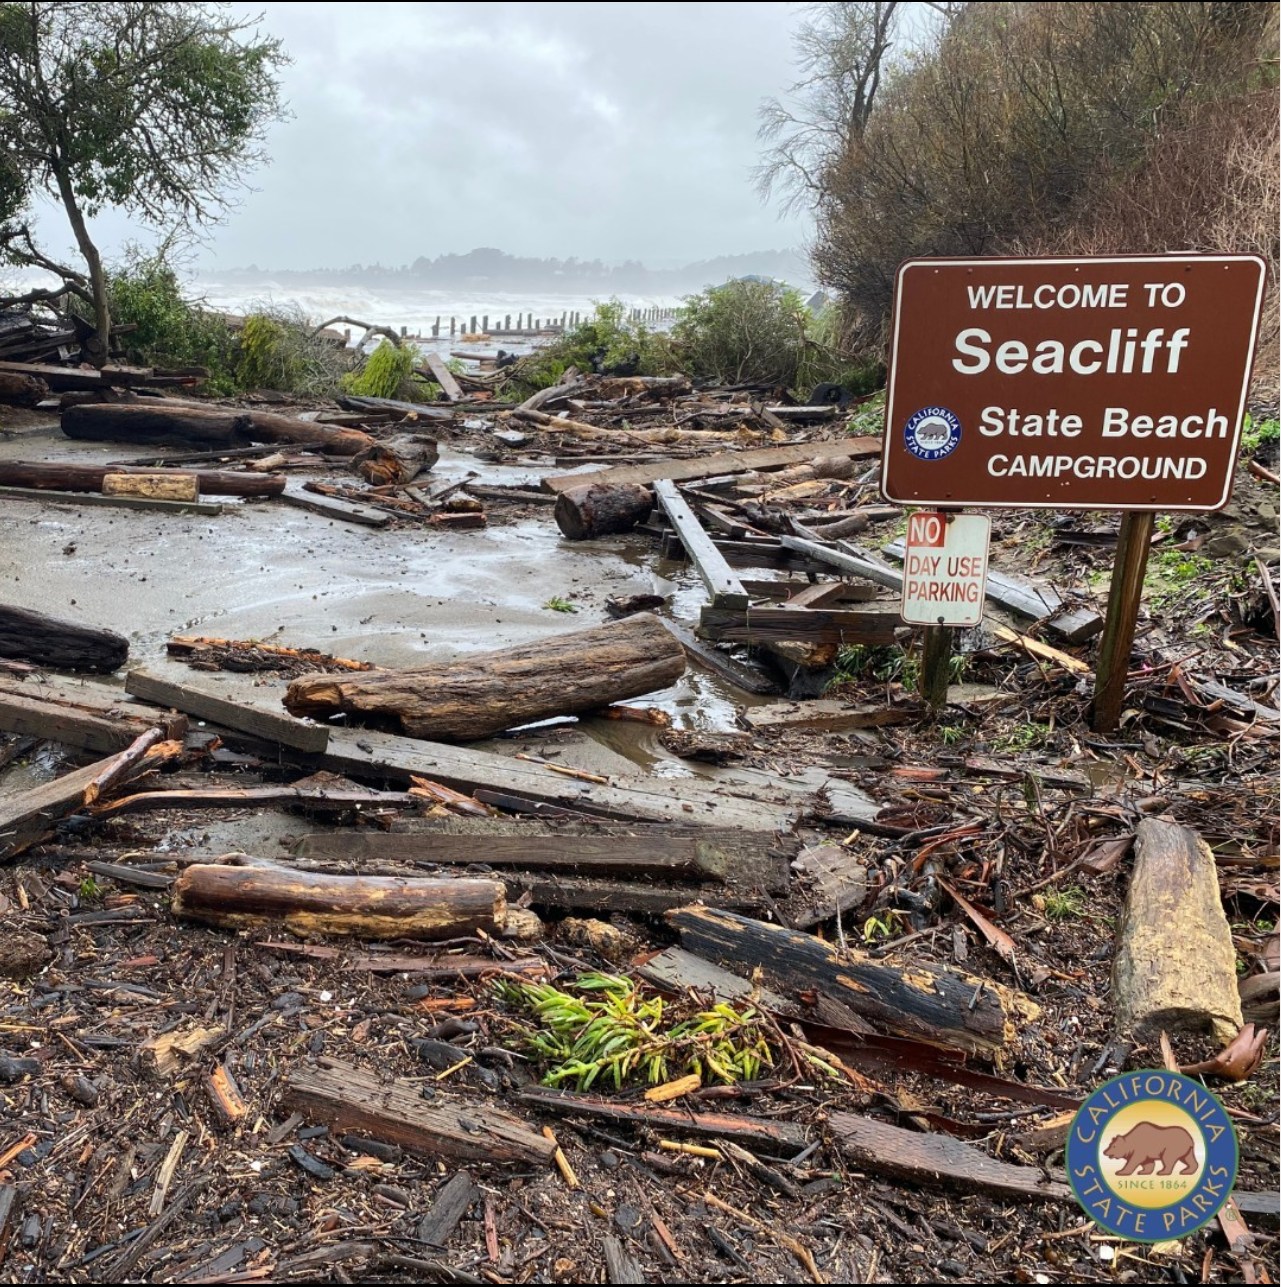
Surf damage in Seacliff SB. |
 |
 |
|
|
Damage to West Cliff Dr Santa Cruz Photo by @DustinMulvaney |
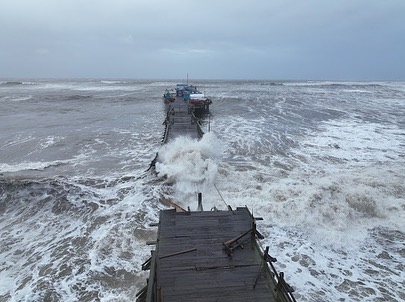
Capitola Wharf Damage Photo by Mark Woodward & @NativeSantaCruz |
 |
Media use of NWS Web News Stories is encouraged! Please acknowledge the NWS as the source of any news information accessed from this site. |
 |