Tropical system in the Gulf expected to gradually strengthen the next couple of days off the Florida Panhandle and Alabama coasts. Instances of flash flooding will be possible through Thursday along the eastern and central Gulf Coast. Severe thunderstorms will develop and move along a cold front crossing the Upper Midwest, and through the Ohio Valley/Mid-Atlantic on Tuesday. Read More >
Overview - December 14, 2024 Convection
|
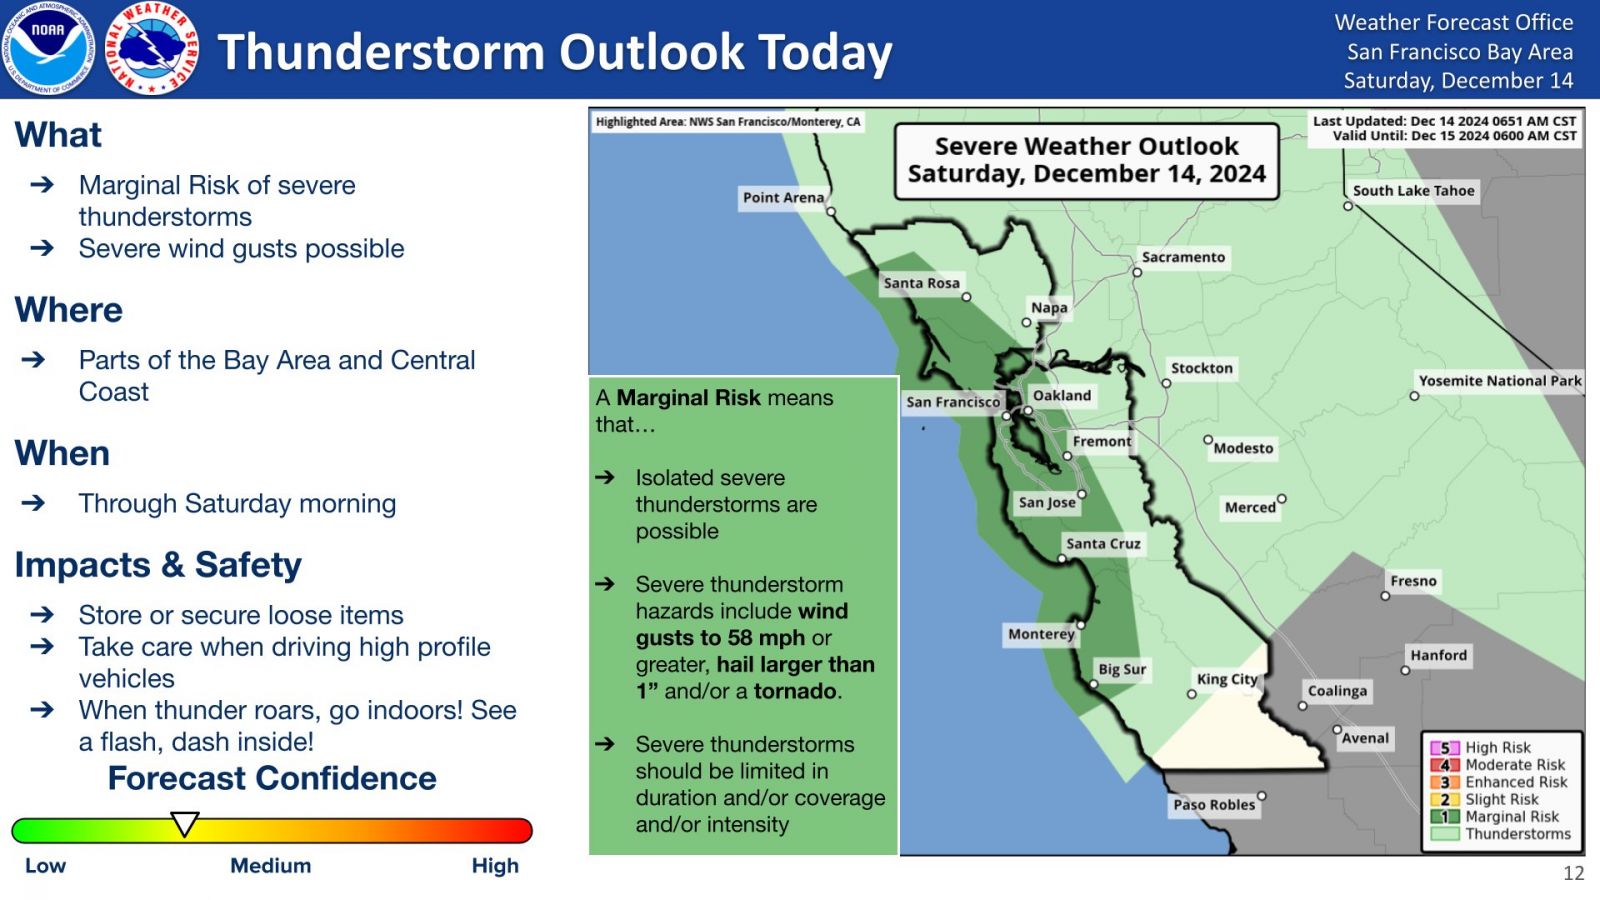
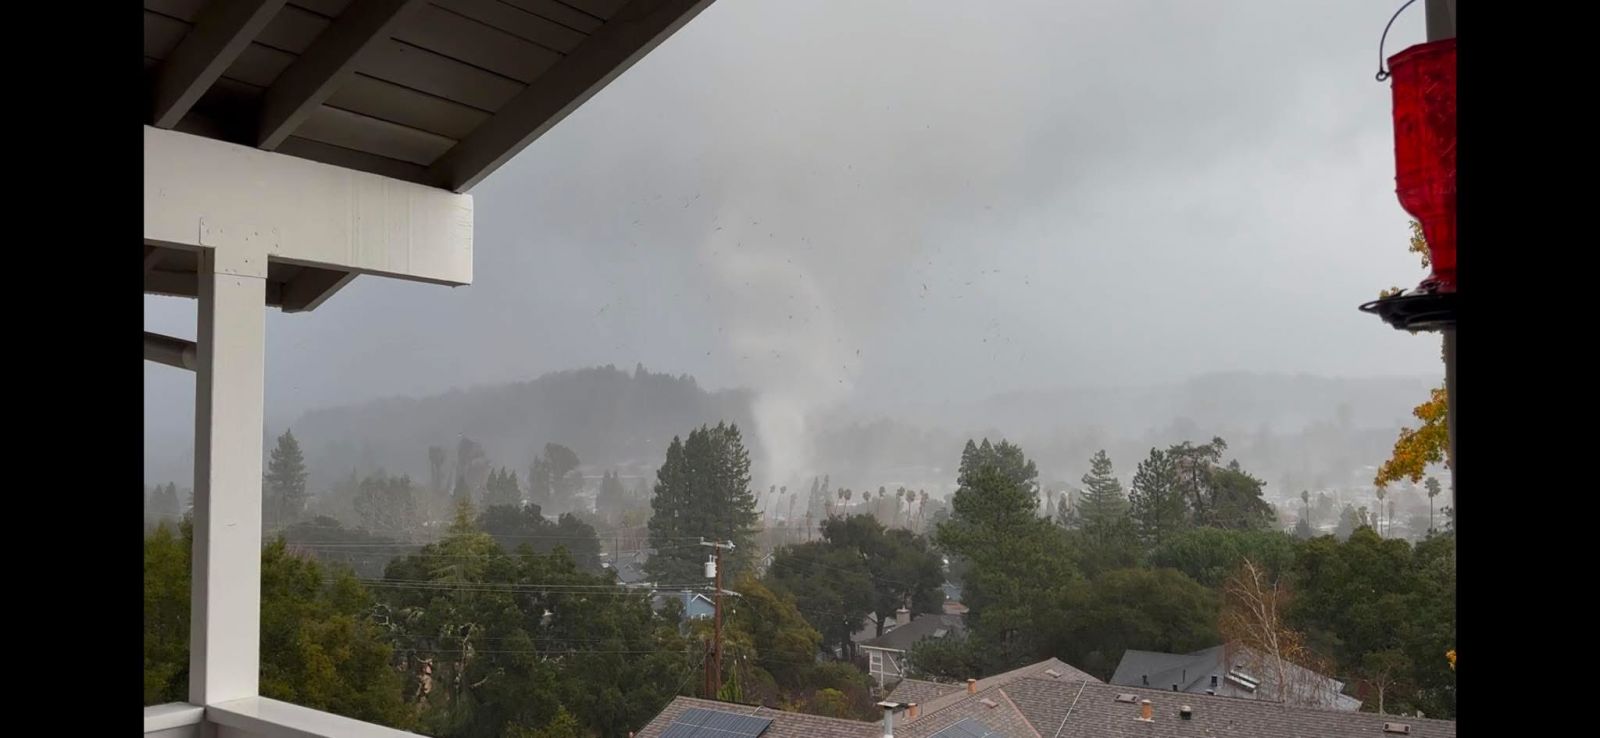
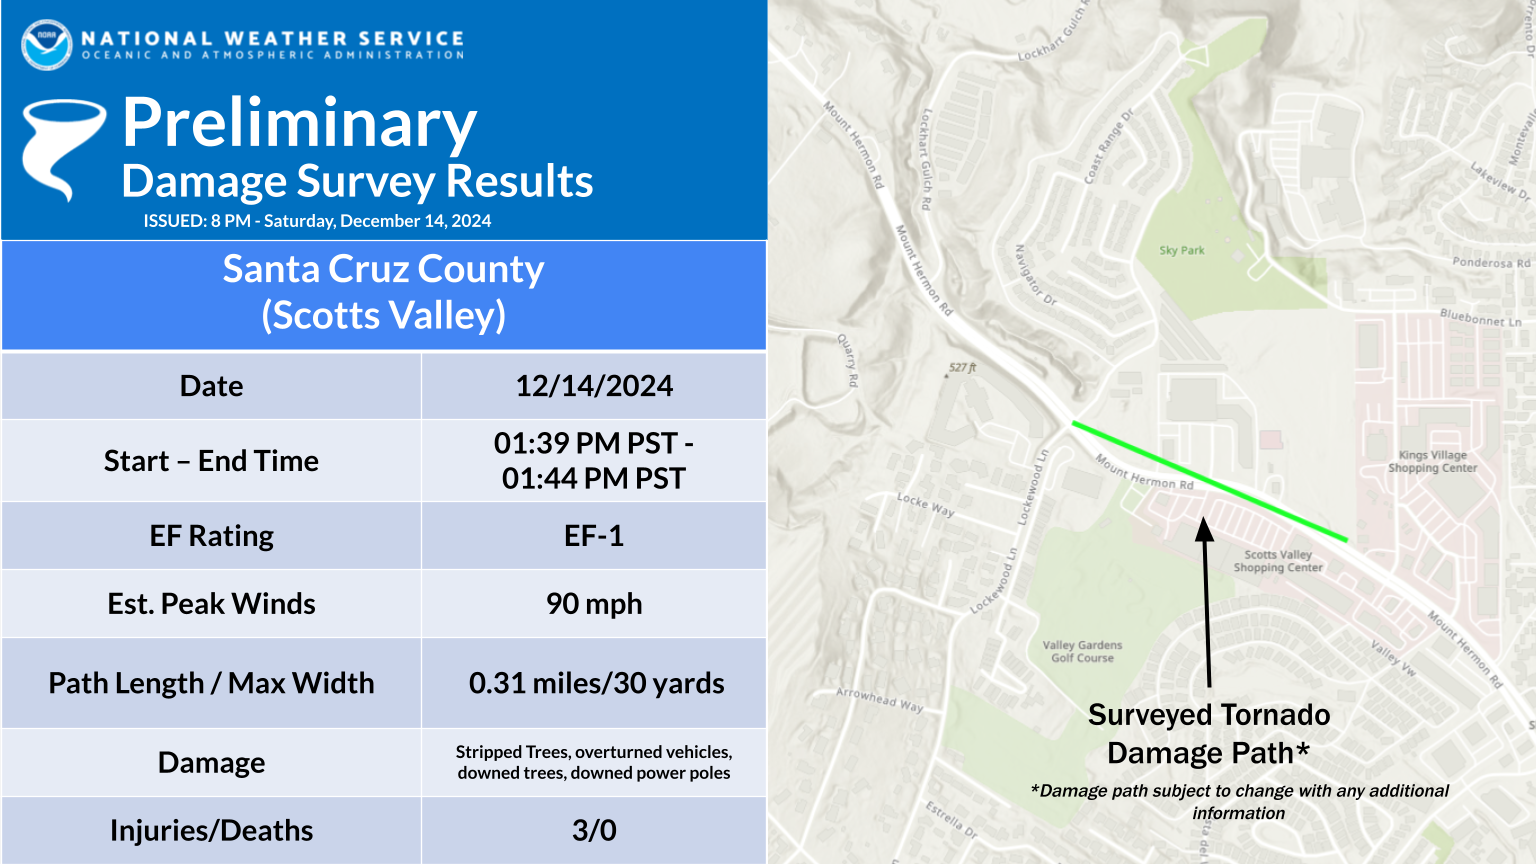
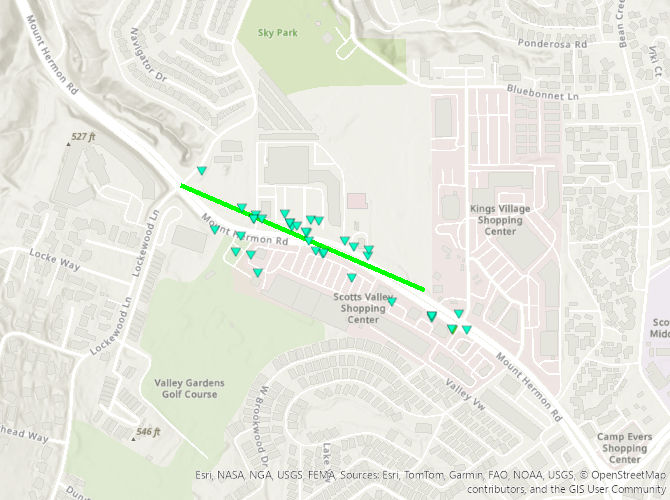
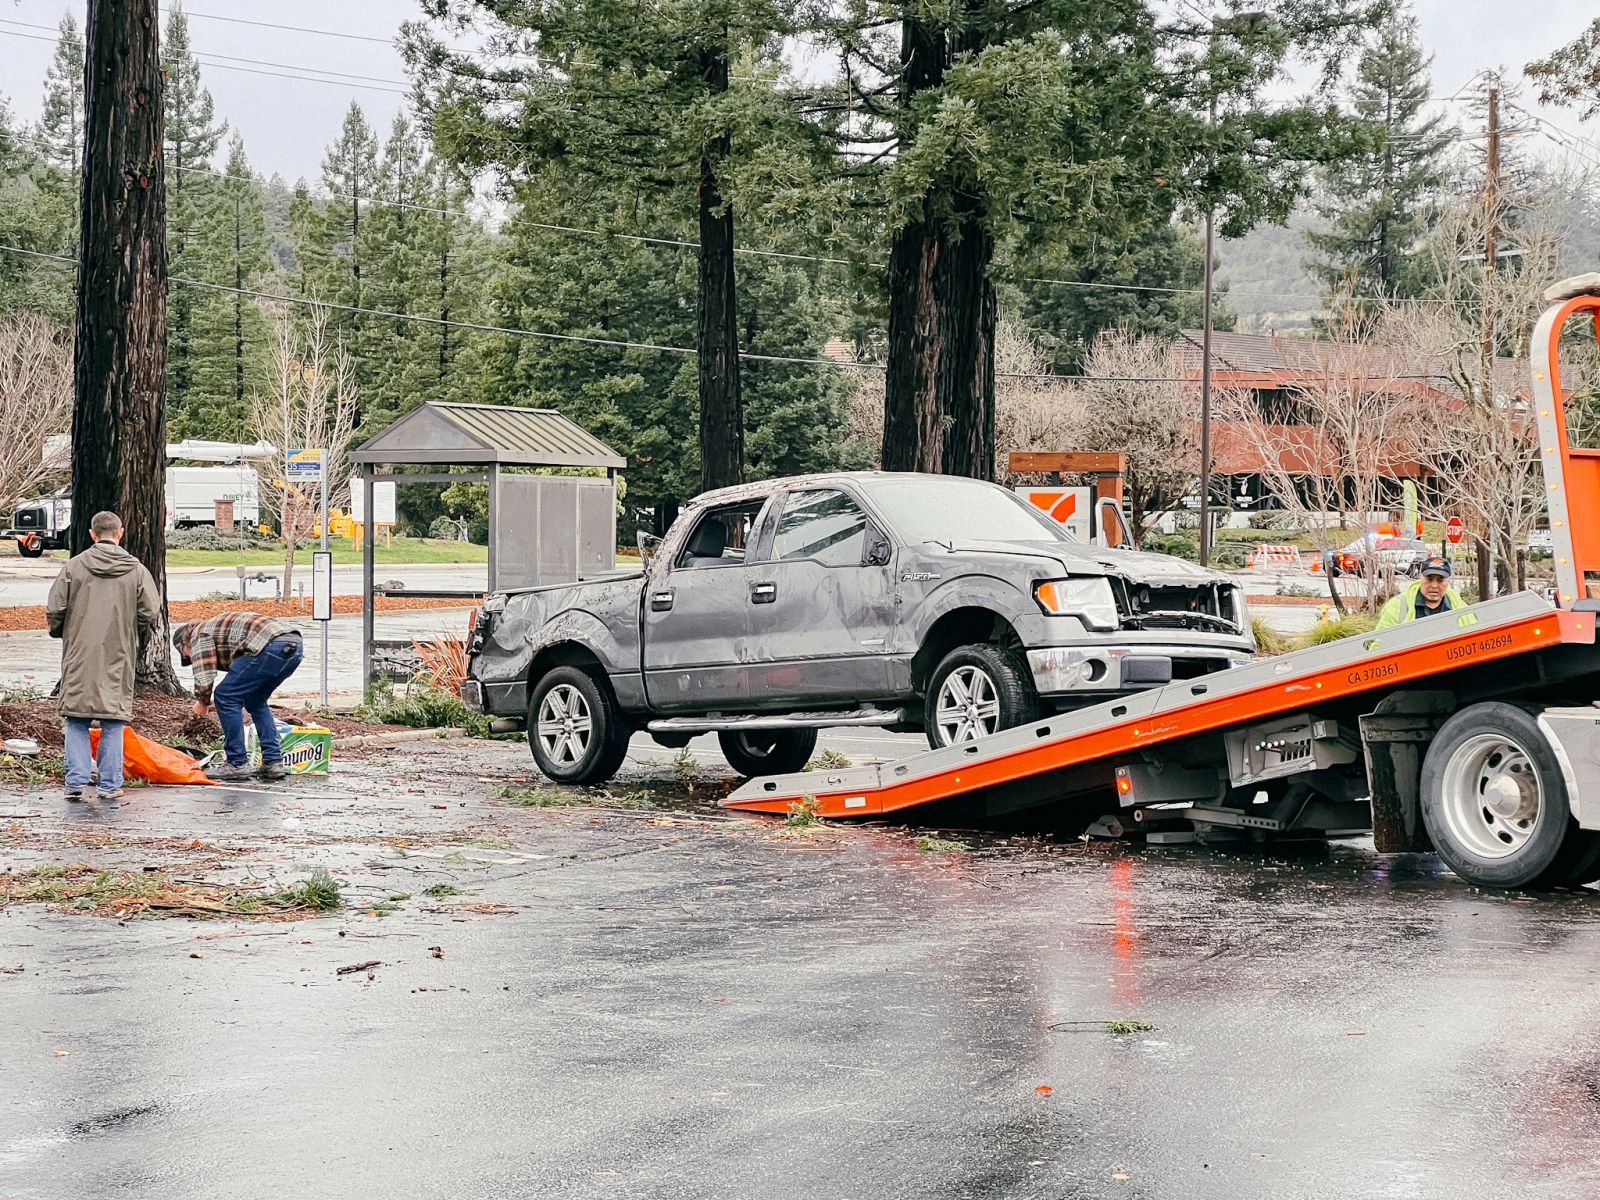
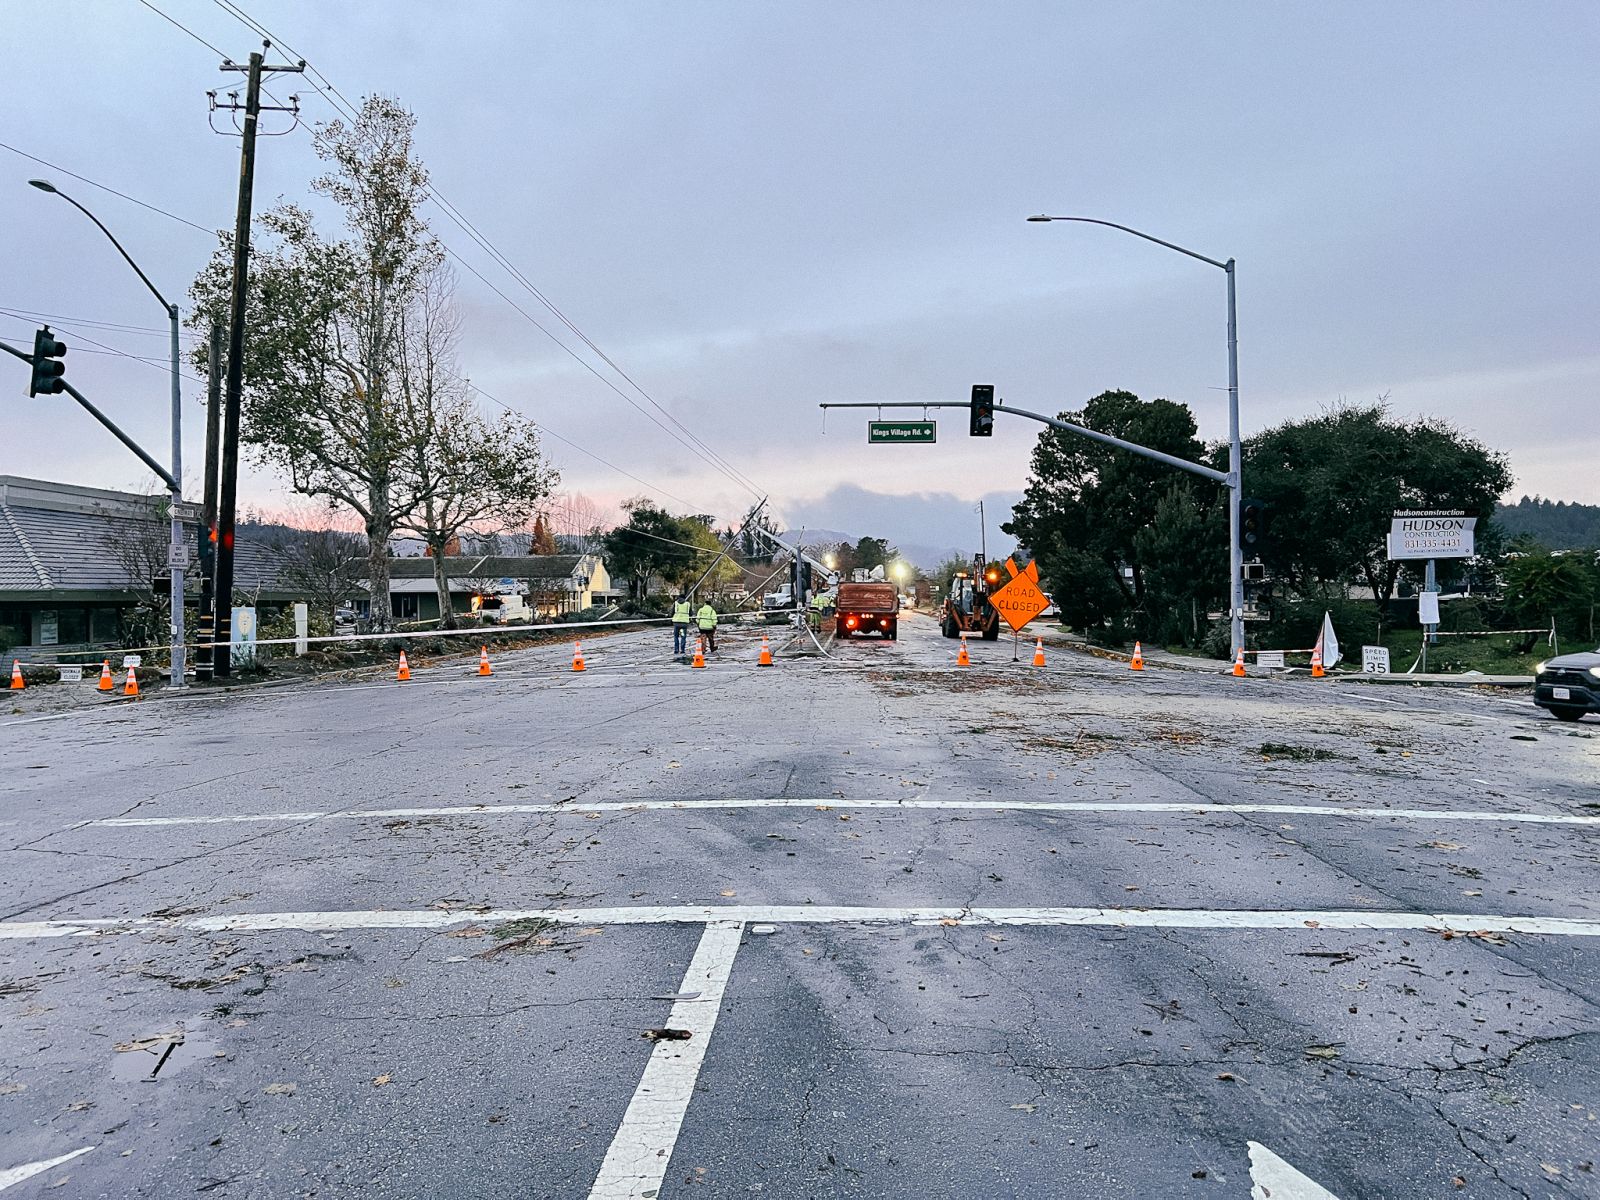
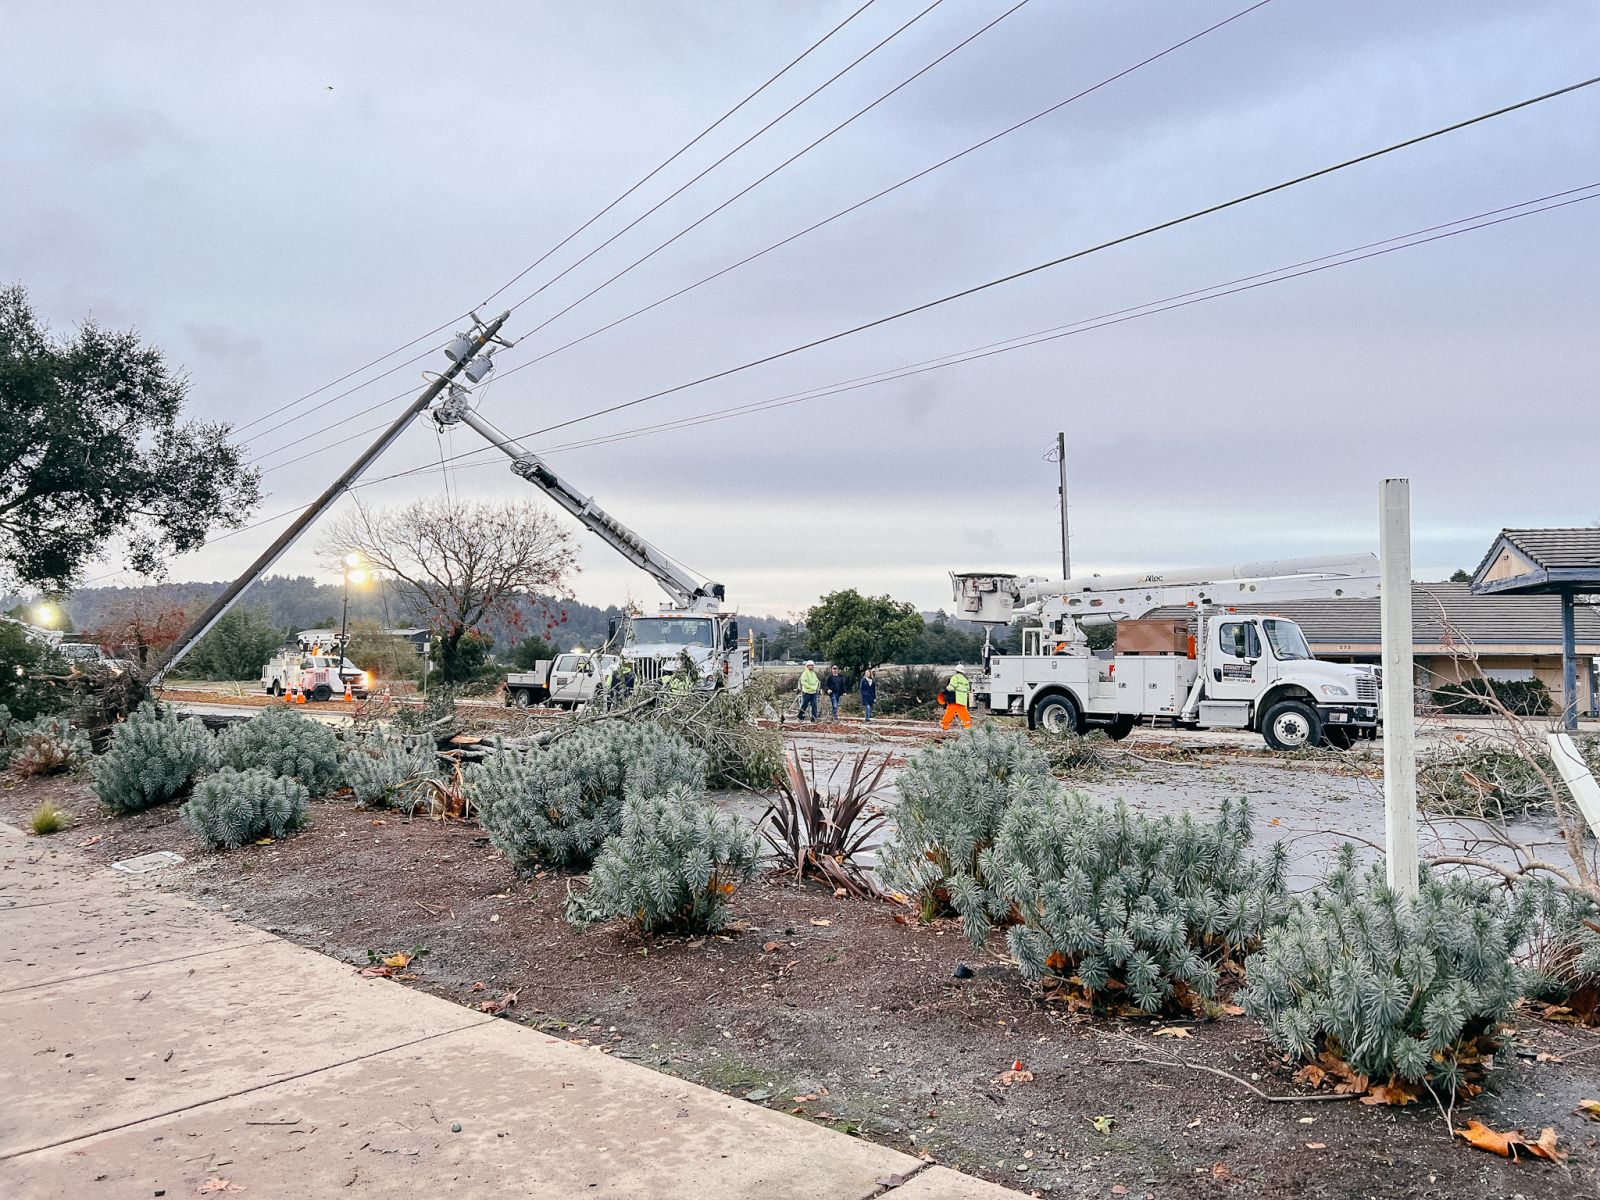
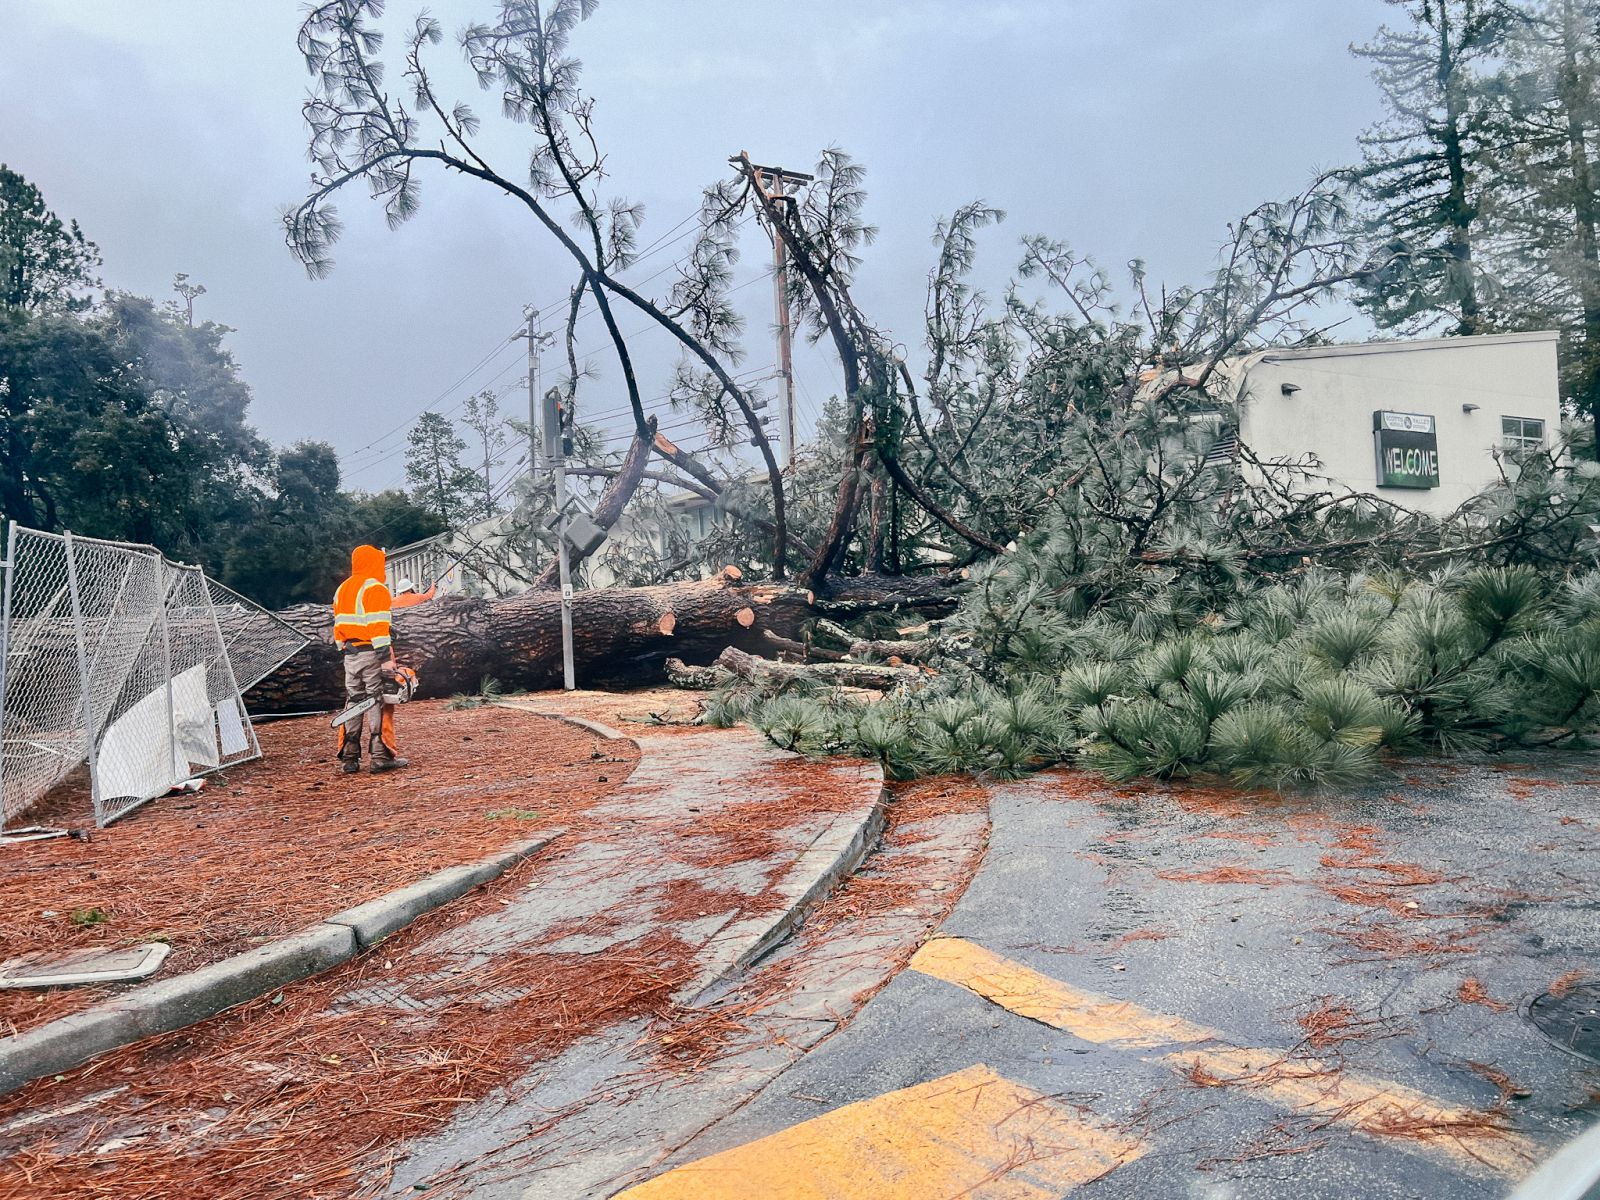
A dynamic and energetic environment developed across the Bay Area and Central Coast on December 14, 2024, thanks in part to: an elongated upper level trough off the California coast, a robust surface cold front, cold advection aloft resulting in an unstable atmosphere, and upper level jet stream support. Given the larger scale set up, the Storm Prediction Center Day 1 Convective Outlook highlighted a good portion of the Bay Area in a Marginal Risk for severe thunderstorms (see below). On average, a Marginal Risk touching a portion of the Bay Area occurs roughly once a year. In other words, it's not super common. The day began with a very potent line of pre-sunrise thunderstorms rolling through San Francisco, which prompted the issuance of a rare Tornado Warning for the Bay Area. A storm survey was conducted by the NWS Bay Area and it was determined the damage observed was associated with straight-line winds. This initial surge of storm activity was associated with the a strong cold front. The cold front ultimately pushed through the Bay Area and Central Coast late morning into early afternoon. Behind the cold front the atmosphere remained unstable due to cold advection aloft. The lingering instability resulted in another wave of thunderstorms into the afternoon. Special Marine Warnings and Severe Thunderstorms were issued to convey potential threats (see right). One particular thunderstorm stood out from the rest. This low-topped supercell initially developed over the coastal waters. As it moved inland near Davenport it began to intensify and peak intensification occurred near Scotts Valley resulting in a tornado. A storm survey was conducted and based on damage indicators the strength of the tornado was determined to be an EF-1. For more details on the storm survey and radar analysis see below.
MMehle/LBain
|
|
Tornado
|
Tornado - Scotts Valley
|
||||||||||||||||
|
||||||||||||||||
The Enhanced Fujita (EF) Scale classifies tornadoes into the following categories:
| EF0 Weak 65-85 mph |
EF1 Moderate 86-110 mph |
EF2 Significant 111-135 mph |
EF3 Severe 136-165 mph |
EF4 Extreme 166-200 mph |
EF5 Catastrophic 200+ mph |
 |
|||||
Radar Imagery
The radar image below is a "supplemental" radar to the Bay Area. This radar is part of the Advanced Quantitative Precipitation Information (AQPI) system. It is a regional project that uses enhanced weather radar to track atmospheric river precipitation. These smaller and more local radars can provide more accurate information on precipitation intensity, which can aid in flooding potential. On December 14, this radar located in Santa Cruz had a better "picture" of the developing hook echo from the Mini-Supercell. For more info on the AQPI Project visit https://cw3e.ucsd.edu/aqpi/
 |
| Radar image from AQPI radar located in Santa Cruz. Notice the hook structure. |
Below is a radar animation from our standard WSR-88D radar KMUX. The strong thunderstorm initially develop off the Santa Cruz coast before tracking inland and ultimately over Scotts Valley.
 |
| Scotts Valley Mini Supercell Animation |
The annotate imagery below highlights a Weak Echo Region (WER). The appearance of the WER specifically is an indicator of robust updraft and increased inflow into the storm. The hook echo is often associated with a mesocyclone and indicates favorable conditions for tornadogenesis. 2) If we take a look at the reflectivity data at higher tilts, the 1.8° and 3.0° elevation angles, we can identify a quasi Bounded Weak Echo Region(BWER) . Similar to a WER, the presence of a BWER also is indicative of a robust thunderstorm updraft.
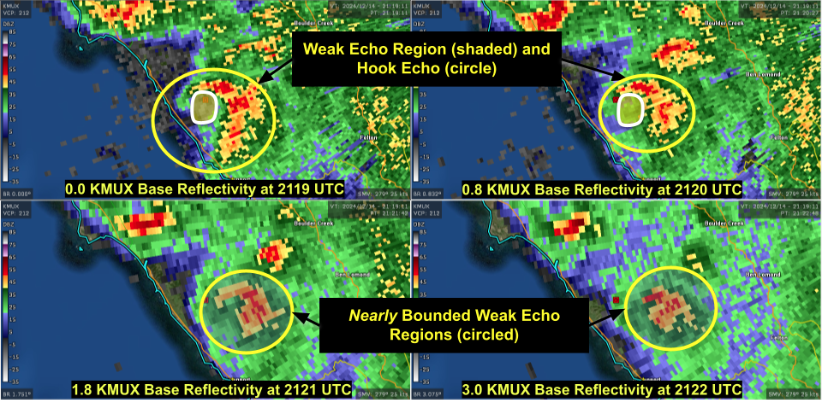 |
| Annotation of KMUX Base Reflectivity from 0.0°, 0.8°, 1.8°, and 3.0° elevation angles of the Scotts Valley Mini Supercell 21:19-21:22 UTC |
Of course, we cannot simply use reflectivity for tornado warning decision making without examining the velocity imagery in tandem with base reflectivity imagery. Velocity captures/annotations are of the Base Velocity data. Per the image below, the biggest takeaway is that the enhanced radial velocities on the right flank or right side of the convective cell easily exceed 30 knots. KMUX estimated inbound velocities of over 60 knots at the 0.0° (and at higher tilts aloft).
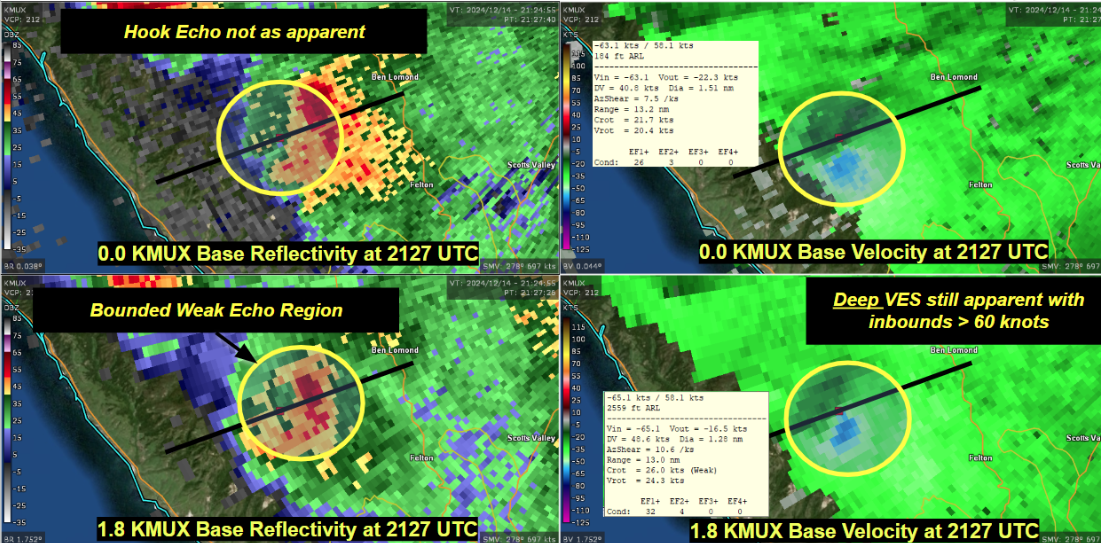 |
| Annotation of KMUX Base Reflectivity (Left) and Base Velocity (Right) from the 0.0° elevation angles of the Scotts Valley Mini Supercell at 21:19 UTC |
If we examine the VES with height, we notice that between the 0.0° and the 0.8° KMUX elevation angles it’s still quite discernable. What’s impressive here is that the signature exists over a depth of at least 1200 feet (and actually a little higher) which gives us HIGH confidence that the radar is sampling noteworthy inbound radial velocities. Note the Azumithul Shear (AzShear) as well as the Rotational Velocity (VRot ) values in the readouts below (24 to 26 knots). At the 0.0° slice, the VRot is 24.3 knots with an AzShear value of 0.245 m s-1.
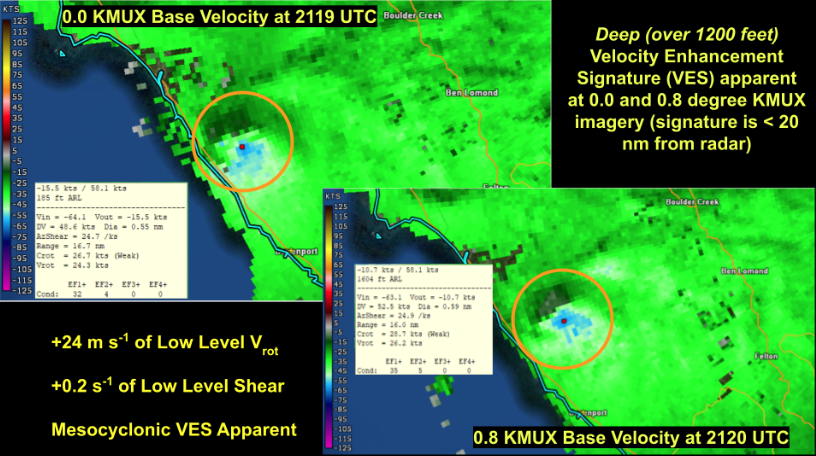 |
| Annotation of KMUX Base Velocity at 0.0° (top left) and 0.8° (bottom right) elevation angles of the Scotts Valley Mini Supercell at 21:19 UTC |
 |
Media use of NWS Web News Stories is encouraged! Please acknowledge the NWS as the source of any news information accessed from this site. |
|