10th Anniversary of the May 2010 Flood
What Caused the Event and
Improvements Made in Community Preparedness
Back-to-back record breaking rains fell on Saturday, May 1, and again on Sunday, May 2, causing widespread flash flooding and river flooding across much of the mid state. The storm killed 18 people in Middle Tennessee and at least 27 in all of Tennessee and Kentucky. Property damage estimates exceeded two billion dollars and helped prompt a Presidential Disaster Declaration for many counties in West and Middle Tennessee. In addition to the flooding, several rounds of severe thunderstorms, some of which caused extensive wind damage and six tornadoes also impacted the region.
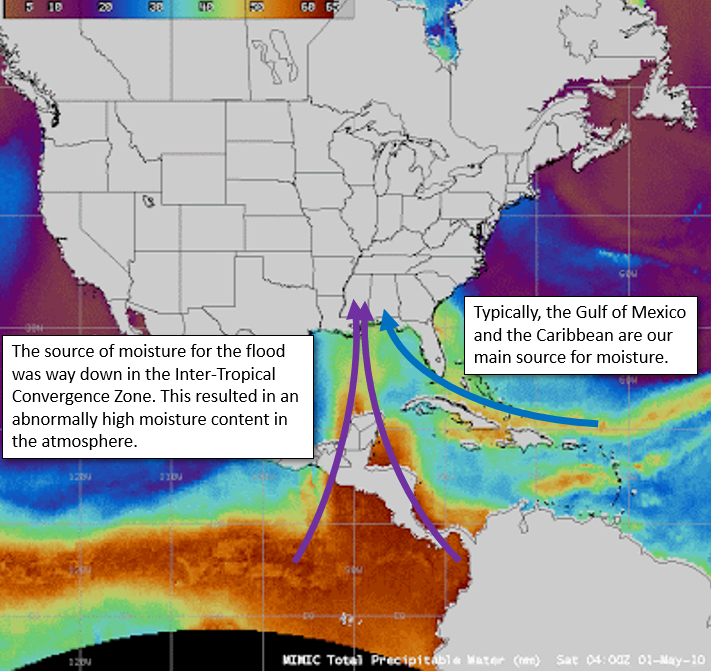
Nashville experienced its all-time rainiest day AND third-rainiest day on back-to-back days with National Weather Service weather records dating back to the early 1870s. Several weather factors caused this complex disaster with the main culprit being a very slow-moving low pressure system at upper levels of the atmosphere. This combined with a stalled front just west of Tennessee and a plume of unusually rich moisture from the tropics took aim on the state.
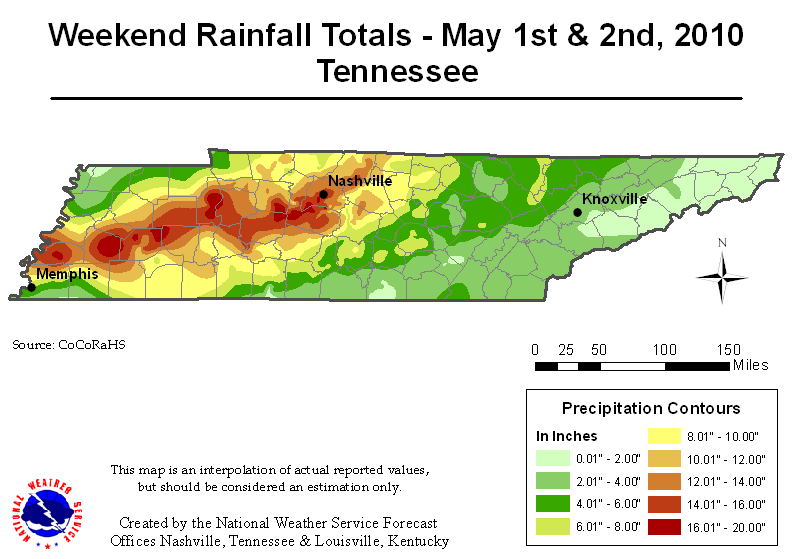
Rainfall Totals & Records
Rainfall records were shattered on May 1st and May 2nd, 2010 -
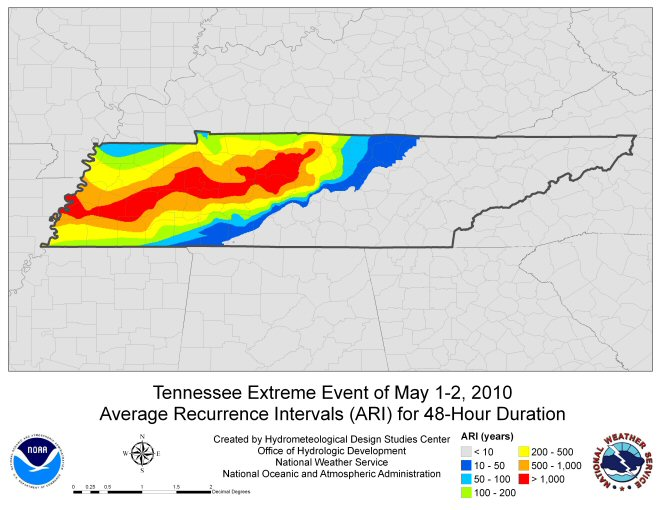
1,000-Year Flood Event
What is a 100 year flood? A 100 year flood is an event that statistically has a 1% chance of occurring in any given year. A 500 year flood has a 0.2% chance of occurring and a 1,000 year flood has a 0.1% chance of occurring.
The map below relates the amount of rain that fell to the chances of that amount of rain actually occurring -
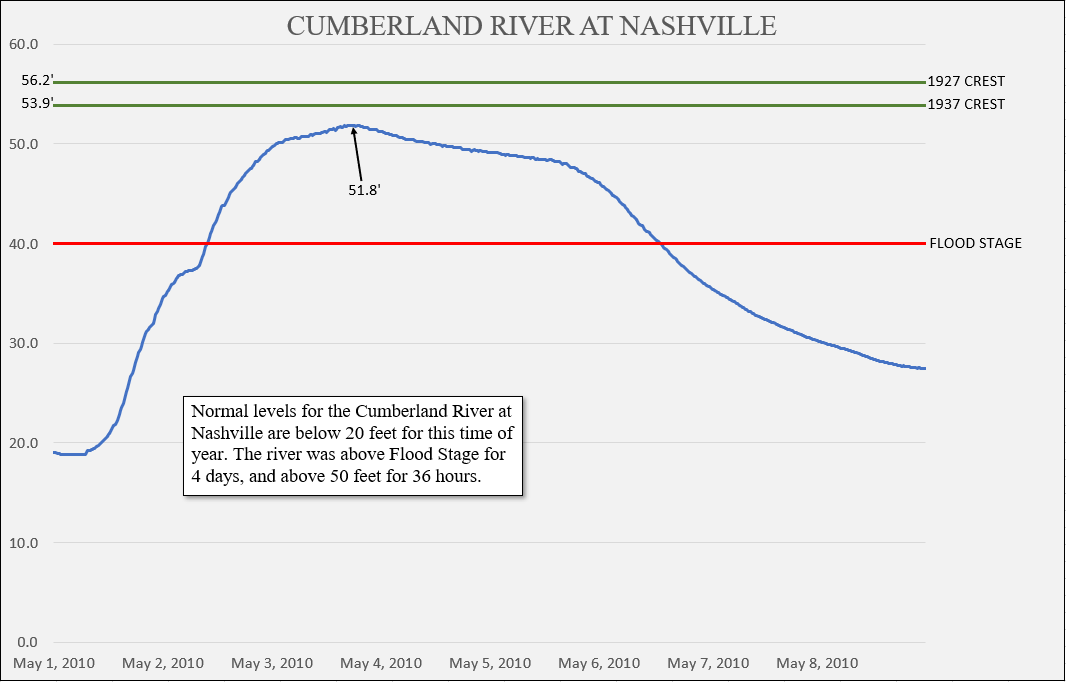
This rainfall created a flood event that set record crests at a number of gauges across Middle Tennessee. This is something rarely seen, especially when records date back 50 to 100 years. The Cumberland River at Nashville caused tremendous damage when it rose to 52.55 feet on May 3rd, but fell well short of the highest crest on record - 56.20 feet. This record crest was set back in 1927, before dams controlled the flow of the Cumberland and its tributaries. It has been speculated by the U.S. Army Corps of Engineers that if there was no control of the river, the water level in the May Flood would have come close to or even exceeded 56 feet in downtown Nashville.
A record crest of 62.58 feet was set on the Cumberland River at Clarksville, which is just over 5 feet higher than the previous record crest of 57.10 feet set in the 1979 Flood. The Cumberland River at Clarksville rose not just from the water coming down the main-stem portion of the river, but also from the significant inflows from two major tributaries – the Red River and Harpeth River.
The Red River set a new record crest of 49.48 feet at the gauge near Port Royal, and the Harpeth River reached record levels at three locations on the river. The gauge at Franklin crested at 35.32 feet, which is just a few inches above the previous record of 35.14 feet set in 1948. Downstream at the gauges near Bellevue and Kingston Springs, the river level was so high it ended up washing the gauges away. High water marks show the river level at Bellevue reached 33.32 feet, which is almost 9 feet higher than the previous record of 24.34 feet set in 1948. Kingston Springs also saw an extreme river level surveyed with high water marks indicating a crest at 46 feet, which is about 14 feet higher than the previous record set in 1946. Gauge data for the Harpeth River at Bellevue and Kingston Springs dates back to the early 1920s, which really shows the magnitude of this event.
In the Nashville Metro area, many of the creeks and streams surpassed levels not seen since the 1979 Flood. Browns Creek at the State Fairgrounds crested at 13.44 feet which is 5 feet higher than the previous record set in 1993, and Whites Creek in Bordeaux crested at 25.82 feet, which is over 6 feet higher than the previous record set in 2002. The Mill Creek at Woodbine gauge set a new record crest of 21.37 feet and the Antioch gauge set a record crest of 26.10 feet. The previous record for Woodbine was 20.63 feet and the previous record for Antioch was 23.78 feet, both set in 1979. Richland Creek crested at 19.99 feet, which is almost 5 feet higher than the 1979 Flood level of 15.13 feet.
Elsewhere in Middle Tennessee, record levels were set on portions of the Duck River and Buffalo River. The Duck River near Hurricane Mills washed away the gauge and a crest of 34.21 feet was surveyed from high water marks (previous record 30.70 feet set in 1948). Upstream at Centerville, a record crest of 47.50 feet was set which is almost 10 feet higher than the 1948 crest of 37.58 feet. The Duck River at Columbia did not set a record crest, but did reach its 7th highest level on record with 44.91 feet. The Buffalo River near Lobelville crested at 26.00 feet, which is just above the previous record of 25.23 feet set in 1991. Upstream of Lobelville near Flat Woods, TN the Buffalo River crested at 32.69 feet which is a half of a foot higher than the 1991 crest. Records for the gauge at Flat Woods date back to 1921.
Changes and Improvements Since the Flood
Many folks faced conditions they had never before seen – from the people directly impacted by the flooding to those who forecast and manage the effects of Mother Nature. After the flood, the Metropolitan Government of Nashville and Davidson County led an effort to bring federal and state agencies together along with private companies to come up with ways to help the city respond to flooding in the future. One of the city’s first accomplishments was working with the United States Geological Survey (USGS) to improve the network of river gauges around the county.
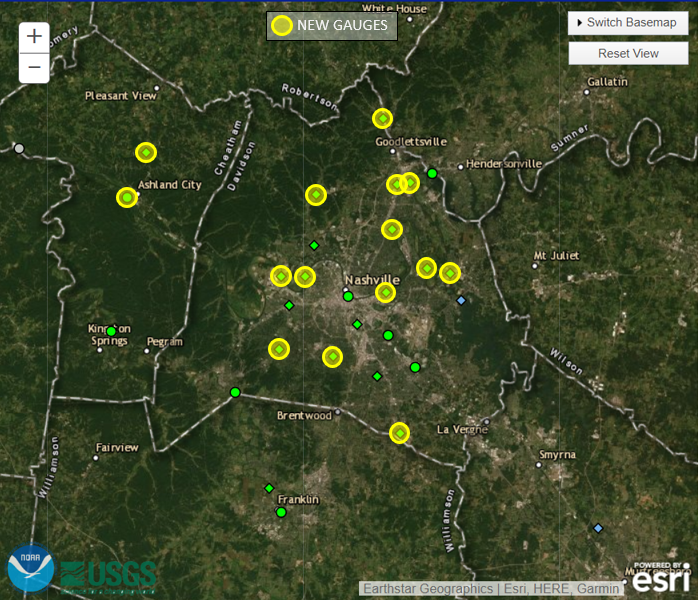
Twelve new gauges were established just within Davidson County with the focus on the Cumberland River at locations that experienced major flooding and in the headwaters of the tributaries around Nashville. The National Weather Service has set minor, moderate, and major flood stages for each of these gauges along with specific impacts of what gets flooded and at what level.
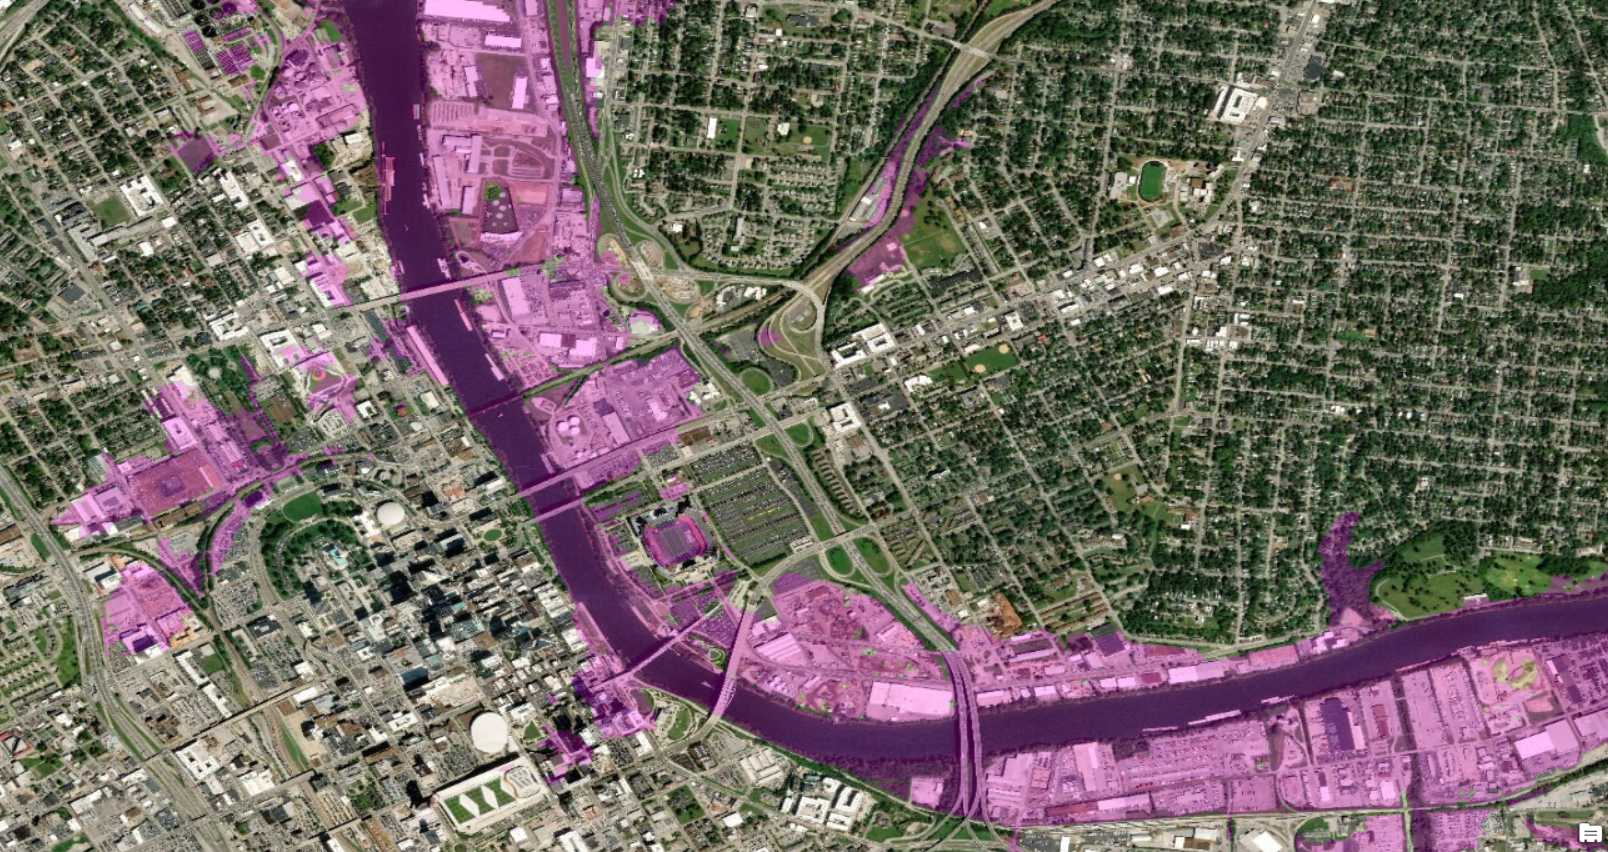
The process of setting flood stages for a new gauge involves extensive survey work and research, and ultimately only provides a fraction of the impacts in the area. The United States Army Corps of Engineers has been modelling rivers for many years and used the data from the flood to update their model of the Cumberland River. They incorporated high-resolution terrain data provided by Metro Nashville which allowed them to take the flow of the river and plot an elevation to show what is impacted. These flood inundation maps show in detail when certain roads, homes, and other structures are flooded. All of this information was documented in a database we use for our Flood Warnings and Flood Advisories.
Here is what the peak water level on May 3rd, 2010 looked like along the Cumberland River in downtown Nashville as provided by the U.S. Army Corps of Engineers -
Improved Computer Modelling
In 2010, the computer modeling of the weather was skilled but like any form of technology there were limitations when it came to forecasting extreme rainfall. These limitations came in the form of model resolution, both spatial (area) and temporal (time). Spatial resolution is the areal size of the model and the spacing between forecast points, essentially a grid. Since 2010 advances in satellite technology give models a better depiction of moisture that originates in tropical regions, which is a big factor in extreme rainfall events. Temporal resolution is the time increment of the model, and in 2010 forecasted time steps every 3 or 6 hours were common. Computing power has improved so much that now we can have a global-scale model that picks up on tropical moisture, and smaller, high-resolution models that forecast every 15 minutes to 1 hour.

This is the Geophysical Fluid Dynamics Laboratory (GFDL) Finite-Volume Cubed-Sphere Dynamical Core (FV3) model that we currently use. The computing power needed to run a model like this is on the order of several petaflops. Your smartphone or tablet probably has a few hundred gigaflops of processing power. One thousand gigaflops equals a teraflop, and 1000 teraflops equals a petaflop. It would take a few million smartphones to run a model of this size.
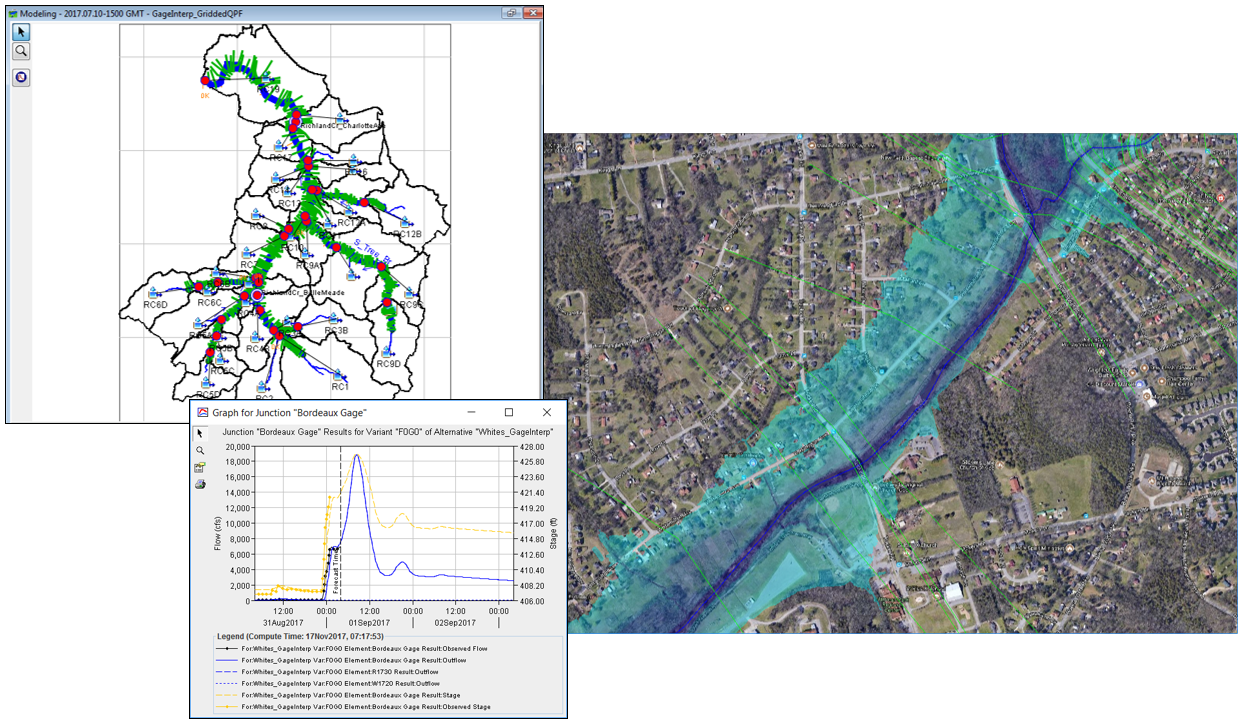
These advances are not just limited to weather models. River level models built by the U.S. Army Corps of Engineers are used to develop real-time maps of potential flooding and allow Nashville to better respond where resources are needed. These models were developed for the smaller, quicker responding basins around the city of Nashville including Richland Creek, Whites Creek, Browns Creek, Mill Creek, and Manskers Creek. Below, the upper left image shows the Richland Creek basin which is divided into a series of smaller basins. The model takes the rainfall over the smaller basins and routes it down the mainstem portion of Richland Creek. The lower left picture is an example of a water level forecast for a location along the creek. This is the type of information the National Weather Service bases their Flood Warnings on. The image on the right is an example of the real-time flood inundation map that shows which roads, homes, and structures are potentially impacted.
How To Be Prepared For Future Flooding
If you live near a body of water, eventually it will flood. Here are some tips for staying safe -
Know types of flood risk in your area. Visit FEMA’s Flood Map Service Center for information
Have a NOAA Weather Radio and be sure your phone can receive Wireless Emergency Alerts (WEA).
Have an evacuation plan and kit that includes a route to safety, necessary items like food and medications, and a waterproof container for important documents.
Get a flood insurance policy. It typically takes up to 30 days for a policy to go into effect, and homeowner’s policies do not cover flooding. Get flood coverage under the National Flood Insurance Program (NFIP)
Never drive around barricades, or walk, swim, or drive through flood waters. Most flood related deaths occur this way. If you come across a flooded road or path, Turn Around Don’t Drown!


 Follow us on YouTube