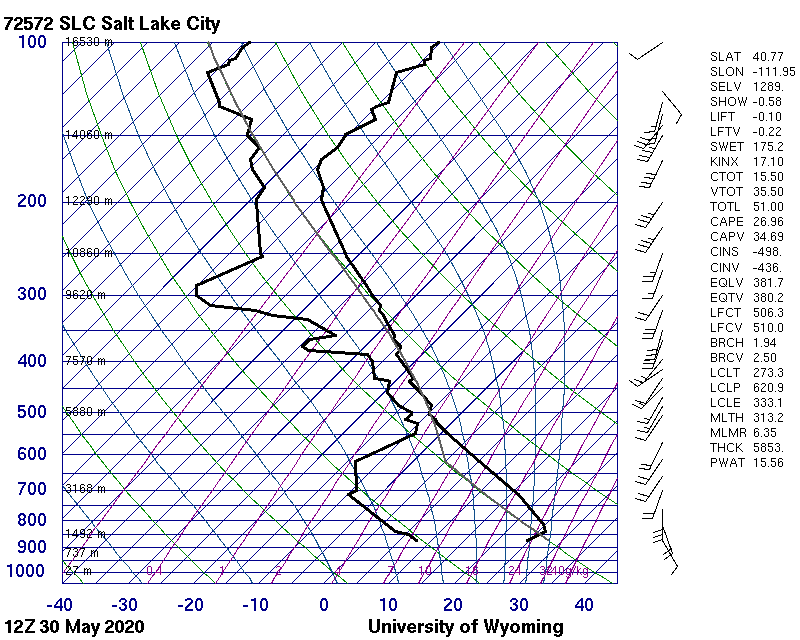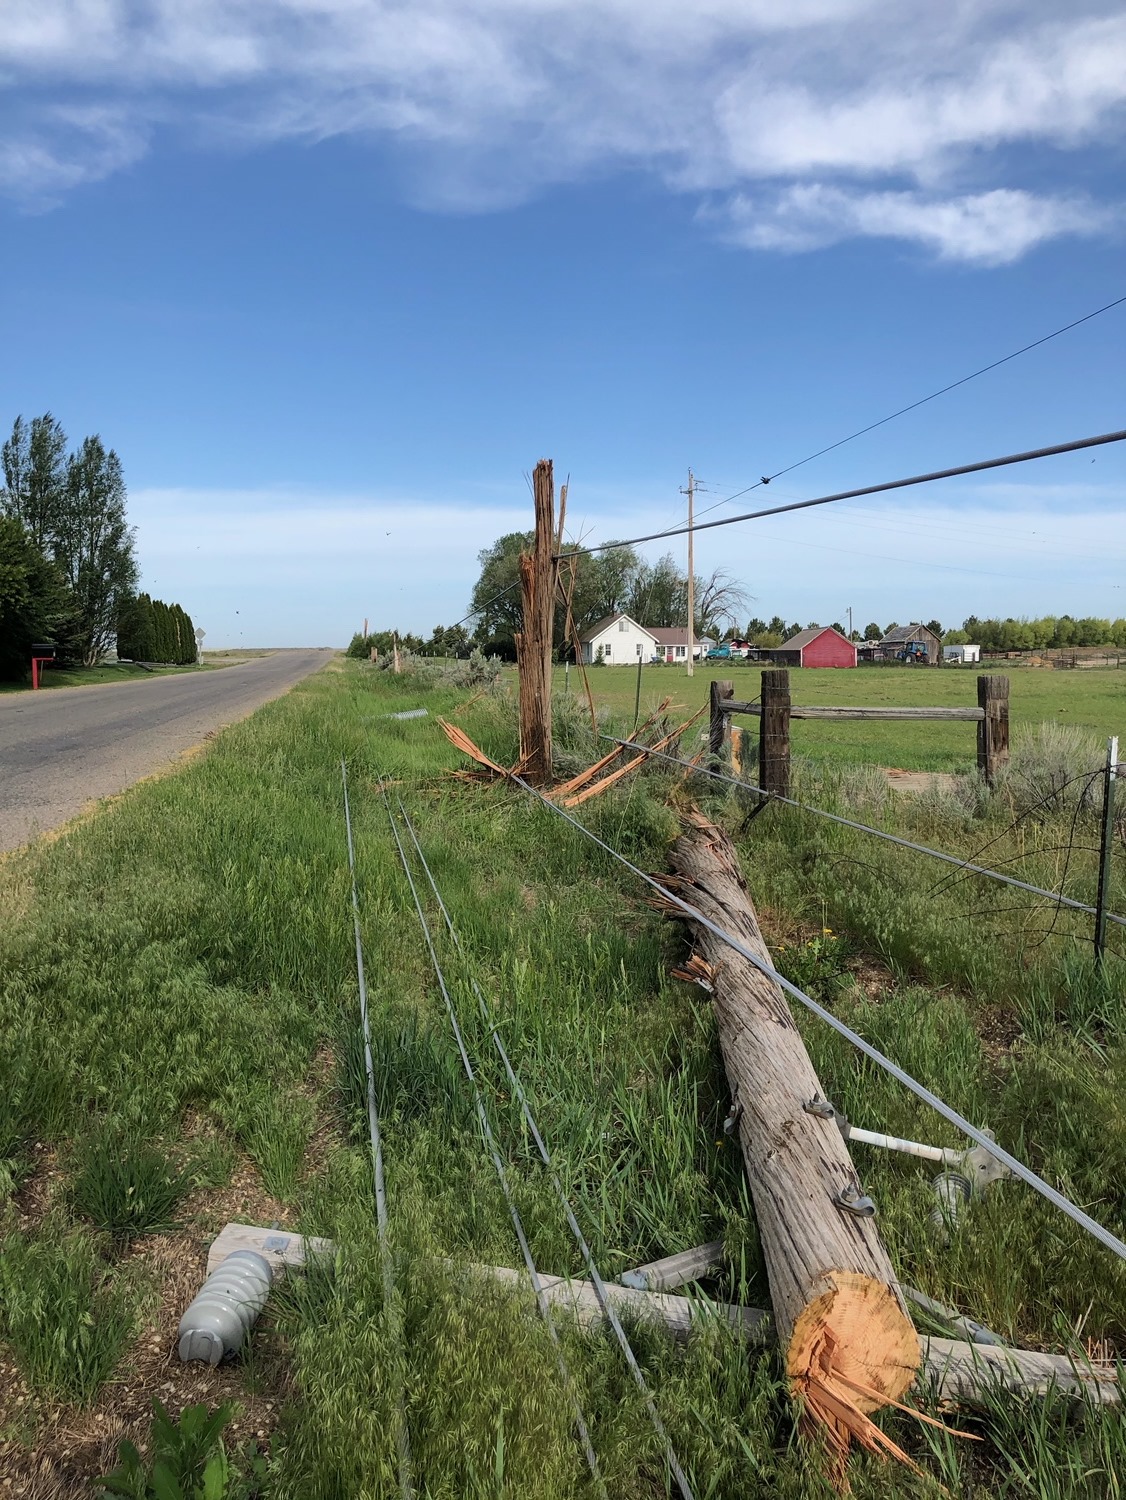
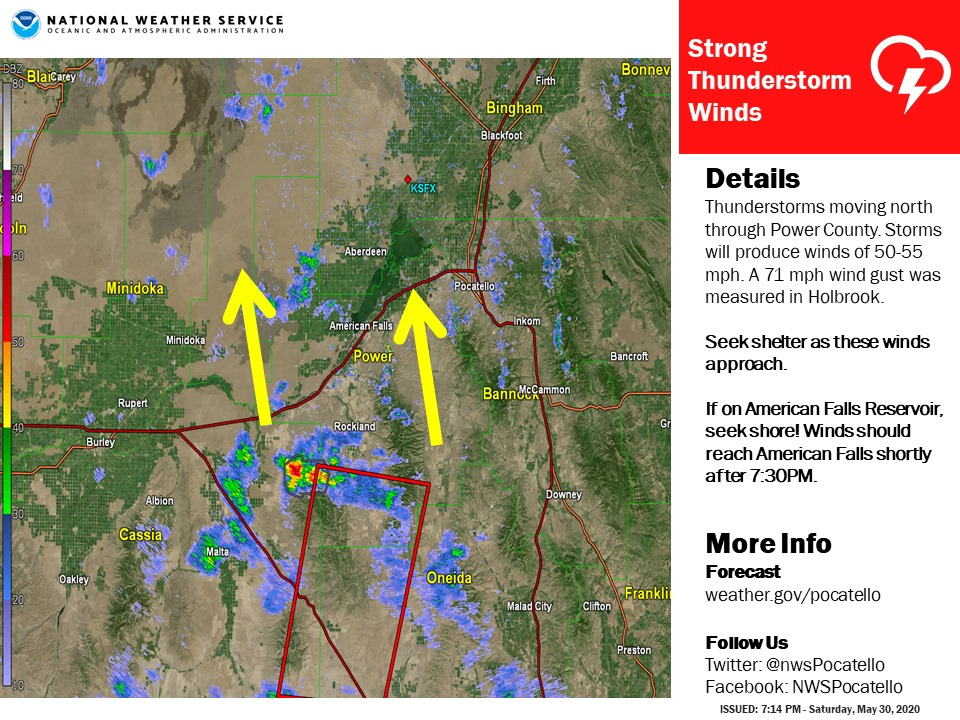
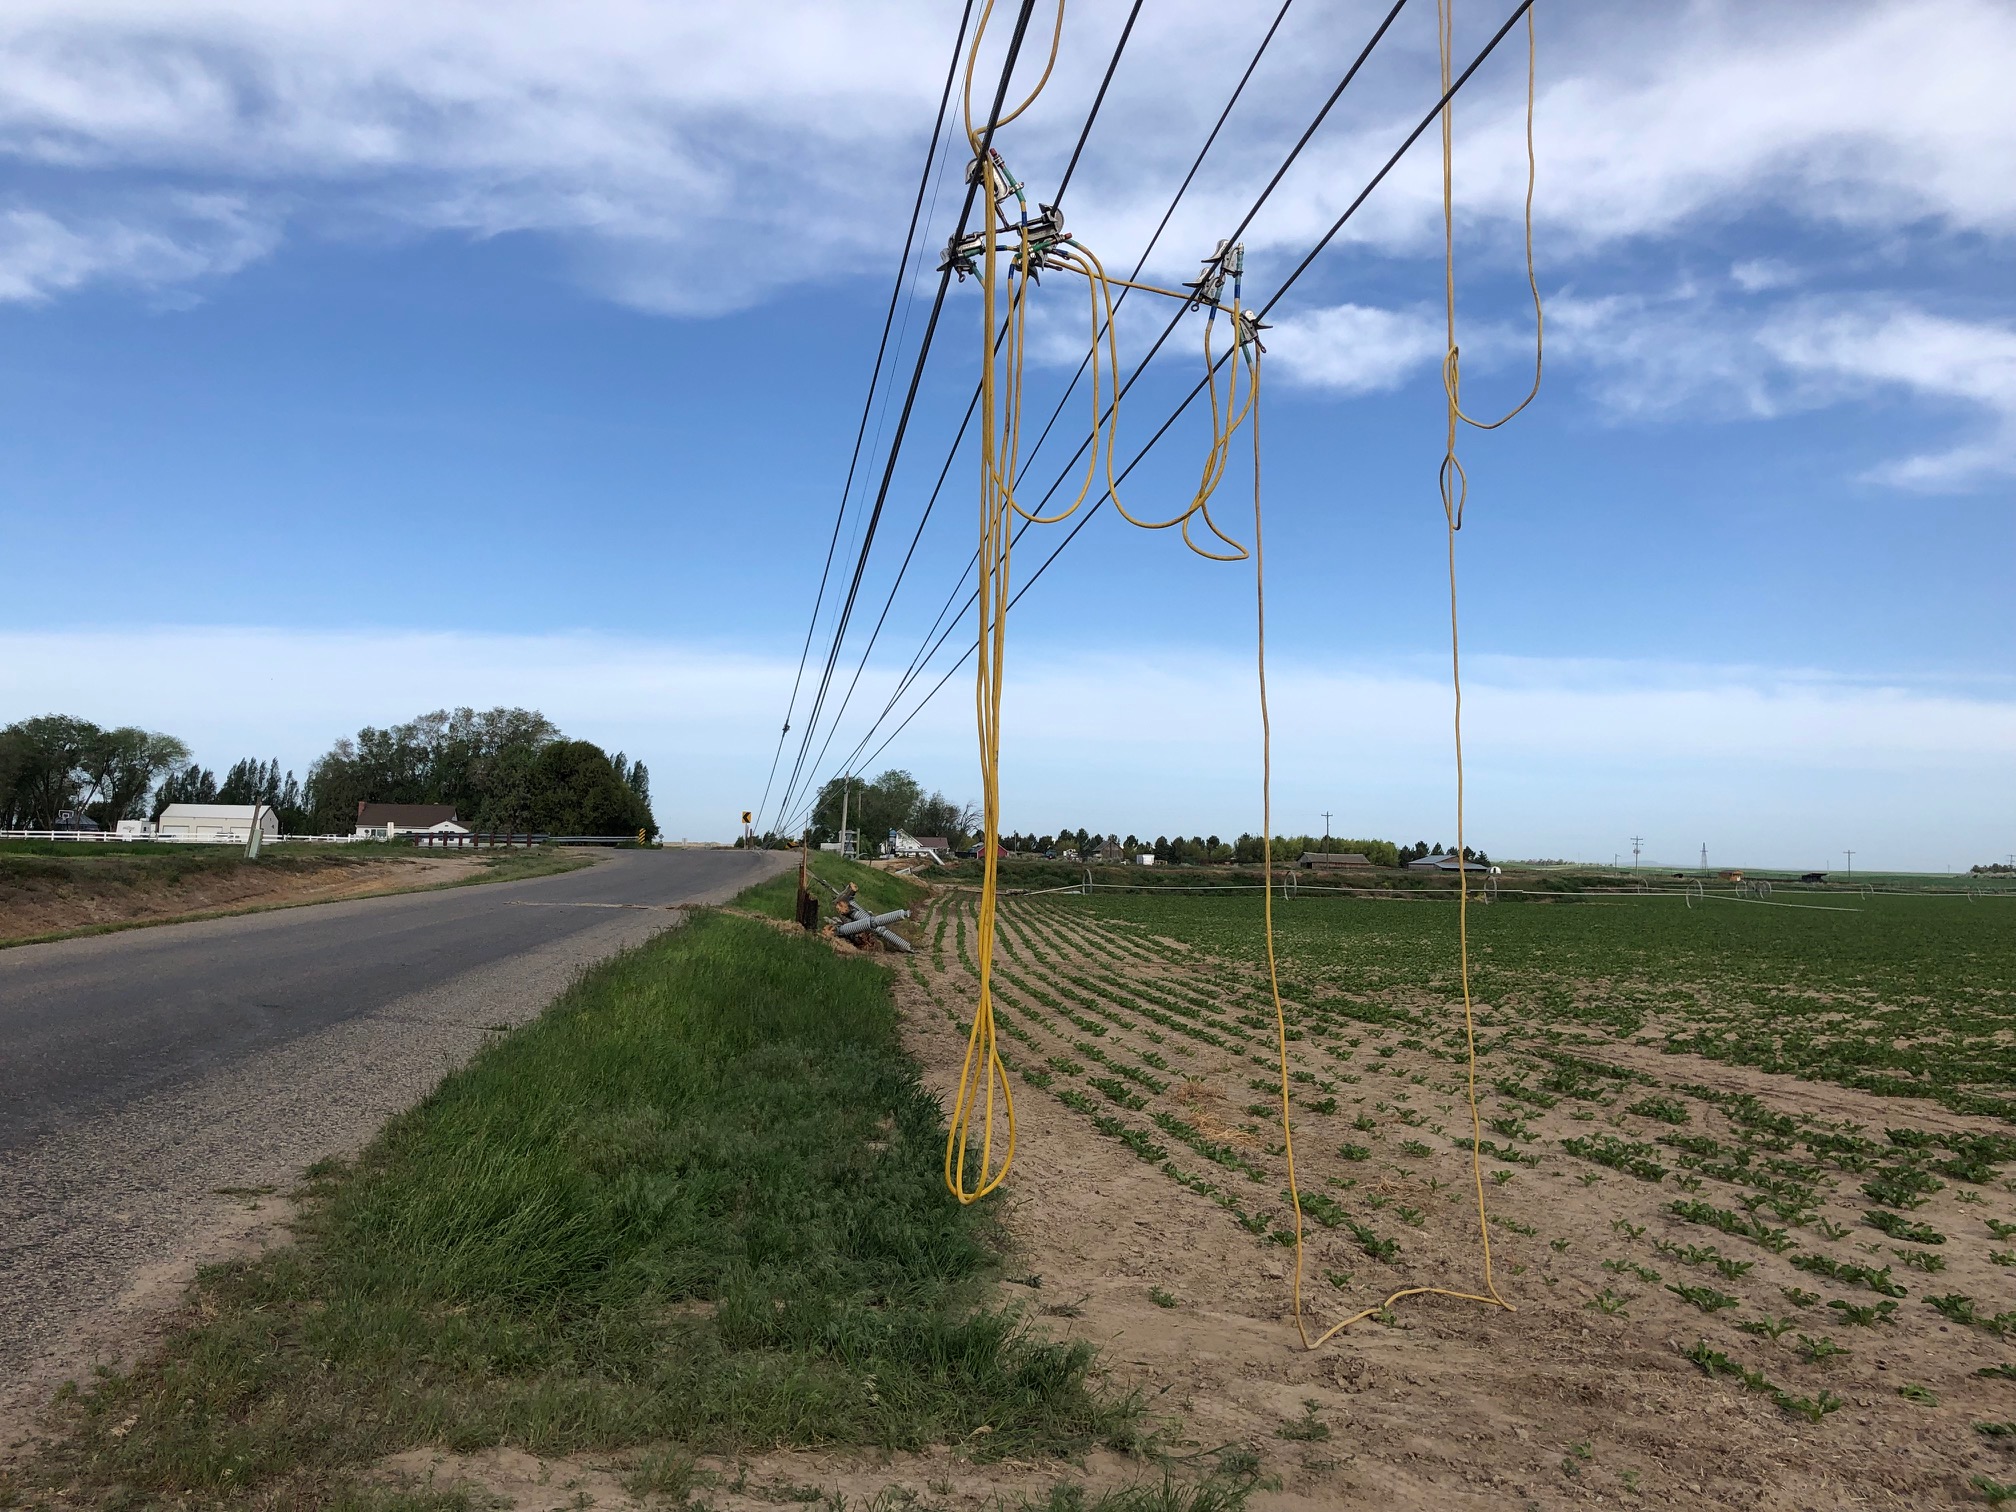
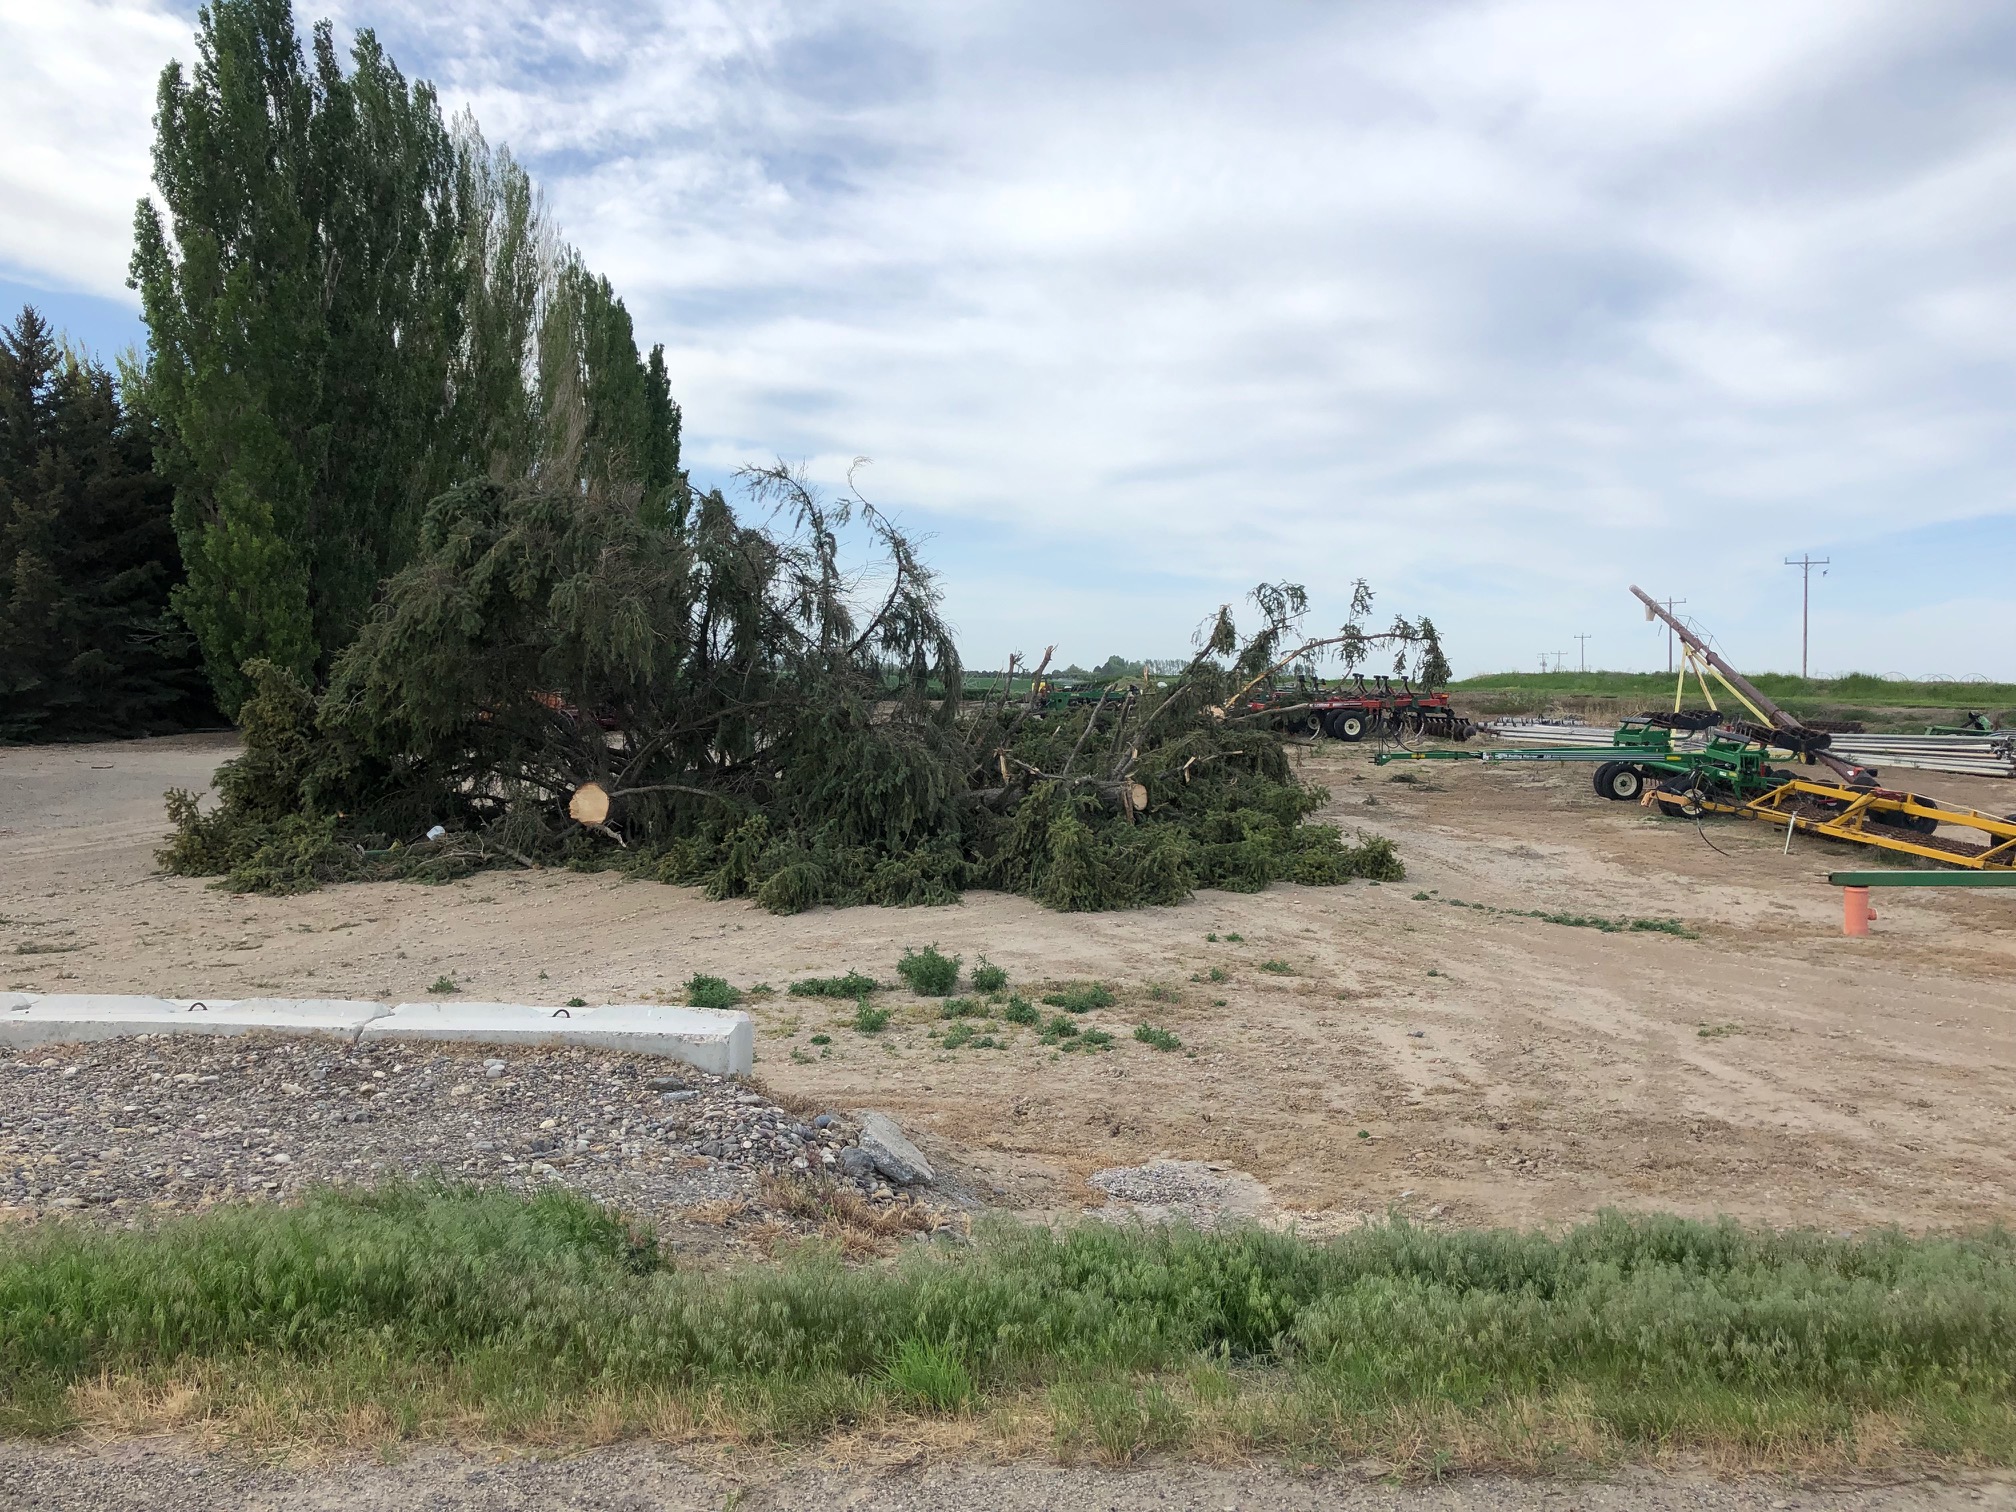
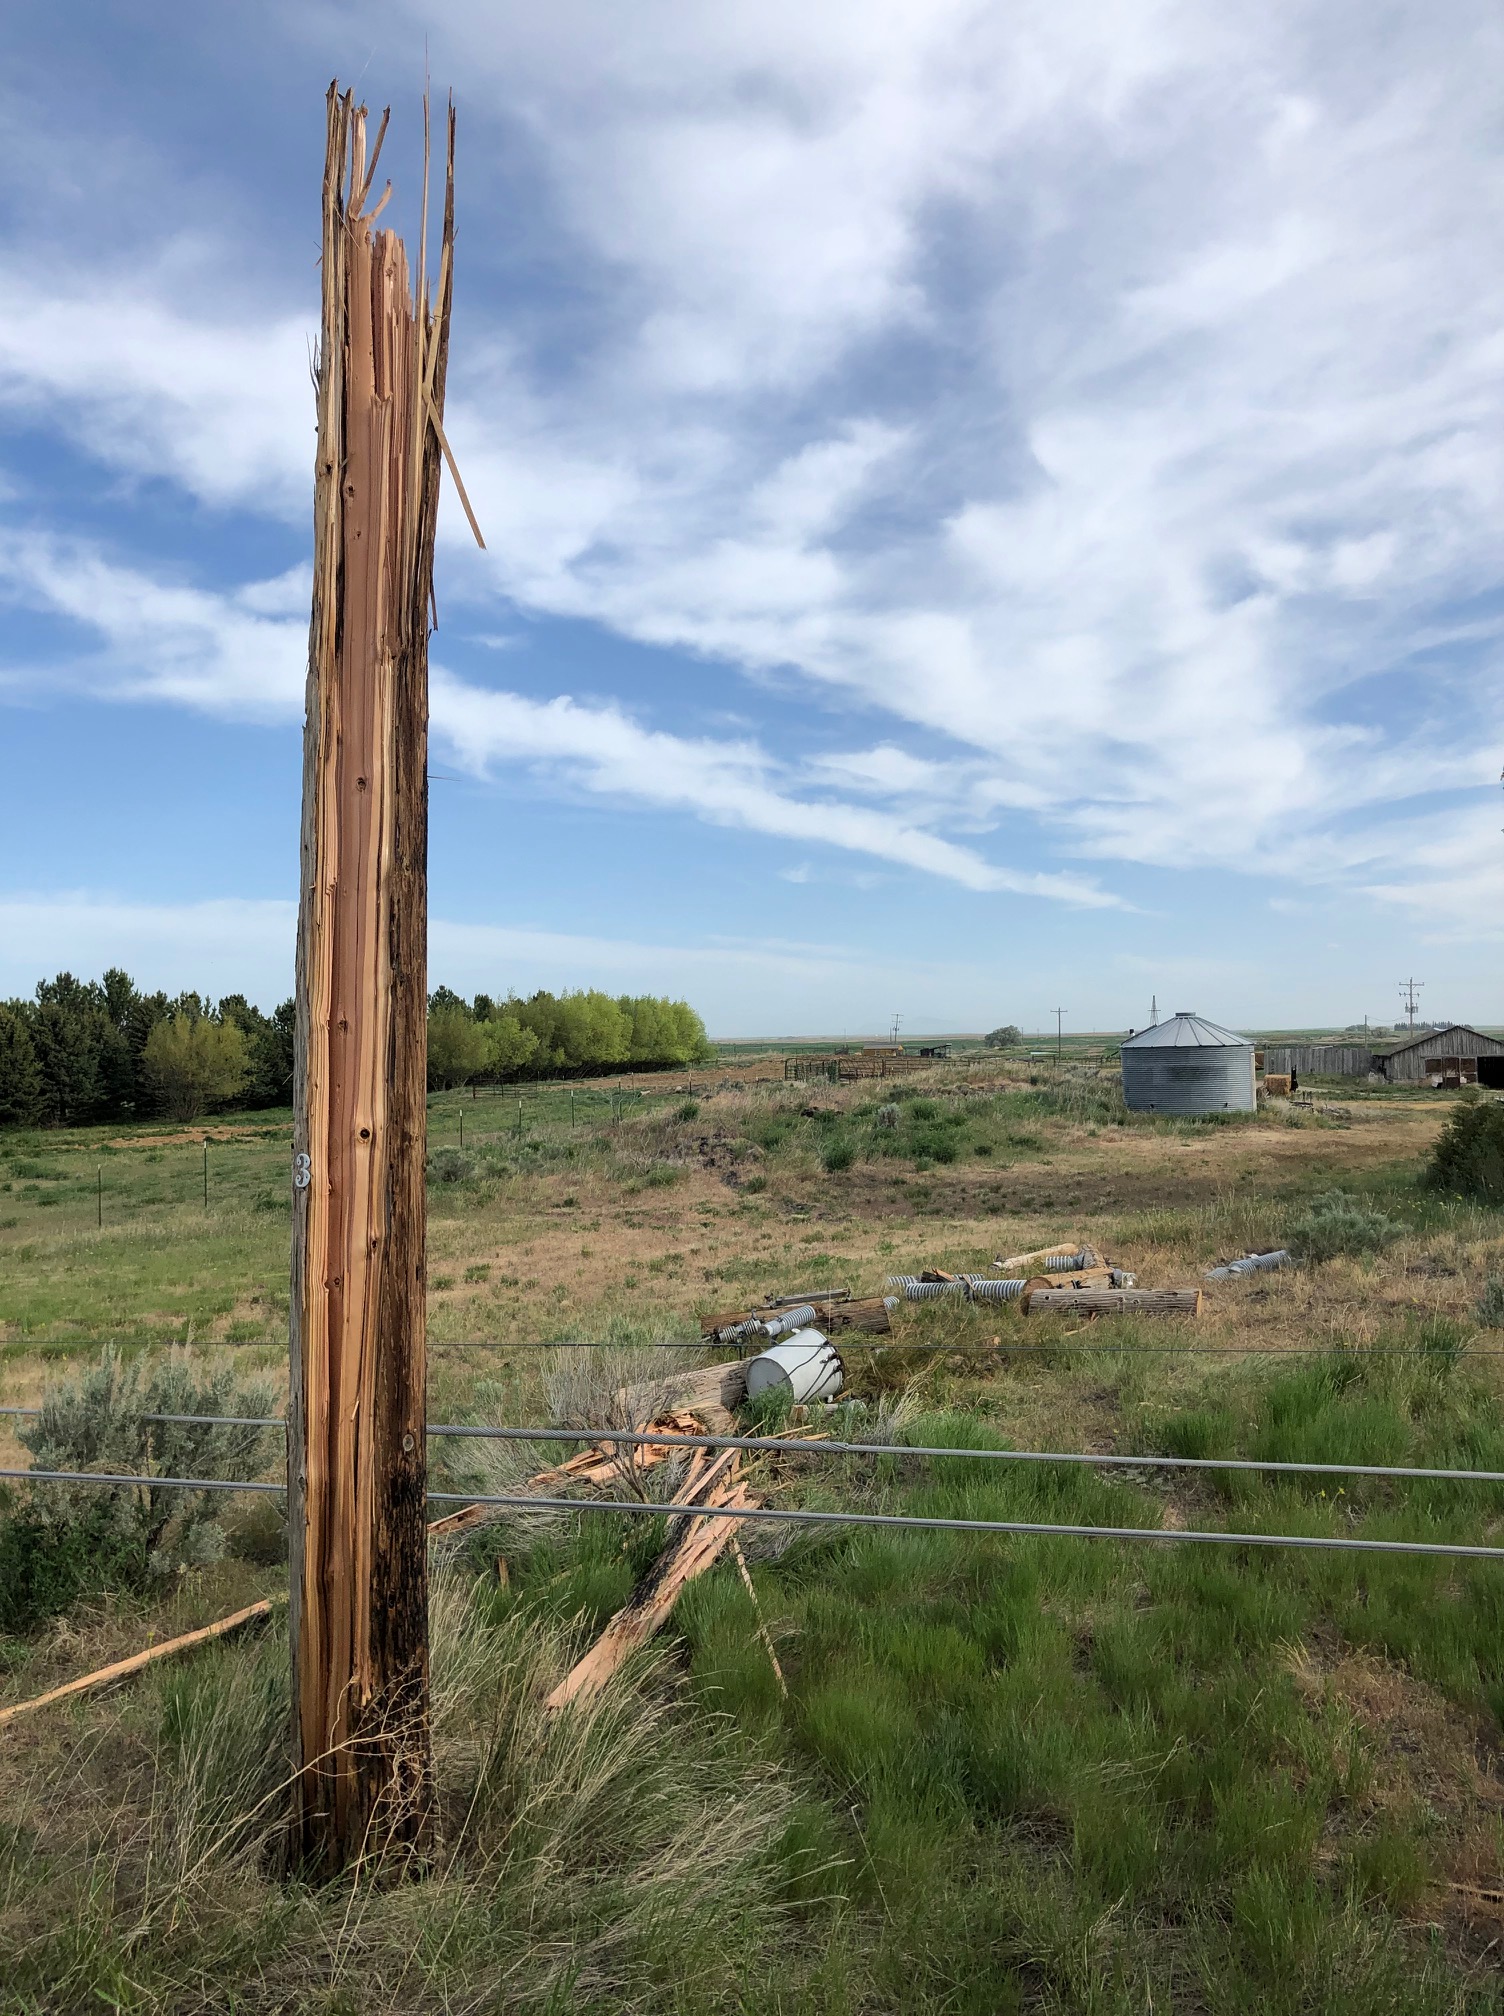
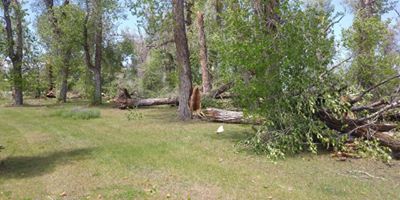

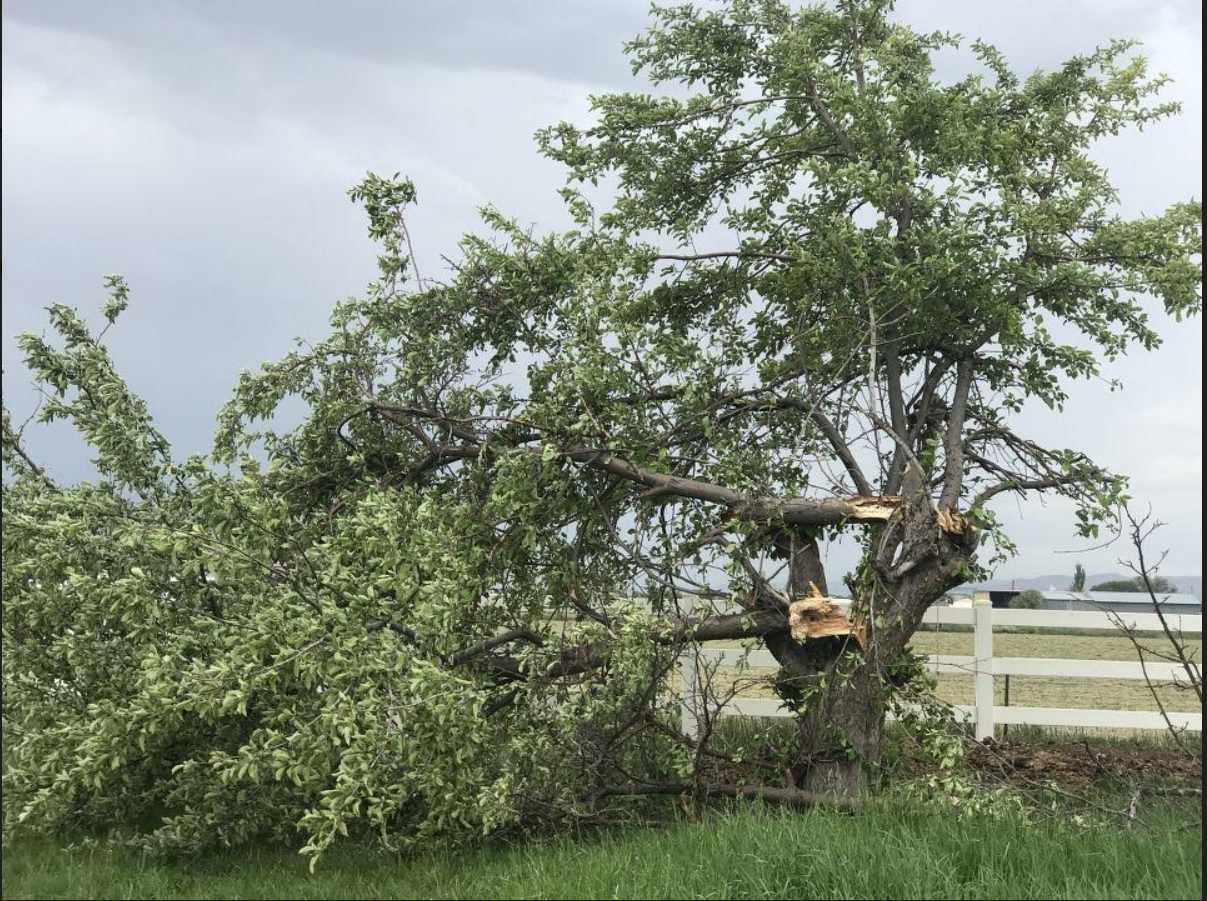
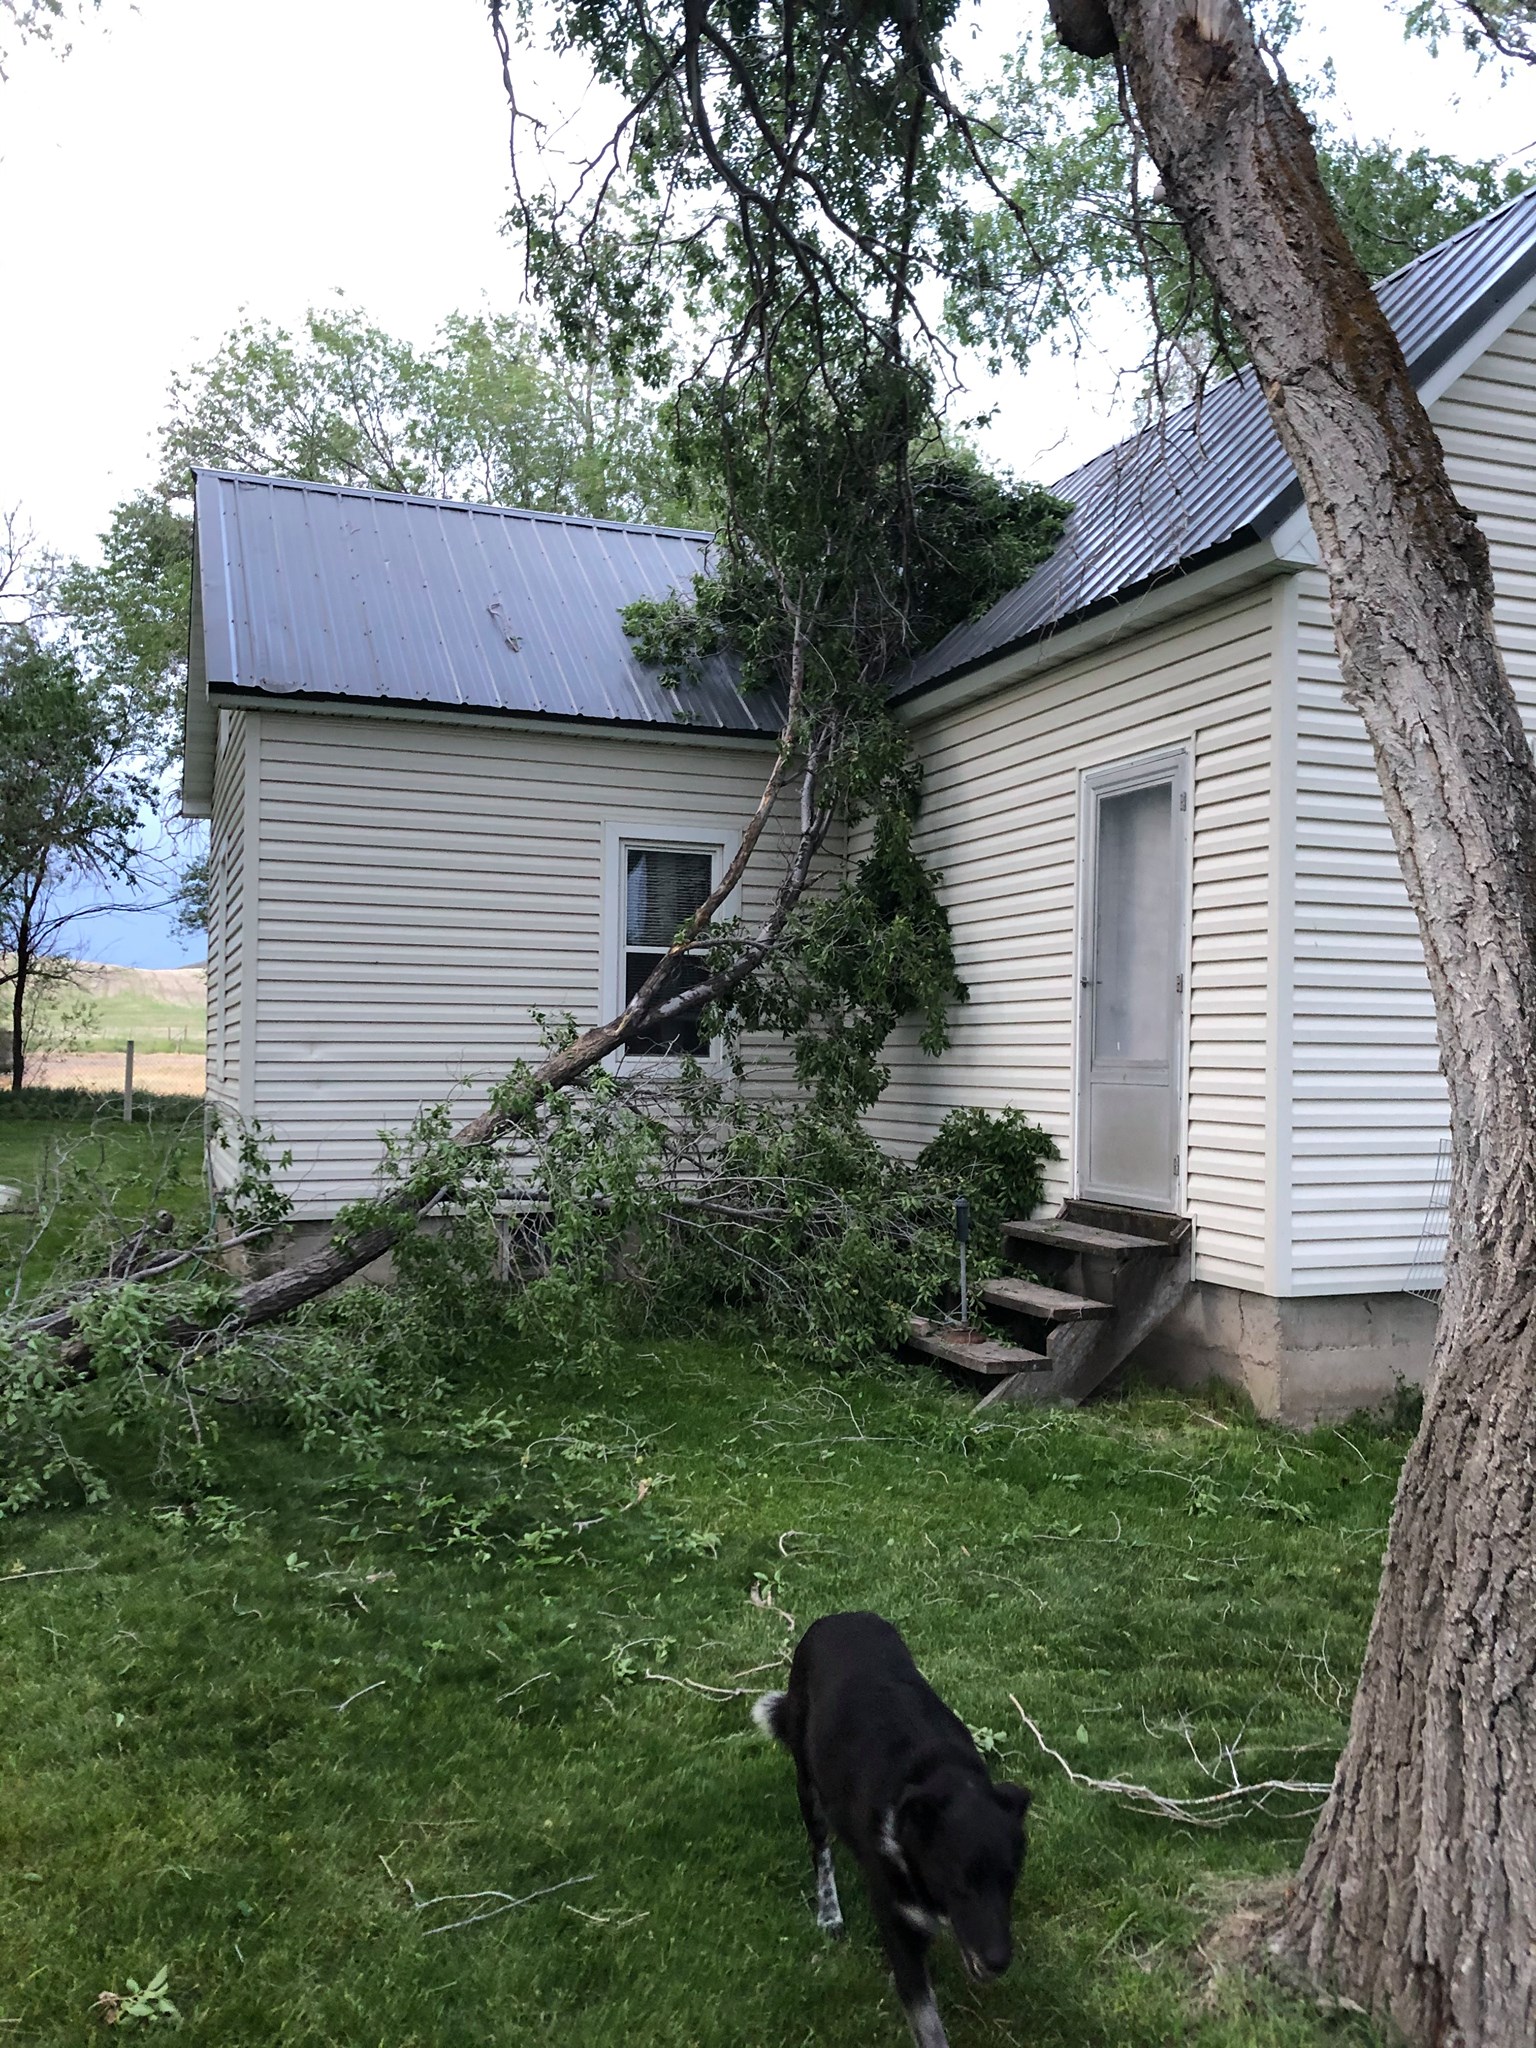
...HIGHEST THUNDERSTORM WIND GUST REPORTS MAY 30TH...
Resent to correct time at Pocatello Airport

Location                     Speed     Time/Date       Lat/Lon

...Idaho...

...Bannock County...
Fort Hall                    61 MPH    0930 PM 05/30   43.02N/112.41W

...Bear Lake County...
Grace                        45 MPH    1100 PM 05/30   42.30N/111.40W

...Bingham County...
Atomic City                  61 MPH    0805 PM 05/30   43.44N/112.81W
Aberdeen                     54 MPH    0915 PM 05/30   42.95N/112.82W
Taber                        52 MPH    0800 PM 05/30   43.32N/112.69W

...Blaine County...
6 S Sun Valley Ohio Gulch    50 MPH    0644 PM 05/30   43.60N/114.32W
        2.4 SW Ketchum (SNOWNET)     50 MPH    0400 PM 05/30   43.66N/114.40W
D4 - Smiley Creek Airport    48 MPH    0545 PM 05/30   43.91N/114.80W

...Bonneville County...
Kettle Butte                 70 MPH    0850 PM 05/30   43.55N/112.33W
Idaho Falls Airport          46 MPH    0901 PM 05/30   43.52N/112.07W

...Butte County...
Dead Man Canyon              74 MPH    0840 PM 05/30   43.62N/113.06W
Specific Manufacturing Capab 51 MPH    0845 PM 05/30   43.86N/112.73W
5 W Arco                     49 MPH    0747 PM 05/30   43.62N/113.39W
INTEC/Grid 3                 47 MPH    0740 PM 05/30   43.59N/112.94W
D6 - Puzzle                  46 MPH    0845 PM 05/30   43.51N/112.89W

...Cassia County...
Moburg Canyon                57 MPH    0639 PM 05/30   42.04N/113.15W
Cotton Ridge                 57 MPH    0509 PM 05/30   42.17N/114.20W
D4 - Yale                    54 MPH    0715 PM 05/30   42.52N/113.42W
Raft River RAWS              49 MPH    0719 PM 05/30   42.55N/113.26W
D4 - Idahome Interchange     49 MPH    0700 PM 05/30   42.41N/113.32W
10 S Oakley                  45 MPH    0545 PM 05/30   42.10N/113.90W

...Clark County...
D6 - Camas                   83 MPH    0945 PM 05/30   44.16N/112.23W
D6 - Monida                  52 MPH    1000 PM 05/30   44.53N/112.27W

...Custer County...
Challis                      61 MPH    0723 PM 05/30   44.52N/114.22W
Copper Basin                 49 MPH    0850 AM 05/31   43.81N/113.85W
Stanley Airport              48 MPH    0643 PM 05/30   44.17N/114.93W
D6 - Willow Creek Summit     46 MPH    0115 AM 05/31   44.23N/113.98W

...Franklin County...
1.2 NW Preston (UTAH CLIMA)  46 MPH    0415 PM 05/30   42.11N/111.89W

...Jefferson County...
Rover                        71 MPH    0840 PM 05/30   43.72N/112.53W
Hamer                        64 MPH    0940 PM 05/30   44.01N/112.24W
Terreton                     64 MPH    0900 PM 05/30   43.84N/112.42W
Roberts                      58 MPH    0915 PM 05/30   43.74N/112.13W
D6 - Osgood                  49 MPH    0914 PM 05/30   43.65N/112.10W

...Minidoka County...
2.9 W Paul (AGRIMET)         50 MPH    0600 PM 05/30   42.59N/113.84W
Burley Airport               49 MPH    0809 PM 05/30   42.55N/113.77W
Minidoka                     49 MPH    0610 PM 05/30   42.80N/113.59W

...Oneida County...
4 N Holbrook                 71 MPH    0701 PM 05/30   42.22N/112.66W
D4 - Juniper Interchange     57 MPH    0645 PM 05/30   42.14N/112.98W

...Power County...
6 NE AMERICAN FALLS          55 MPH    0730 PM 05/30   42.85N/112.77W
American Falls               49 MPH    0735 PM 05/30   42.77N/112.85W
Pocatello Airport            46 MPH    0913 PM 05/30   42.92N/112.57W

...Teton County...
D6 - Pine Creek Pass         60 MPH    0445 AM 05/31   43.57N/111.22W

Observations are collected from a variety of sources with varying
equipment and exposures. We thank all volunteer weather observers
for their dedication. Not all data listed are considered official.
.png) |