Overview
|
On April 28, 2026, numerous supercells formed across southeast Kansas, northeast Oklahoma, northwest Arkansas, and southwest Missouri, bringing very large hail to the area. The most prolific hail-producing storm was a left-moving supercell that split as it moved into Barry County in Missouri, tracking north-northeast through Lawrence, Christian, Greene, Dallas, Webster, Laclede, and Camden County and producing severe hail for two hours and twenty minutes. This storm reached peak intensity as it reached Aurora and tracked across northwest Springfield, bringing a large swath of significant severe hail the size of baseballs (2.75 inches) to as large as 4.75 inches (slightly larger than a grapefruit, or around the size of a CD) across the Springfield metropolitan area. Hail was retrieved and measured at 4 inches in diameter at the NWS Springfield office, even after 30 minutes of melting. Widespread damage across the path of this storm was reported to vehicles, homes, businesses, vegetation, and utility infrastructure, including significant damage around the Springfield-Branson National Airport. An emu at Dickerson Park Zoo was killed by the hail, with another animal left in veterinary care, and numerous people were treated in area hospitals for injuries sustained from the hail. |
Hail
By far the biggest impact from storms was the giant hail that fell across over a 100-mile swath of southern Missouri, primarily from one particular storm that tracked from Barry County to Camden County. Hail the size of baseballs and larger fell impacted Springfield directly, with copious amounts of this giant hail falling for 2-3 straight minutes. The largest hail found was measured at 4.75 inches, which is larger than a grapefruit and the size of a CD!
Greene County law enforcement responded to 29 crashes during the timeframe of the storm. Dozens of area businesses were impacted, and thousands of vehicles and homes sustained damage across Springfield. Damage ranged from dents on vehicles to completely obliterated windshields, with additional damage to newly-open vehicles when heavy rainfall infiltrated the vehicles. Home damage included damage to roofing, vinyl siding, gutters, and windows. Utility poles and gas meters were also damaged, with 10,000 customers powerless immediately following the storm.
Hail
 |
 |
 |
.png) |
|
Baseball (2.75 inch) to apple (3 inch) sized hail in Purdy, MO. Photo credit: Reese Veith, Purdy Fire Captain |
Apple-sized (3.25 inch diameter) hail in Republic, MO. Photo credit: Jason Schaumann |
Baseball (2.75 inch) to softball (4 inch) sized hail at NWS Springfield in northwest Springfield. This hail was retrieved and measured 30 minutes after it fell, so it was even larger before the 30 minutes of melting! |
Hail retrieved in Springfield
Source: Jonathan Jones |
Photos & Video
 |
 |
.png) |
|
Photo of incoming storm in Republic, MO
|
Hail in Aurora, MO
|
Windshield shattered by hail in Springfield near Kearney and West Bypass
|
Radar
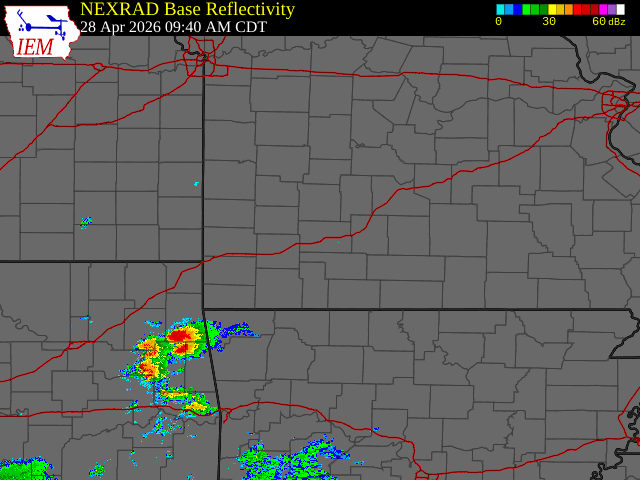
Storm Reports
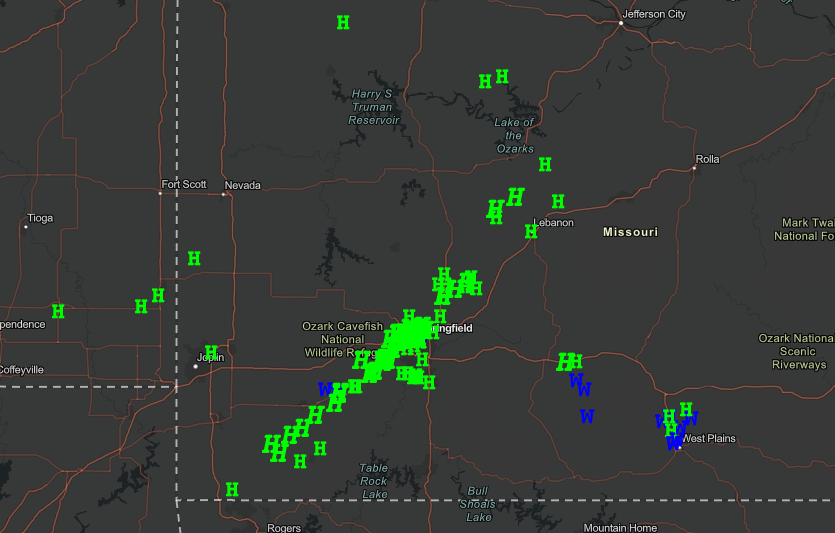
...HAIL REPORTS...

Location                     Size      Time/Date       Lat/Lon
5 SE Bois dArc               4.75 in   1143 AM 04/28   37.21N/93.44W
1 NNW Aurora                 4.00 in   1124 AM 04/28   36.98N/93.72W
5 SSE Willard                4.00 in   1145 AM 04/28   37.24N/93.40W
4 SSE Glidewell              4.00 in   1150 AM 04/28   37.25N/93.31W
4 SSE Glidewell              3.50 in   1150 AM 04/28   37.25N/93.31W
1 NE Republic                3.25 in   1140 AM 04/28   37.13N/93.47W
1 W Republic                 3.25 in   1206 PM 04/28   37.12N/93.49W
4 N Bennett Springs          3.00 in   1236 PM 04/28   37.78N/92.86W
4 NW Billings                3.00 in   1144 AM 04/28   37.12N/93.60W
5 SSW Glidewell              3.00 in   1145 AM 04/28   37.24N/93.37W
3 WSW Pleasant Ridge         3.00 in   1111 AM 04/28   36.88N/93.85W
Aurora                       2.75 in   1122 AM 04/28   36.97N/93.72W
3 SSW Aurora                 2.75 in   1124 AM 04/28   36.93N/93.74W
4 NE Republic                2.75 in   1145 AM 04/28   37.17N/93.42W
1 NNE Springfield            2.75 in   1149 AM 04/28   37.22N/93.28W
5 SSW Glidewell              2.75 in   1151 AM 04/28   37.24N/93.37W
4 NNE Springfield            2.75 in   1154 AM 04/28   37.25N/93.25W
Billings                     2.75 in   1135 AM 04/28   37.06N/93.55W
4 SSW Glidewell              2.50 in   1140 AM 04/28   37.26N/93.34W
4 WNW Springfield            2.50 in   1145 AM 04/28   37.21N/93.35W
4 N Springfield              2.50 in   1145 AM 04/28   37.25N/93.29W
6 NNW Battlefield            2.50 in   1146 AM 04/28   37.20N/93.39W
3 WNW Springfield            2.50 in   1149 AM 04/28   37.21N/93.34W
2 WNW Springfield            2.50 in   1200 PM 04/28   37.22N/93.32W
4 SE Glidewell               2.50 in   1218 PM 04/28   37.27N/93.27W
4 ENE Wheaton                2.50 in   1058 AM 04/28   36.79N/93.99W
1 NE Republic                2.25 in   1143 AM 04/28   37.13N/93.46W
3 WNW Springfield            2.25 in   1147 AM 04/28   37.21N/93.34W
4 W Norwood                  2.00 in   1228 PM 04/28   37.11N/92.48W
2 NNE Elkland                2.00 in   1211 PM 04/28   37.46N/93.02W
Rocky Comfort                2.00 in   1052 AM 04/28   36.75N/94.09W
Eldridge                     2.00 in   1238 PM 04/28   37.83N/92.75W
1 SE Republic                2.00 in   1138 AM 04/28   37.11N/93.47W
2 N Springfield              2.00 in   1149 AM 04/28   37.22N/93.29W
2 E Republic                 2.00 in   1200 PM 04/28   37.12N/93.45W
1 N Fair Grove               2.00 in   1204 PM 04/28   37.40N/93.15W
3 SE Glidewell               2.00 in   1210 PM 04/28   37.26N/93.29W
4 NNE Springfield            2.00 in   1237 PM 04/28   37.25N/93.27W
3 WSW Elkland                2.00 in   1210 PM 04/28   37.43N/93.08W
2 E Billings                 2.00 in   1135 AM 04/28   37.07N/93.52W
2 WNW Ridgley                2.00 in   1052 AM 04/28   36.71N/94.05W
Purdy                        2.00 in   1107 AM 04/28   36.82N/93.92W
Norwood                      1.75 in   1233 PM 04/28   37.11N/92.42W
Marionville                  1.75 in   1128 AM 04/28   37.00N/93.64W
Pomona                       1.75 in   0334 PM 04/28   36.87N/91.91W
4 SSE Pomona                 1.75 in   0337 PM 04/28   36.81N/91.90W
4 NNE Battlefield            1.75 in   1145 AM 04/28   37.17N/93.35W
4 SSE Willard                1.75 in   1149 AM 04/28   37.24N/93.41W
Springfield                  1.75 in   1151 AM 04/28   37.20N/93.28W
4 W Springfield              1.75 in   1154 AM 04/28   37.20N/93.36W
1 NW Glidewell               1.75 in   1155 AM 04/28   37.31N/93.34W
5 NE Springfield             1.75 in   1201 PM 04/28   37.24N/93.21W
Fair Grove                   1.75 in   1204 PM 04/28   37.39N/93.15W
2 WSW Olive                  1.75 in   1209 PM 04/28   37.45N/93.14W
Billings                     1.75 in   1135 AM 04/28   37.07N/93.55W
3 WNW Nixa                   1.75 in   1140 AM 04/28   37.06N/93.35W
2 SE Wagoner                 1.75 in   1229 PM 04/28   37.65N/93.90W
Montreal                     1.75 in   1252 PM 04/28   37.97N/92.59W
Liberal                      1.75 in   0137 PM 04/28   37.56N/94.52W
2 SSE Charity                1.50 in   1215 PM 04/28   37.48N/93.00W
3 N Gravois Mills            1.50 in   0229 PM 04/28   38.35N/92.83W
Lebanon                      1.50 in   1235 PM 04/28   37.68N/92.67W
3 SW Bassville               1.50 in   1200 PM 04/28   37.31N/93.17W
1 NNW Bennett Springs        1.50 in   1230 PM 04/28   37.74N/92.86W
5 WNW Gravois Mills          1.25 in   0205 PM 04/28   38.33N/92.92W
3 NW Olive                   1.25 in   1210 PM 04/28   37.49N/93.15W
3 E Elkland                  1.00 in   1210 PM 04/28   37.43N/92.97W
Elkland                      1.00 in   1211 PM 04/28   37.44N/93.03W
4 WSW Olive                  1.00 in   1209 PM 04/28   37.45N/93.18W
5 SE Pineville               1.00 in   1032 AM 04/28   36.55N/94.31W
Marionville                  1.00 in   0129 PM 04/28   37.00N/93.63W
1 ESE Carterville            1.00 in   0105 PM 04/28   37.15N/94.43W
4 NNW White Church           1.00 in   0339 PM 04/28   36.90N/91.82W
Springfield                  1.00 in   1147 AM 04/28   37.20N/93.28W
Springfield                  1.00 in   1158 AM 04/28   37.20N/93.28W
1 SW Springfield             1.00 in   0117 PM 04/28   37.18N/93.31W
1 ESE Republic               1.00 in   0129 PM 04/28   37.11N/93.46W
2 SW Galloway                1.00 in   0154 PM 04/28   37.12N/93.27W
2 W Nixa                     1.00 in   0146 PM 04/28   37.04N/93.32W
3 NNE Boaz                   1.00 in   0147 PM 04/28   37.06N/93.38W
1 NW Nixa                    1.00 in   0147 PM 04/28   37.05N/93.30W
Nixa                         1.00 in   0148 PM 04/28   37.04N/93.29W
1 W Ozark                    1.00 in   0155 PM 04/28   37.02N/93.23W
Stoutland                    1.00 in   1245 PM 04/28   37.81N/92.52W
Exeter                       1.00 in   1052 AM 04/28   36.67N/93.94W
4 NNE Cassville              1.00 in   1103 AM 04/28   36.73N/93.83W
1 SSW Pittsburg              1.00 in   1151 AM 04/28   37.40N/94.72W
Cherokee                     1.00 in   0115 PM 04/28   37.35N/94.81W
Environment
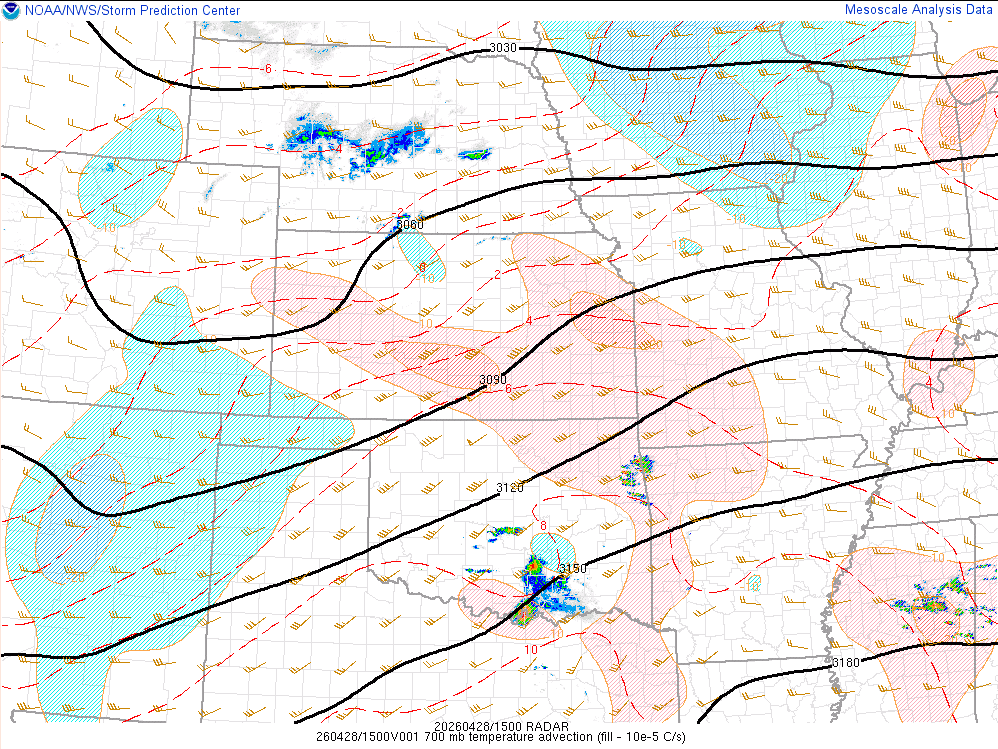
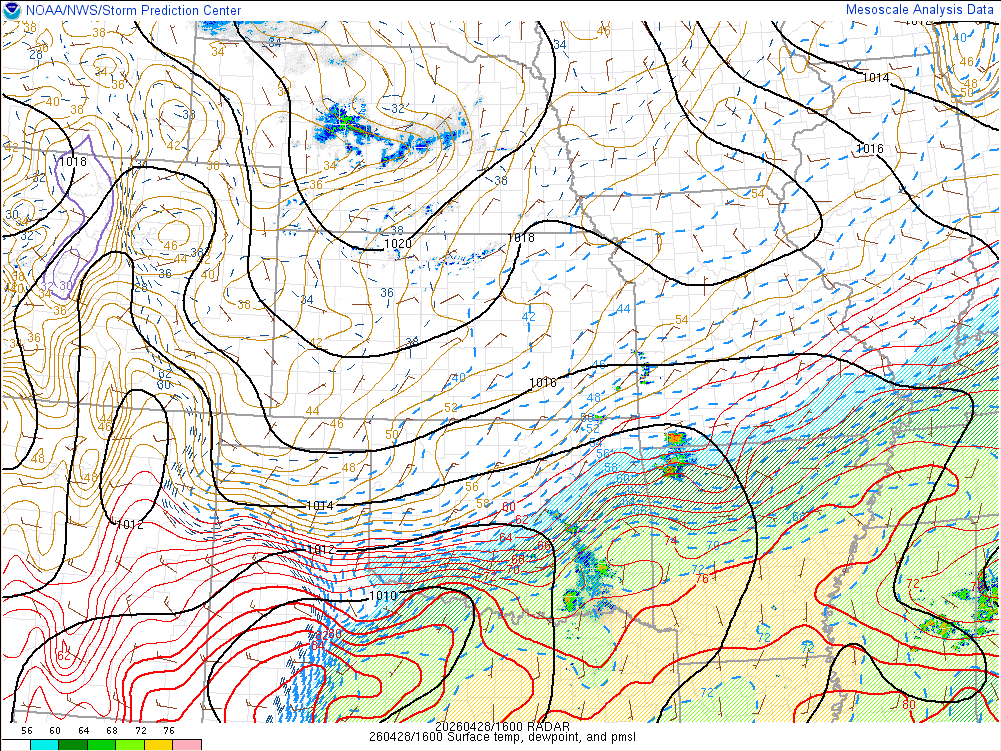
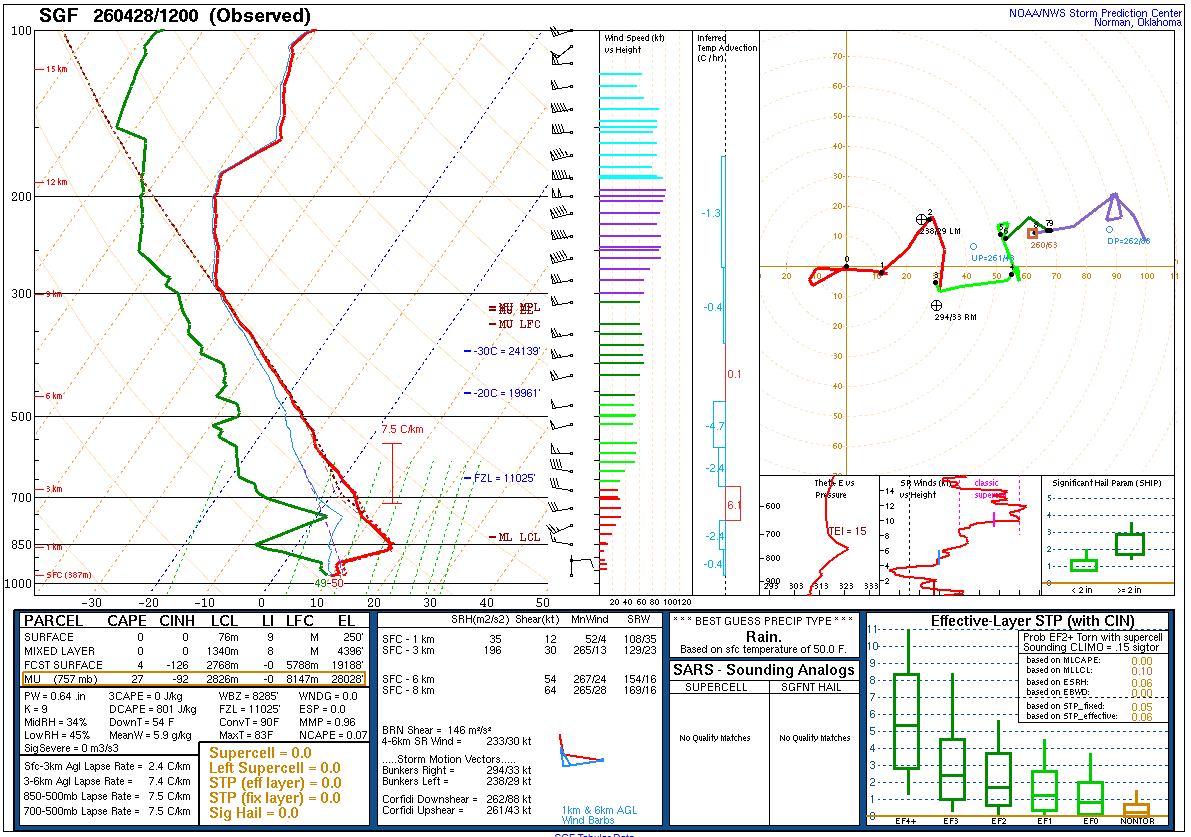
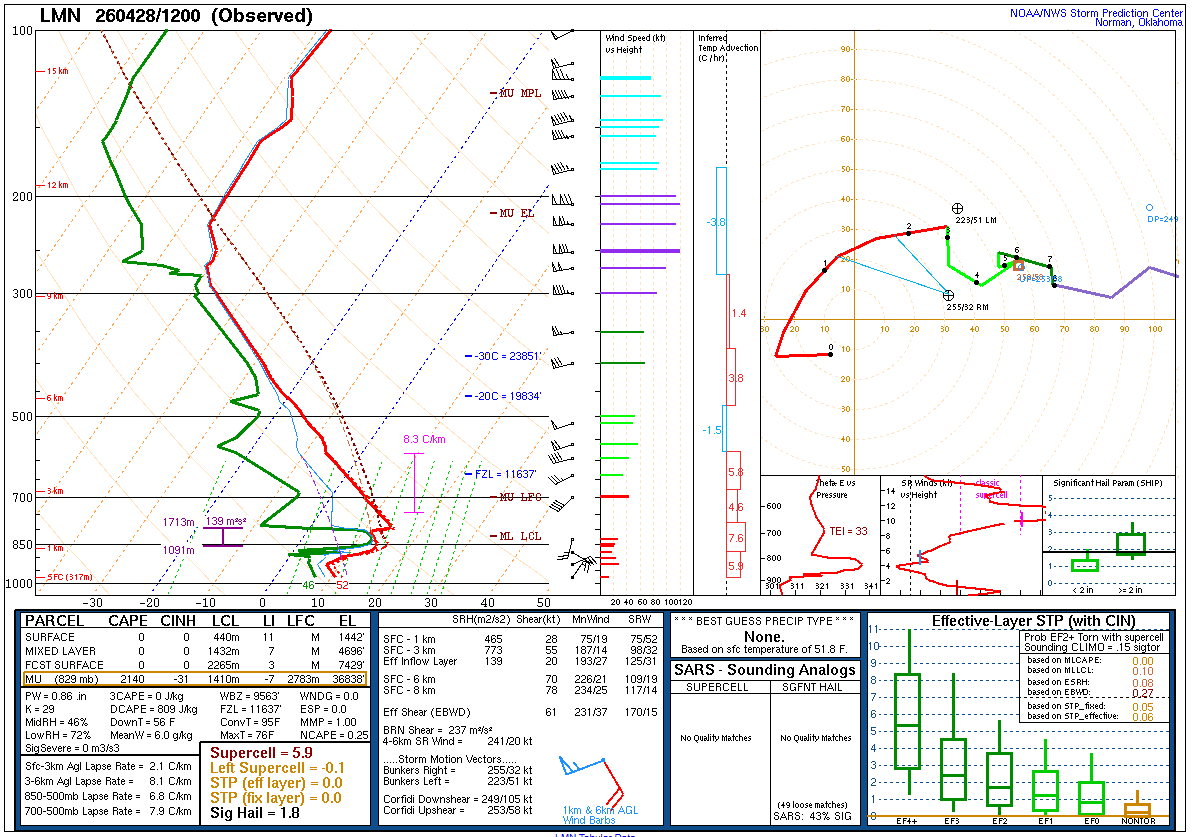
The event’s setup evolved rather rapidly through the morning hours. The tail-end of the preceding day’s cold front quickly began lifting back north through the Ozarks as a mid-level shortwave (Figure 1) and associated inverted surface trough (Figure 2) pushed east-northeast through Oklahoma. As such, our morning balloon data did not depict any instability in our area. The environment being quickly advected in from Oklahoma (Figure 4), however, did consist of elevated instability paired with copious amounts of deep-layer shear supportive of supercells.
 |
 |
 |
| Figure 1: 700 mb map depicting the shortwave over the central Plains with downstream warm air advection contributing to lift for storms to develop. | Figure 2: Surface map depicting pressure, temperature, dewpoint, and wind. At the time of storms, the surface front and inverted pressure trough was just south of the border showing that these storms were elevated. | Figure 3: 850 mb map showing that the 850-700 mb warm front had advected into southern Missouri just ahead of the developing storms. This provided ample elevated instability for the storms to feed on. |
The elevated shear being characterized by long, and rather straight hodographs paired with the elevated instability greater than 2000 J/kg of CAPE (Figure 5) were key to creating an environment conducive for very large hail for a few reasons:
Firstly, the elevated nature of instability focuses much of that energy within the hail-growth zone (HGZ; between -10° and -30° C). This means a lot of a storm’s updraft energy will be focused towards keeping hail stones lofted in the air, allowing for greater ice accretion. This particular event also had steep mid-level lapse rates at 7.5-8.5 C/km which aided updraft strength within the hail-growth zone. These environmental conditions, paired with strong deep-layer shear, led to a Large Hail Parameter of 28-32 for this event (Figure 6). Research suggests that most greater than 3.5-inch hail events occur within environments characterized by Large Hail Parameter values greater than 15-20.
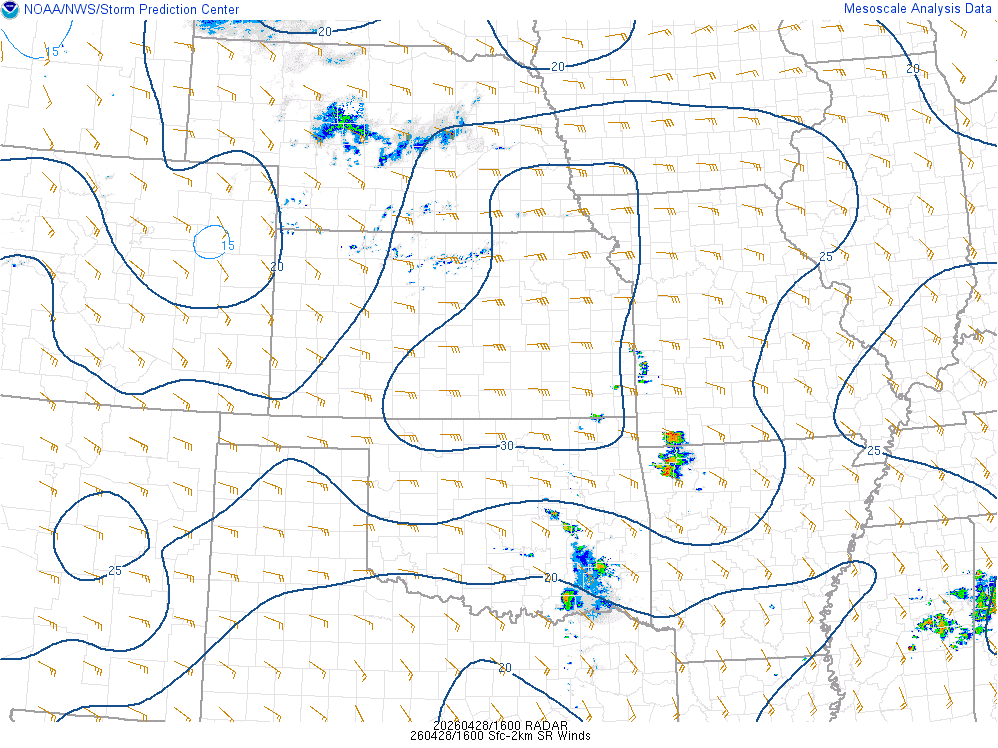
Secondly, the strong storm-relative inflow paired with the nature of the elevated instability were balanced enough to maximize hailstone embryo residence time within the hail growth zone. Ongoing operations-based research suggests that a balance between storm-relative inflow and instability below the hail-growth zone (sub-HGZ CAPE) increases the chance for large hail. The theory behind this research is that if you have strong sub-HGZ CAPE along with strong inflow into the storm, hail embryos may be lofted too quickly through the hail growth zone for greater ice accretion. Similarly, weak sub-HGZ CAPE and weak inflow would not loft hail embryos high enough for greater ice accretion. A balance between the two, either strong sub-HGZ CAPE and weak inflow, or weak sub-HGZ CAPE and strong inflow, would maximize residence time for hail embryos to grow larger. This was indeed the case with this event as the elevated instability meant less space between the inflow layer and the HGZ, creating weak sub-HGZ CAPE, and hodographs depicted strong storm-relative inflow, especially for left-moving supercells.
 |
 |
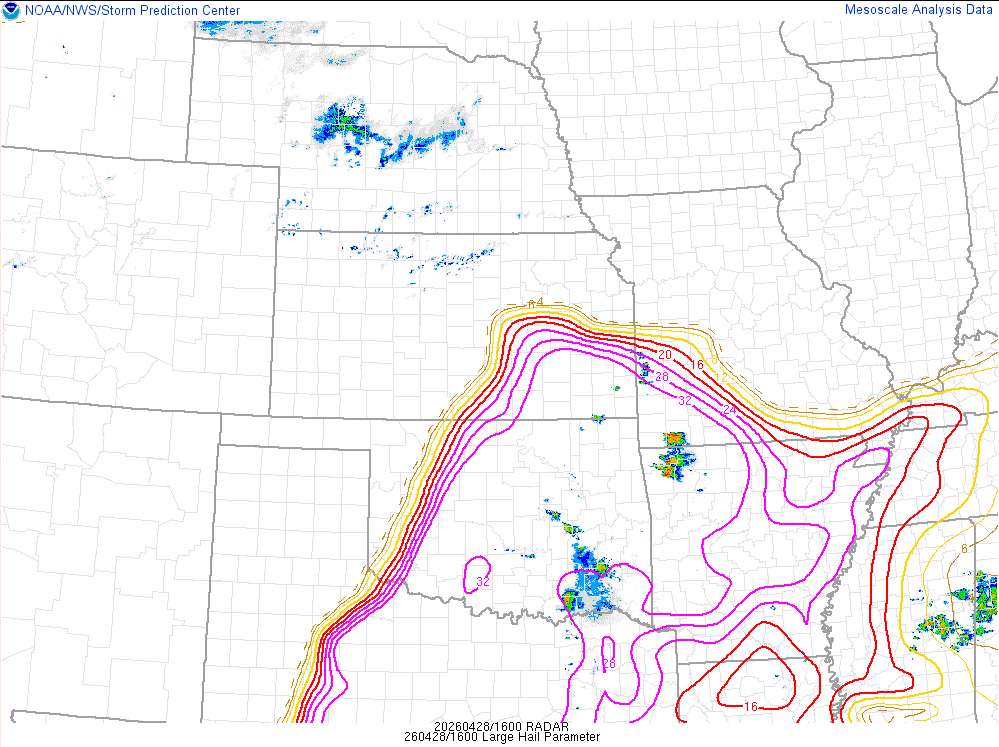 |
| Figure 4: 12Z SGF balloon data from the day of the event. Notice the lack of any instability since the front was well south of the area at the time. | Figure 5: 12Z LMN balloon data from northern Oklahoma. This sounding more accurately depicted the environment being advected into southern Missouri through the morning hours. Note the elevated instability and long, straight hodographs. | Figure 6: Map depicting the Large Hail Parameter. This parameter utilizes a combination of MUCAPE, deep-layer shear, mid-level lapse rates, storm-relative wind, and hail-growth zone thickness to evaluate environments conducive for large hail. Values of 28-32 were advected into southern Missouri, which correlate to many hail events with greater than 3.5-inch hailstones. |
Speaking of left-mover supercells, the shear profiles supported left-movers as evidenced by straight hodographs, with even some slight backing (or counter-clockwise curvature) in the mid-levels. As a result, this left-mover supercell persisted for an extended amount of time, beginning in northern Arkansas and surviving through central Missouri. Recent research also suggests that left-movers often overachieve the amount and/or size of hail than their prevalent right-mover counterparts. This is hypothesized to go somewhat hand-in-hand with the sub-HGZ CAPE and inflow theory explained above. Left-movers are often on the cold side of the environment, making them elevated with colder inflow air which may lead to favoring ice development than liquid (Figure 9). Furthermore, left-movers often move quicker than the mean wind (Figure 8), which increases storm-relative inflow (Figure 7), compensating for the weaker instability on the cold side. Indeed, the largest hail observed with this event came from the elevated long-lived left-mover supercell, which was supported well by the environment in place.
 |
 |
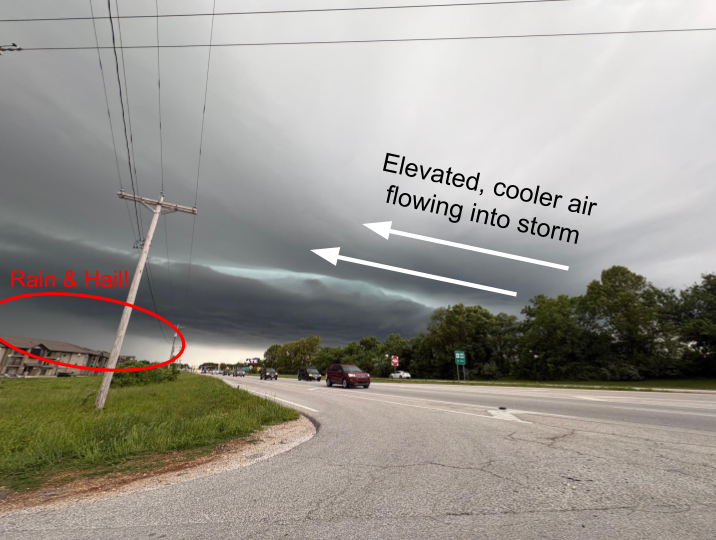 |
| Figure 7: Map depicting strong low-level storm-relative wind that compensated for the low sub-HGZ CAPE of the elevated storms. | Figure 8: Radar image of the left-mover supercell. The arrows depict the deviant movements of right-mover and left-mover supercells from the mean wind. In general, left-movers propagate quicker than the mean wind. | Figure 9: A picture of the left-mover storm that brought the hail to Springfield Metro. It can easily be seen where the cooler inflow air moves into the storm due to its elevated nature. |
 |
Media use of NWS Web News Stories is encouraged! Please acknowledge the NWS as the source of any news information accessed from this site. |
|


 Weather Story
 Weather Map
 Local Radar