Springfield, MO
Weather Forecast Office
Monthly Climate Normals - Springfield (1991-2020)
| Month | Total Precipitation Normal (inches) | Mean Max Temperature Normal (°F) | Mean Min Temperature Normal (°F) | Mean Avg Temperature Normal (°F) |
|---|---|---|---|---|
| January | 2.54 | 44.3 | 24.2 | 34.3 |
| February | 2.40 | 49.5 | 28.0 | 38.7 |
| March | 3.51 | 58.9 | 36.2 | 47.6 |
| April | 4.71 | 68.4 | 45.6 | 57.0 |
| May | 5.56 | 76.3 | 55.6 | 66.0 |
| June | 4.47 | 85.2 | 64.6 | 74.9 |
| July | 3.85 | 89.6 | 68.8 | 79.2 |
| August | 3.59 | 89.1 | 67.3 | 78.2 |
| September | 4.31 | 81.4 | 59.1 | 70.3 |
| October | 3.60 | 69.9 | 47.3 | 58.6 |
| November | 3.56 | 57.3 | 36.2 | 46.7 |
| December | 2.61 | 47.0 | 27.8 | 37.4 |
| Annual | 44.71 | 68.1 | 46.7 | 57.4 |
| Month | Total Snowfall Normal (inches) |
|---|---|
| July | 0.0 |
| August | 0.0 |
| September | 0.0 |
| October | 0.0 |
| November | 0.6 |
| December | 3.3 |
| January | 4.4 |
| February | 3.3 |
| March | 2.0 |
| April | 0.1 |
| May | 0.0 |
| June | 0.0 |
| Annual | 13.7 |
Current Hazards
Experimental Graphical Hazardous Weather Outlook
Submit a storm report
Local Storm Reports
Current Conditions
Observations
Lake Levels
Snowfall Analysis
Road Conditions
Satellite
CoCoRaHS
Graphical Conditions
Precip. Analysis
Forecasts
Forecast Discussion
Fire Weather
Aviation
GIS Forecast Maps
Activity Planner
Severe Weather
Winter Weather
Hurricanes
FAA Center Weather
Space Weather
Climatology
Records and Normals
Monthly Climate Summary
Local
National
Drought
Climate Science
Astronomical Data
US Dept of Commerce
National Oceanic and Atmospheric Administration
National Weather Service
Springfield, MO
Springfield-Branson National Airport
5805 West Highway EE
Springfield, MO 65802-8430
Business: 417-863-8028 Recording: 417-869-4491
Comments? Questions? Please Contact Us.


 Weather Story
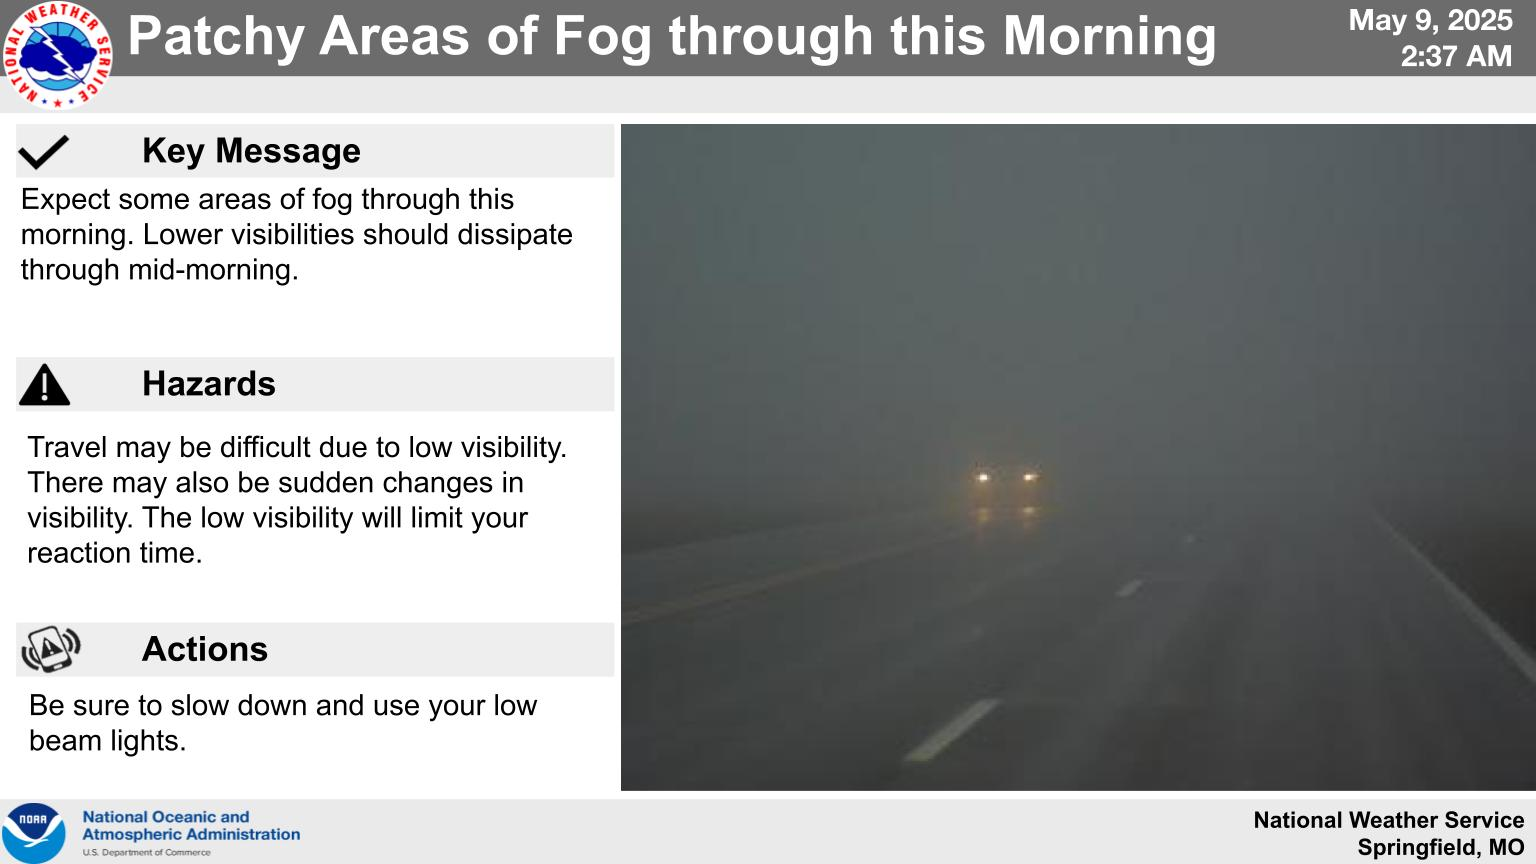
 Weather Map
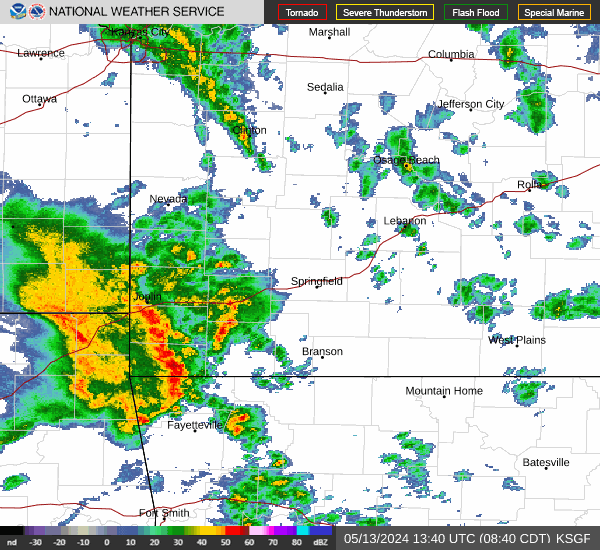 Local Radar