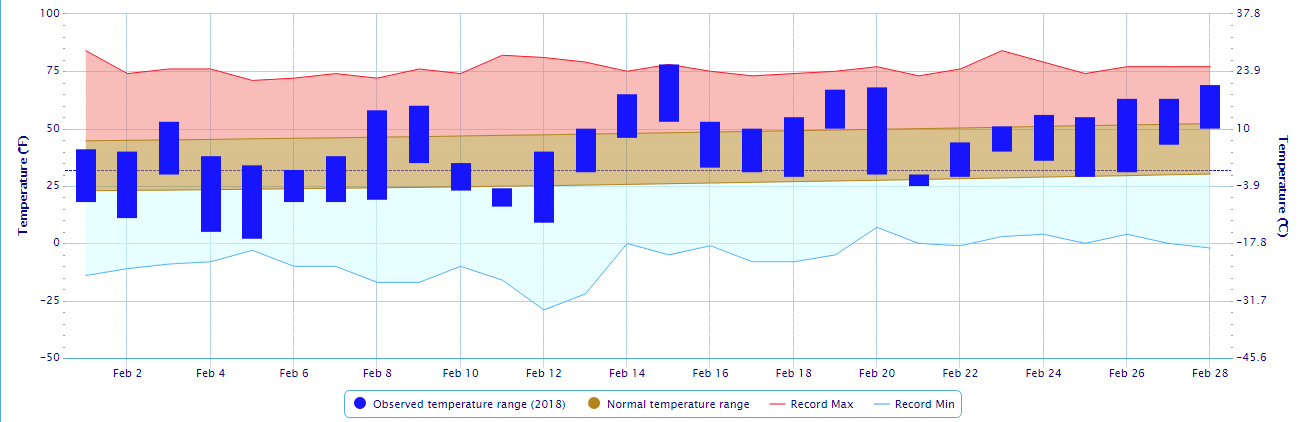
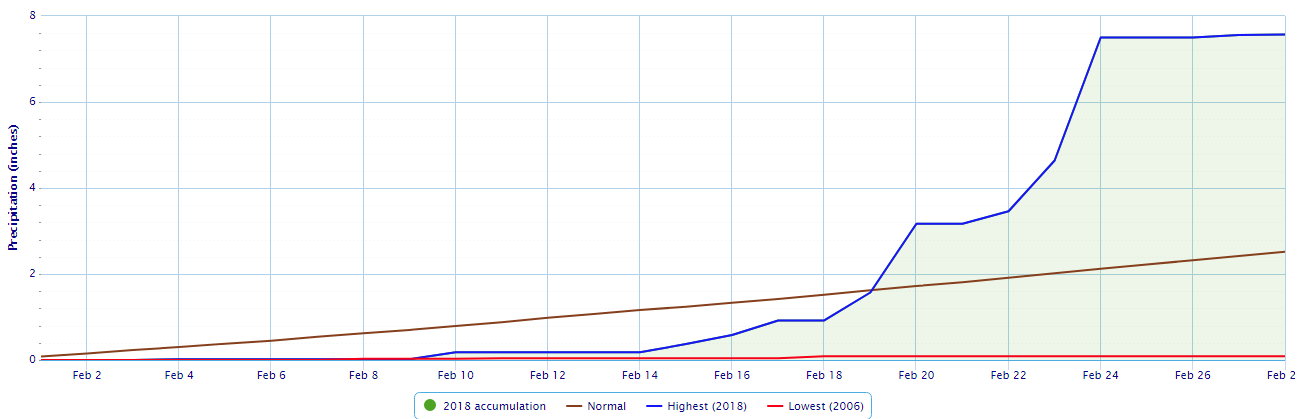
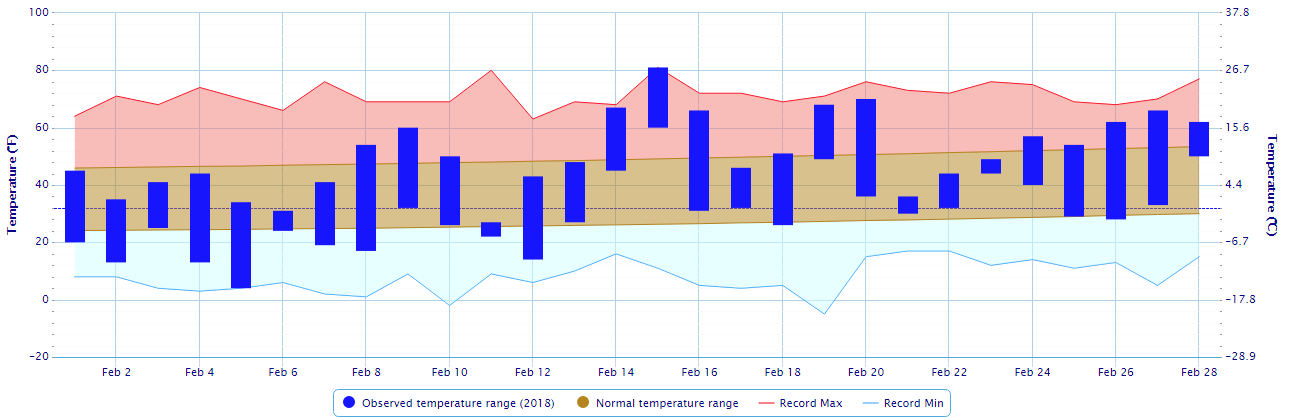
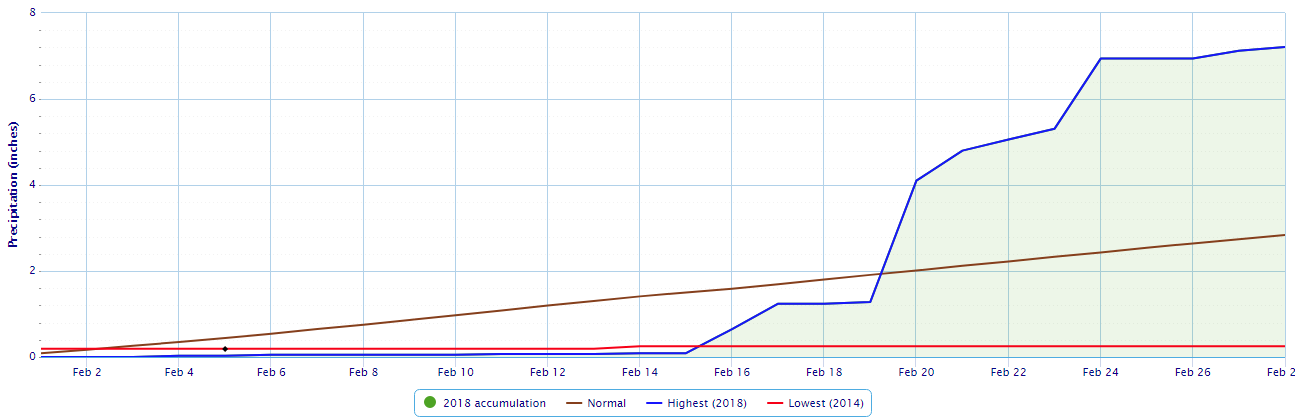
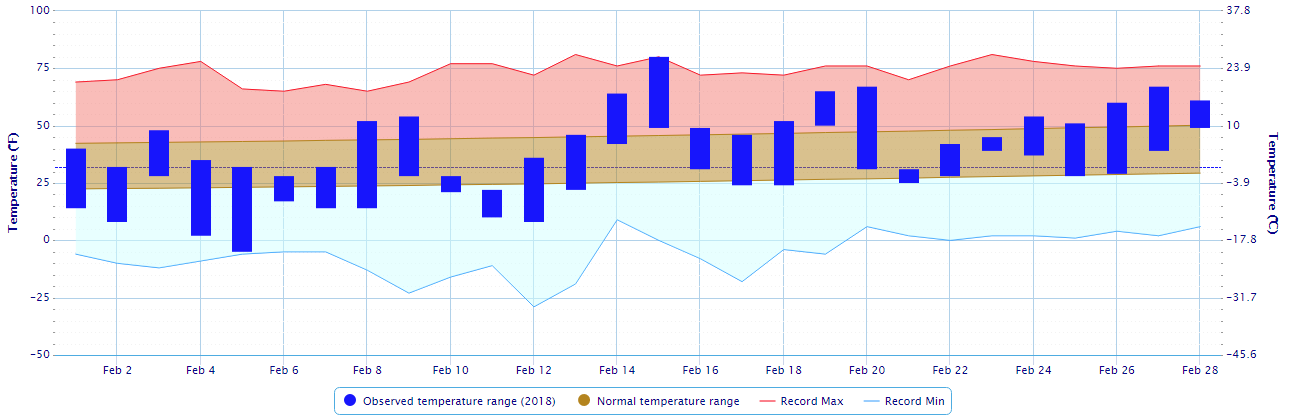
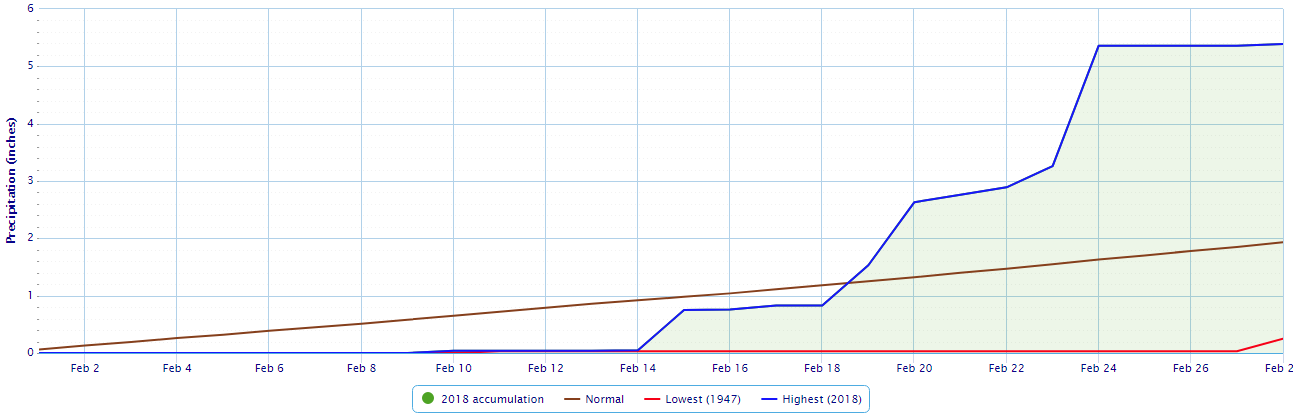
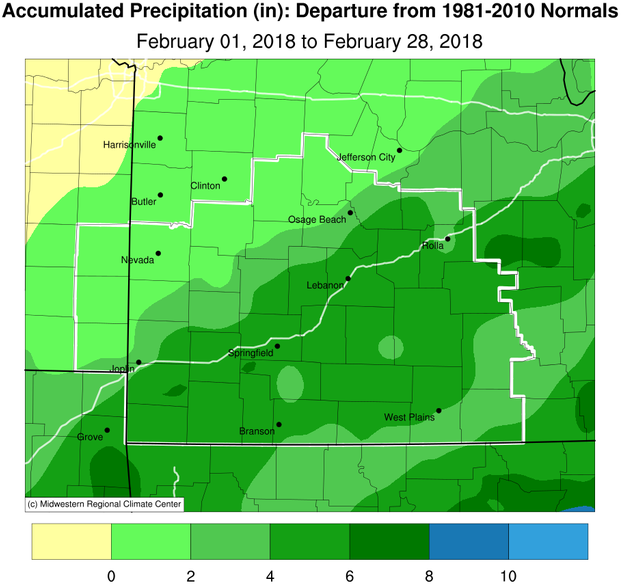
February 2018 was a month with well above normal to record precipitation across the area with the last part of February having a couple of systems that brought the most rainfall. Slightly warmer than normal temperatures occurred over the eastern half of the forecast area with slightly below normal temperatures in the far western forecast area. Springfield and Vichy both set record monthly rainfall for February.
Climatological Data for Springfield Area, MO (ThreadEx) - February 2018
Date
Max Temperature
Min Temperature
Avg Temperature
Avg Temperature Departure
HDD
CDD
Precipitation
Snowfall
Snow Depth
2018-02-01
41
18
29.5
-4.3
35
0
0.00
0.0
0
2018-02-02
40
11
25.5
-8.5
39
0
0.00
0.0
0
2018-02-03
53
30
41.5
7.3
23
0
0.00
0.0
0
2018-02-04
38
5
21.5
-12.9
43
0
0.02
0.9
0
2018-02-05
34
2
18.0
-16.6
47
0
T
0.0
1
2018-02-06
32
18
25.0
-9.8
40
0
T
T
0
2018-02-07
38
18
28.0
-7.0
37
0
0.00
0.0
0
2018-02-08
58
19
38.5
3.3
26
0
0.00
0.0
0
2018-02-09
60
35
47.5
12.0
17
0
0.00
0.0
0
2018-02-10
35
23
29.0
-6.7
36
0
0.16
T
0
2018-02-11
24
16
20.0
-16.0
45
0
T
T
T
2018-02-12
40
9
24.5
-11.7
40
0
0.00
0.0
T
2018-02-13
50
31
40.5
4.0
24
0
0.00
0.0
0
2018-02-14
65
46
55.5
18.7
9
0
T
0.0
0
2018-02-15
78
53
65.5
28.4
0
1
0.19
0.0
0
2018-02-16
53
33
43.0
5.6
22
0
0.21
0.0
0
2018-02-17
50
31
40.5
2.8
24
0
0.34
0.0
0
2018-02-18
55
29
42.0
4.0
23
0
0.00
0.0
0
2018-02-19
67
50
58.5
20.2
6
0
0.65
0.0
0
2018-02-20
68
30
49.0
10.4
16
0
1.60
T
0
2018-02-21
30
25
27.5
-11.4
37
0
T
0.0
0
2018-02-22
44
29
36.5
-2.7
28
0
0.29
0.0
0
2018-02-23
51
40
45.5
5.9
19
0
1.18
0.0
0
2018-02-24
56
36
46.0
6.1
19
0
2.86
M
0
2018-02-25
55
29
42.0
1.8
23
0
0.00
0.0
0
2018-02-26
63
31
47.0
6.4
18
0
0.00
0.0
0
2018-02-27
63
43
53.0
12.1
12
0
0.06
0.0
0
2018-02-28
69
50
59.5
18.3
5
0
0.01
0.0
0
Sum
1410
790
-
-
713
1
7.57
0.9
-
Average
50.4
28.2
39.3
2.1
-
-
-
-
0.0
Normal
48.2
26.1
37.2
-
780
0
2.52
3.6
-
Observations for each day cover the 24 hours ending
at the time given below (Local Standard Time).
Max Temperature : midnight
Min Temperature : midnight
Precipitation : midnight
Snowfall : midnight
Snow Depth : 6am
Joplin, MO Daily Data
Climatological Data for JOPLIN REGIONAL AIRPORT, MO - February 2018
Date
Max Temperature
Min Temperature
Avg Temperature
Avg Temperature Departure
HDD
CDD
Precipitation
Snow Depth
2018-02-01
43
18
30.5
-5.9
34
0
0.00
M
2018-02-02
43
13
28.0
-8.6
37
0
0.00
M
2018-02-03
53
34
43.5
6.7
21
0
0.00
M
2018-02-04
40
6
23.0
-14.0
42
0
0.01
M
2018-02-05
33
4
18.5
-18.7
46
0
0.00
M
2018-02-06
28
16
22.0
-15.4
43
0
T
M
2018-02-07
37
16
26.5
-11.2
38
0
0.00
M
2018-02-08
57
19
38.0
0.1
27
0
0.00
M
2018-02-09
60
31
45.5
7.3
19
0
0.00
M
2018-02-10
31
19
25.0
-13.4
40
0
T
0
2018-02-11
26
17
21.5
-17.2
43
0
T
M
2018-02-12
40
12
26.0
-13.0
39
0
0.00
M
2018-02-13
53
32
42.5
3.3
22
0
0.00
M
2018-02-14
65
45
55.0
15.5
10
0
0.00
M
2018-02-15
77
51
64.0
24.2
1
0
T
M
2018-02-16
51
33
42.0
1.9
23
0
T
M
2018-02-17
53
36
44.5
4.1
20
0
0.33
M
2018-02-18
59
33
46.0
5.3
19
0
0.00
M
2018-02-19
66
52
59.0
18.0
6
0
0.93
M
2018-02-20
69
26
47.5
6.1
17
0
1.19
M
2018-02-21
29
24
26.5
-15.2
38
0
T
M
2018-02-22
43
29
36.0
-6.0
29
0
0.15
M
2018-02-23
42
37
39.5
-2.8
25
0
1.33
M
2018-02-24
52
32
42.0
-0.6
23
0
0.79
0
2018-02-25
55
26
40.5
-2.4
24
0
0.00
M
2018-02-26
64
29
46.5
3.2
18
0
0.00
M
2018-02-27
67
42
54.5
10.9
10
0
0.20
M
2018-02-28
69
51
60.0
16.1
5
0
0.01
M
Sum
1405
783
-
-
719
0
4.94
-
Average
50.2
28.0
39.1
-0.7
-
-
-
0.0
Normal
50.5
29.2
39.8
-
705
1
2.32
-
Observations for each day cover the 24 hours ending
at the time given below (Local Standard Time).
Observation times may have changed during this period.
Max Temperature : midnight
Min Temperature : midnight
Precipitation : midnight
Snow Depth : unknown, 6am
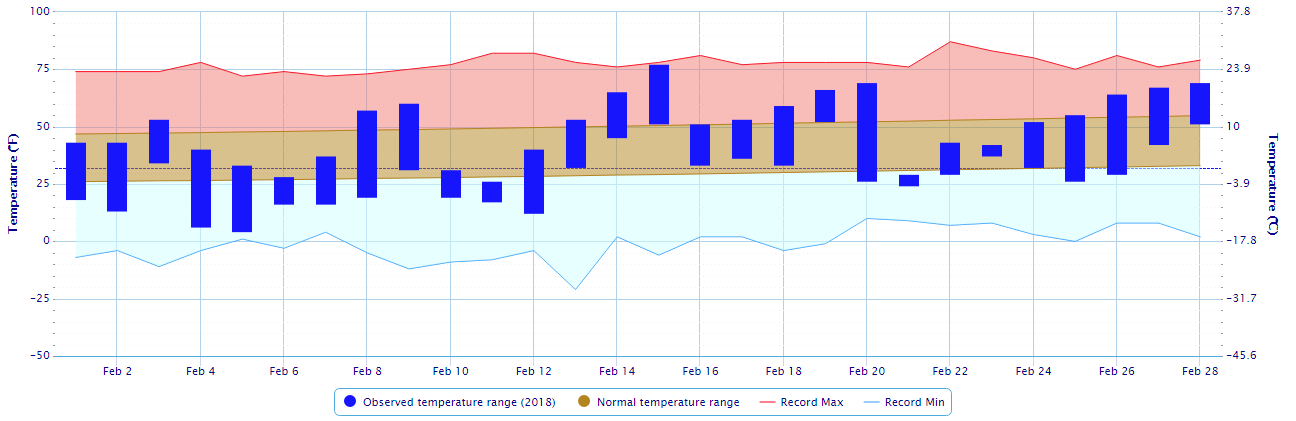
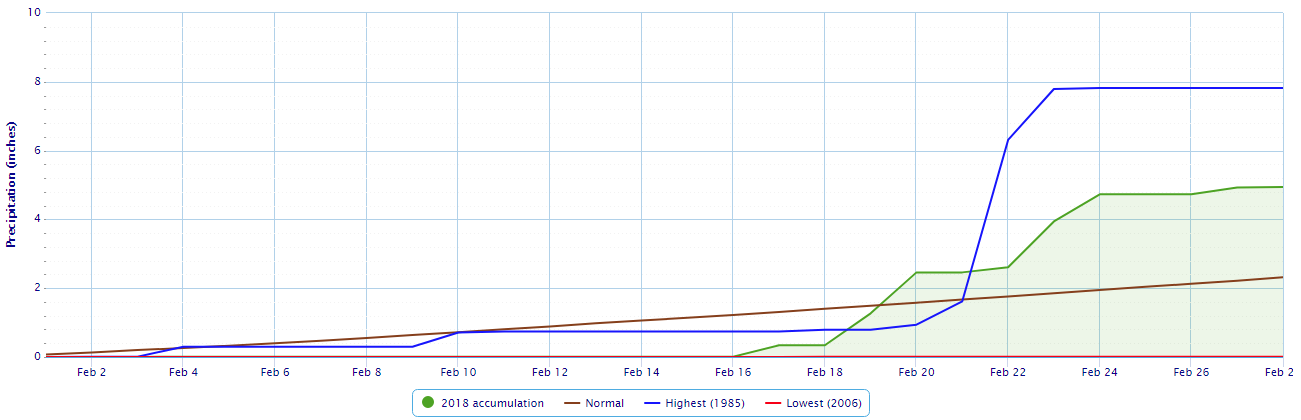
West Plains, MO Daily Data
Climatological Data for WEST PLAINS MUNICIPAL AP, MO - February 2018
Date
Max Temperature
Min Temperature
Avg Temperature
Avg Temperature Departure
HDD
CDD
Precipitation
Snow Depth
2018-02-01
45
20
32.5
-2.5
32
0
0.00
M
2018-02-02
35
13
24.0
-11.1
41
0
0.00
M
2018-02-03
41
25
33.0
-2.3
32
0
0.00
M
2018-02-04
44
13
28.5
-6.9
36
0
0.03
M
2018-02-05
34
4
19.0
-16.6
46
0
0.00
M
2018-02-06
31
24
27.5
-8.3
37
0
0.02
M
2018-02-07
41
19
30.0
-5.9
35
0
0.00
M
2018-02-08
54
17
35.5
-0.6
29
0
0.00
M
2018-02-09
60
32
46.0
9.7
19
0
0.00
M
2018-02-10
50
26
38.0
1.5
27
0
T
M
2018-02-11
27
22
24.5
-12.2
40
0
0.02
M
2018-02-12
43
14
28.5
-8.5
36
0
0.00
M
2018-02-13
48
27
37.5
0.3
27
0
0.00
M
2018-02-14
67
45
56.0
18.6
9
0
0.02
M
2018-02-15
81
60
70.5
32.8
0
6
0.00
M
2018-02-16
66
31
48.5
10.6
16
0
0.56
M
2018-02-17
46
32
39.0
0.8
26
0
0.59
M
2018-02-18
51
26
38.5
0.0
26
0
0.00
M
2018-02-19
68
49
58.5
19.7
6
0
0.04
M
2018-02-20
70
36
53.0
13.9
12
0
2.82
M
2018-02-21
36
30
33.0
-6.4
32
0
0.70
M
2018-02-22
44
32
38.0
-1.7
27
0
0.26
M
2018-02-23
49
44
46.5
6.5
18
0
0.25
M
2018-02-24
57
40
48.5
8.2
16
0
1.63
0
2018-02-25
54
29
41.5
0.8
23
0
0.00
M
2018-02-26
62
28
45.0
4.0
20
0
0.00
M
2018-02-27
66
33
49.5
8.1
15
0
0.18
M
2018-02-28
62
50
56.0
14.3
9
0
0.09
M
Sum
1432
821
-
-
692
6
7.21
-
Average
51.1
29.3
40.2
2.3
-
-
-
0.0
Normal
49.2
26.5
37.9
-
760
0
2.84
-
Observations for each day cover the 24 hours ending
at the time given below (Local Standard Time).
Max Temperature : midnight
Min Temperature : midnight
Precipitation : midnight
Snow Depth : 6am
Vichy, MO Daily Data
Climatological Data for VICHY ROLLA NATL AP, MO - February 2018
Date
Max Temperature
Min Temperature
Avg Temperature
Avg Temperature Departure
HDD
CDD
Precipitation
Snow Depth
2018-02-01
40
14
27.0
-5.4
38
0
0.00
M
2018-02-02
32
8
20.0
-12.5
45
0
0.00
M
2018-02-03
48
28
38.0
5.3
27
0
T
M
2018-02-04
35
2
18.5
-14.4
46
0
T
M
2018-02-05
32
-5
13.5
-19.6
51
0
T
M
2018-02-06
28
17
22.5
-10.8
42
0
T
M
2018-02-07
32
14
23.0
-10.5
42
0
0.00
M
2018-02-08
52
14
33.0
-0.8
32
0
0.00
M
2018-02-09
54
28
41.0
7.0
24
0
0.00
M
2018-02-10
28
21
24.5
-9.7
40
0
0.04
0
2018-02-11
22
10
16.0
-18.5
49
0
T
M
2018-02-12
36
8
22.0
-12.7
43
0
0.00
M
2018-02-13
46
22
34.0
-1.0
31
0
0.00
M
2018-02-14
64
42
53.0
17.7
12
0
0.01
M
2018-02-15
80
49
64.5
28.9
0
0
0.70
M
2018-02-16
49
31
40.0
4.2
25
0
0.01
M
2018-02-17
46
24
35.0
-1.1
30
0
0.07
M
2018-02-18
52
24
38.0
1.6
27
0
0.00
M
2018-02-19
65
50
57.5
20.7
7
0
0.70
M
2018-02-20
67
31
49.0
11.9
16
0
1.10
M
2018-02-21
31
25
28.0
-9.4
37
0
0.13
M
2018-02-22
42
28
35.0
-2.7
30
0
0.13
M
2018-02-23
45
39
42.0
4.0
23
0
0.37
M
2018-02-24
54
37
45.5
7.1
19
0
2.10
0
2018-02-25
51
28
39.5
0.8
25
0
0.00
M
2018-02-26
60
29
44.5
5.4
20
0
0.00
M
2018-02-27
67
39
53.0
13.6
12
0
T
M
2018-02-28
61
49
55.0
15.3
10
0
0.03
M
Sum
1319
706
-
-
803
0
5.39
-
Average
47.1
25.2
36.2
0.5
-
-
-
0.0
Normal
45.8
25.5
35.7
-
822
0
1.93
-
Observations for each day cover the 24 hours ending
at the time given below (Local Standard Time).
Observation times may have changed during this period.


 Weather Story
 Weather Map
 Local Radar