
The storm system producing severe weather and isolated flash flooding will begin to weaken tonight. As the storm moves east, several chances for severe weather and heavy rain are possible from the Midwest and Ohio Valley to the Southern Plains, Lower Mississippi and Tennessee valley. Heavy snow continue to impact the Northern Rockies. Critical fire weather conditions persist in the Southern Plains Read More >
The official report from the National Hurricane Center (NHC) https://www.nhc.noaa.gov/data/tcr/AL152017_Maria.pdf
|
Synoptic Overview
|
|
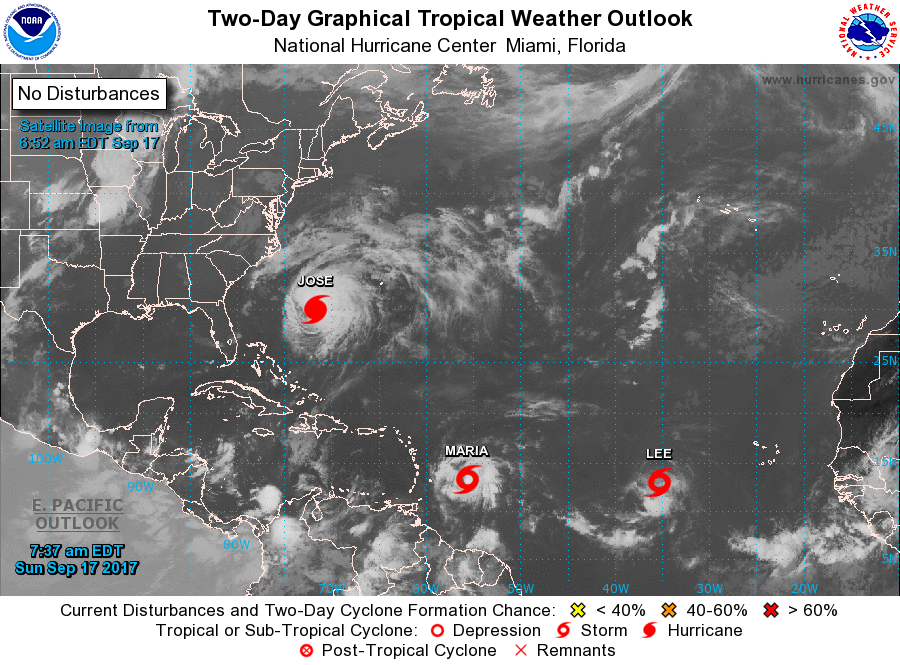
Maria formed from an African easterly wave that moved across the tropical Atlantic Ocean during the week of September 10th to September 17th, 2017. It was not until 200 PM AST (1800 UTC) on September 16th, that its convective organization improved that the NHC classified the system as a tropical depression about 700 miles east-southeast of the Lesser Antilles. At the 500 PM AST (2100 UTC) advisory, just three hours later, the depression was upgraded to Tropical Storm Maria with maximum sustained winds of 50 mph. Thereafter, Maria gradually intensified and became the 8th hurricane of the 2017 Atlantic hurricane season with 75 mph maximum sustained winds at 500 PM AST (2100 UTC) on September 17th.
Figure 1: Tropical Weather Outlook issued by the National Hurricane Center at 7:37 AM on Sep 17, 2017.
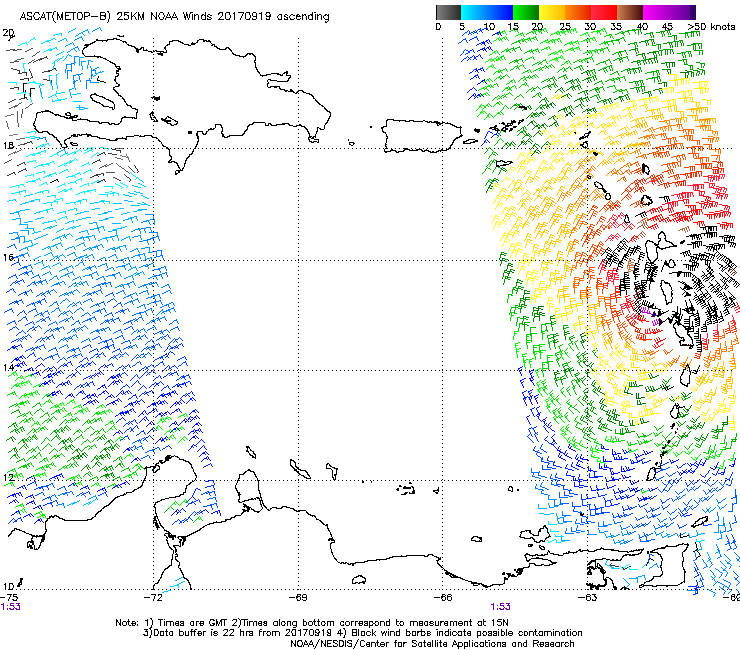
Within the next 24 to 30 hours and within an 18 hour period, Maria underwent through rapid intensification, strengthening from a category 1 to an extremely dangerous category 5 hurricane. At the time, environmental conditions were favorable for intensification to occur due to sea surface temperatures greater than 28 degrees Celsius, light vertical wind shear, and moist air. Maria’s first landfall was in Dominica, part of the Windward Islands, as a category 5 hurricane at around 915 PM AST on the 18th (0115 UTC on the 19th). Maria maintained Category 5 strength as it continued its path towards the U.S. Virgin Islands and Puerto Rico. Rain bands first approached Saint Croix, as well as portions of Saint Thomas and Saint John during the morning hours on the 19th. Throughout the afternoon and early evening hours, rain bands generating tropical storm conditions reached Vieques, Culebra, and Puerto Rico.
Figure 2: Descending pass of the ASCAT showing several locations of winds exceeding 50 knots on September 19.
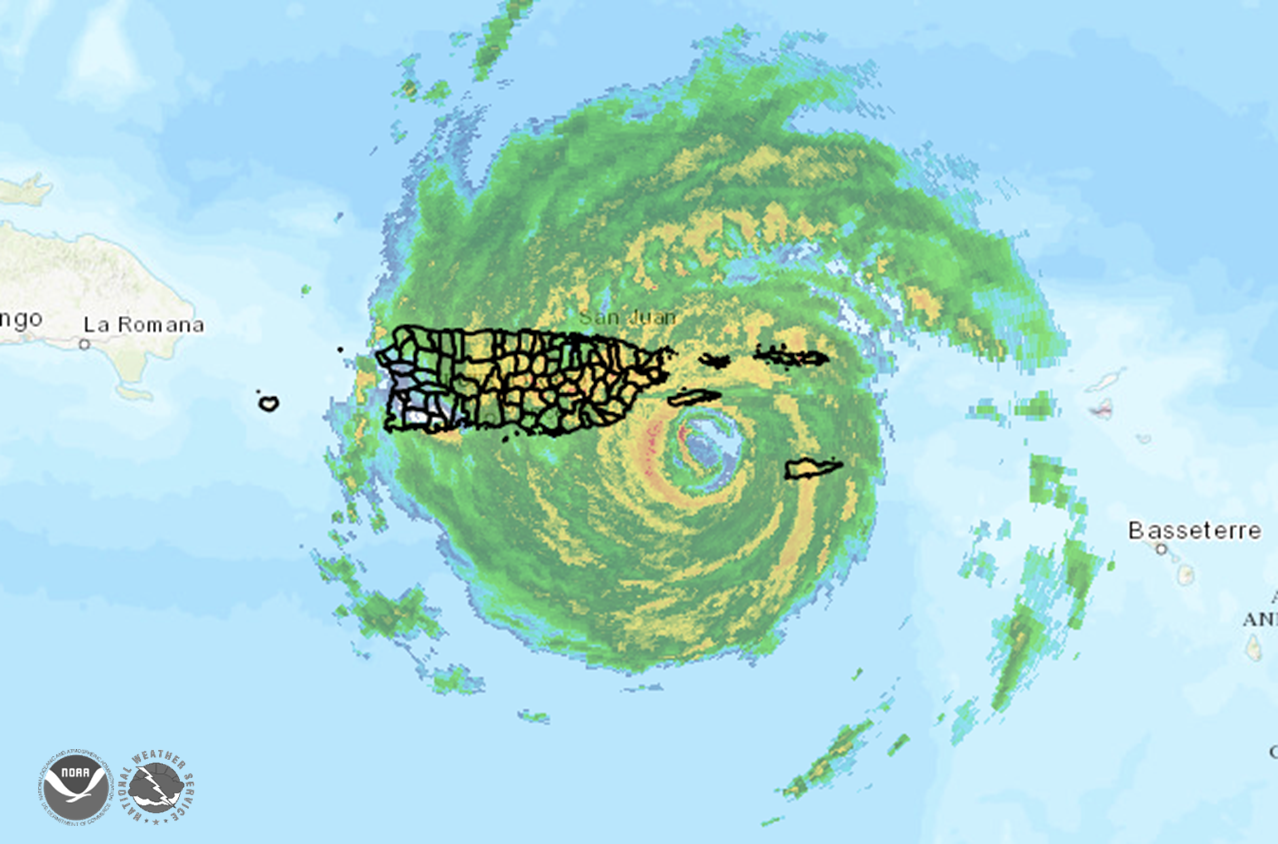
As the center of Maria approached the USVI and Puerto Rico, the frequency of the rain bands as well as the strength or intensity of the winds increased. Between 12 AM and 1 AM AST (0400-0500 UTC) on September 20th, hurricane force winds were first reported in St. Croix as Maria’s eyewall moved over that island. Based on observations from the Hurricane Hunters, the intensity of Maria was lowered from Category 5 hurricane with 175 MPH just southeast of St. Croix to Category 4 hurricane with 155 MPH south of Vieques. Around 5 AM AST (0900 UTC), hurricane force winds were reported in Vieques and the eastern half of mainland Puerto Rico. At approximately 615 AM AST (1015 UTC), Maria made landfall in Yabucoa, Puerto Rico as a strong category 4 hurricane with maximum sustained winds of 155 mph. As the center of the storm moved west-northwestward over southeastern PR into the interior and northwestern PR, widespread hurricane force winds spread all over mainland PR along with extremely heavy rainfall that produced major to catastrophic flooding and flash flooding, especially across the northern half of Puerto Rico. Maria’s center moved over the coastal waters off northwestern Puerto Rico early that afternoon. Even though hurricane force winds started to diminish once the system moved offshore, tropical storm force winds continued well into the evening and overnight hours across mainland Puerto Rico.
Figure 3: TJUA NEXRAD Radar at 354 AM AST showing the center of Hurricane Maria just south of Vieques. |
|
Track and Satellite Imagery
|
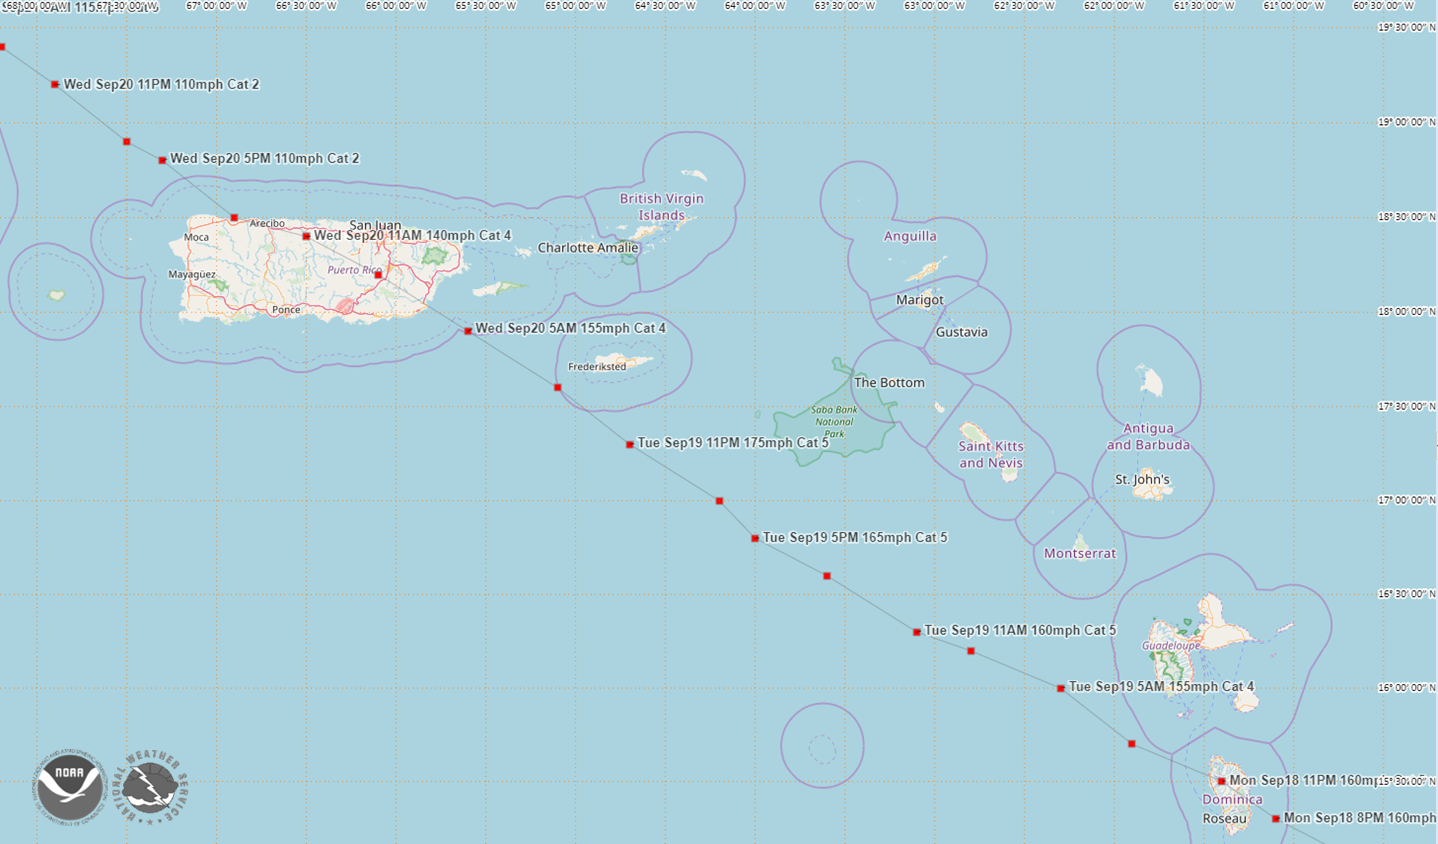
Figure 1: Preliminary track of Hurricane Maria moving across the Northeast Caribbean Region.
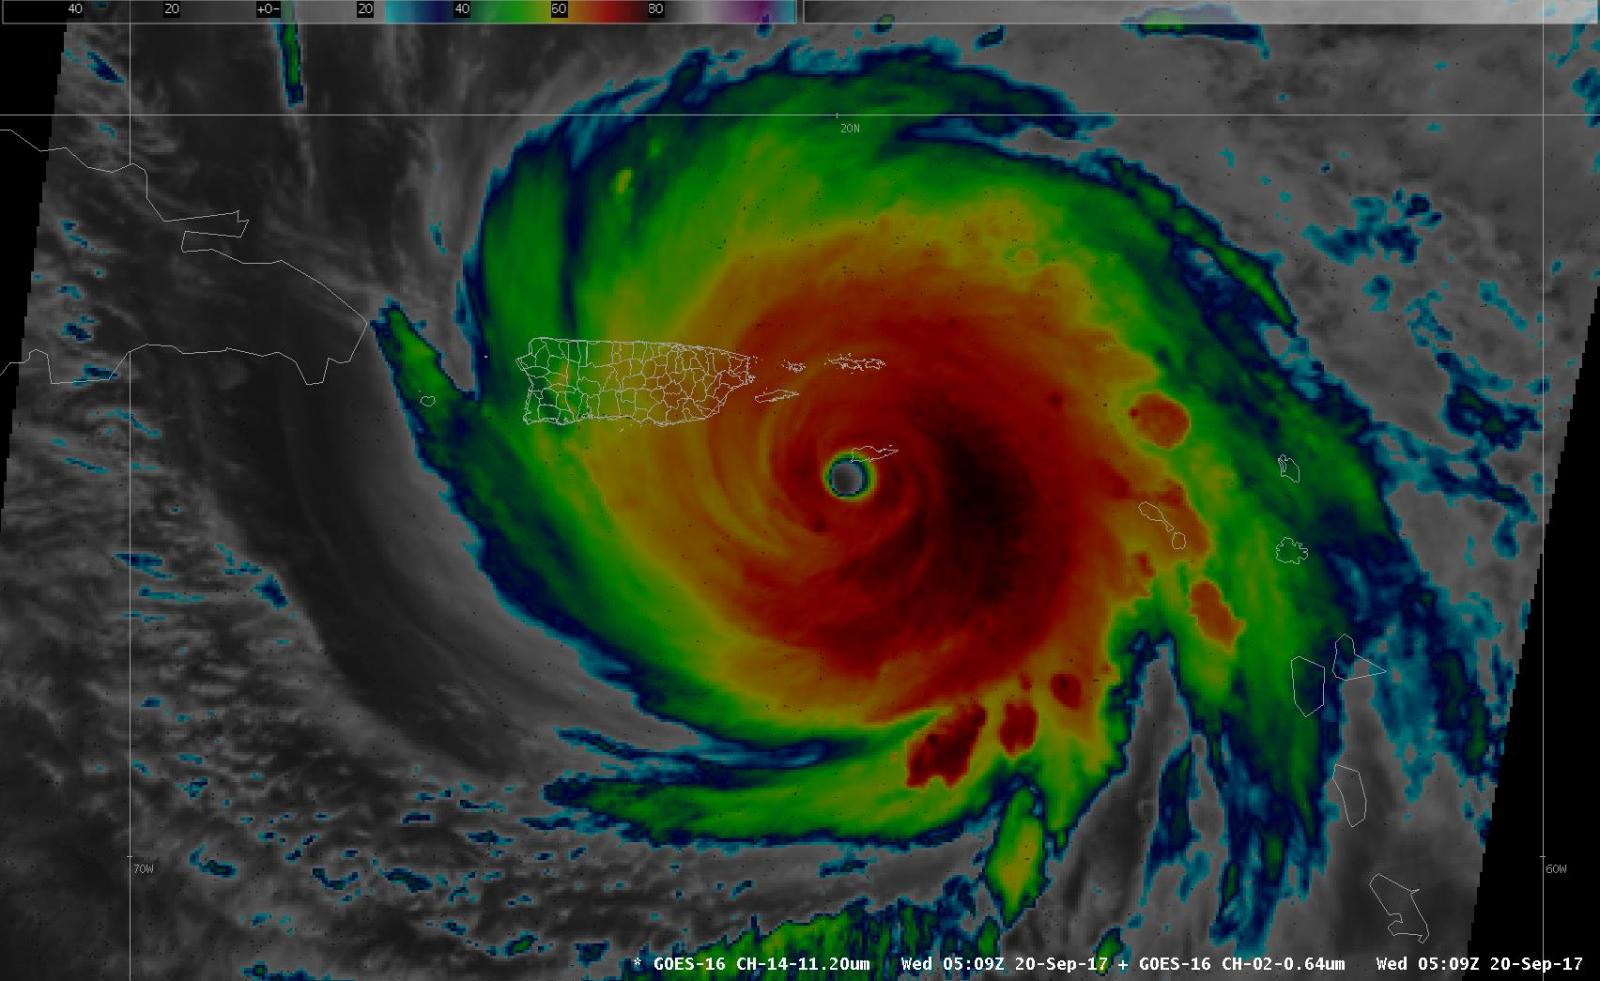
Figure 2: The center of Hurricane Maria just southeast of St. Croix U.S. Virgin Islands. GOES 16 data preliminary/non-operational.
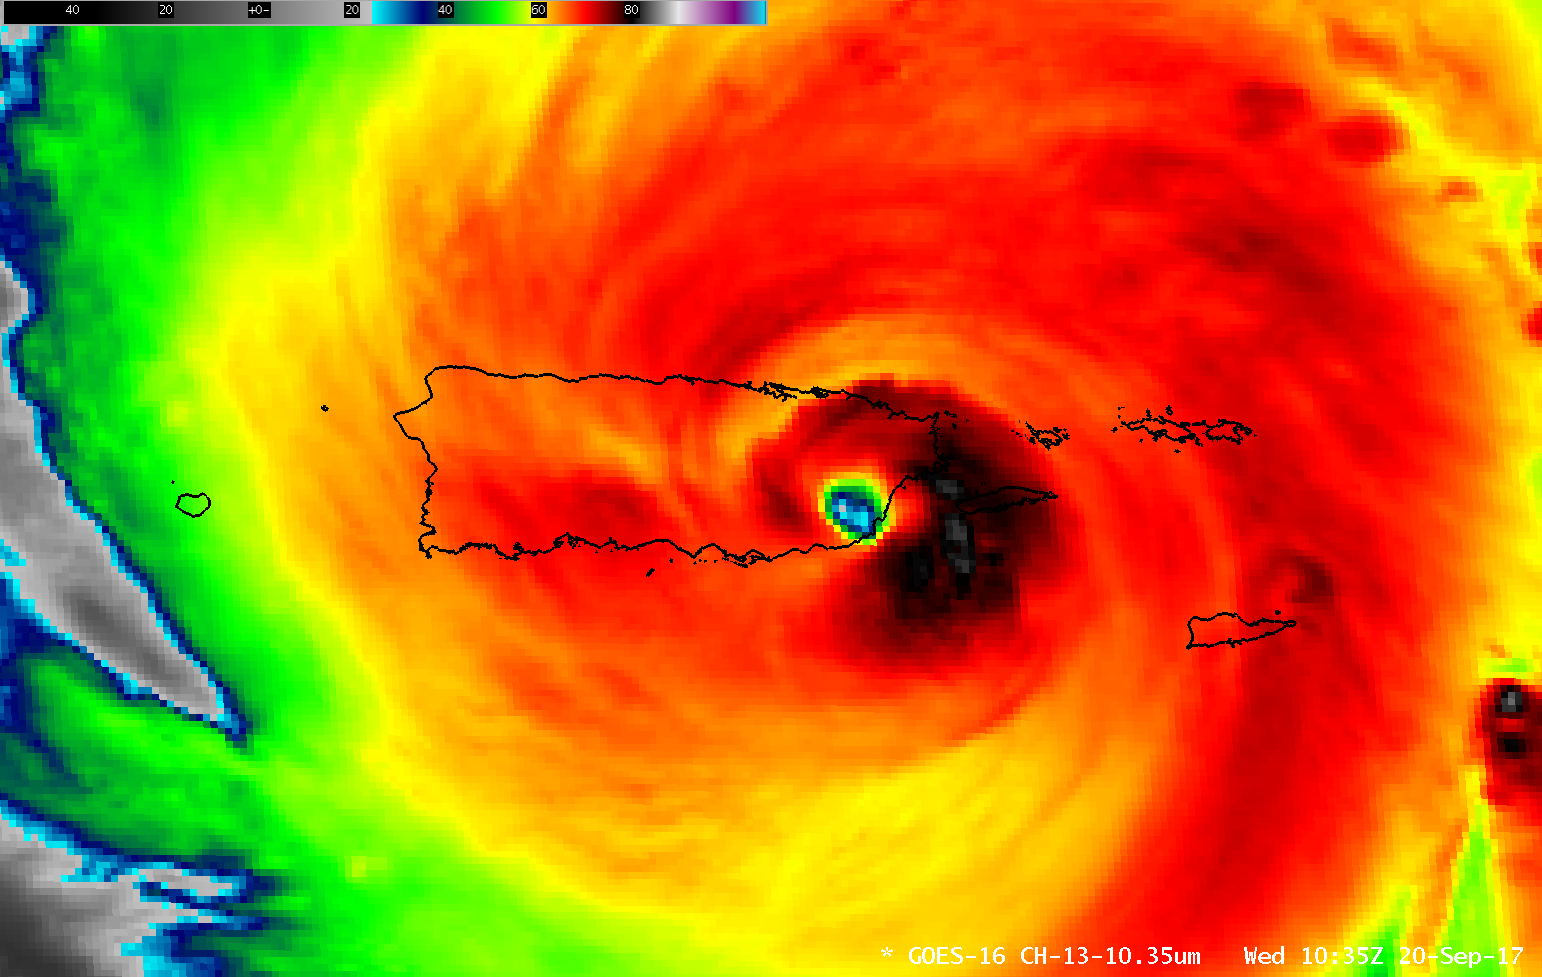
Figure 3: Hurricane Maria made landfall over southeastern Puerto Rico as Category 4 Hurricane with 155 MPH. GOES 16 data preliminary/non-operational.
.jpg)
Figure 4: Visible Infrared Imaging Radiometer Suite (VIIRS) sensor showing Hurricane Maria moving out of the north coast of Puerto Rico on Wednesday afternoon.

Figure 5: Hurricane Maria approaching U.S. Virgin Islands and Puerto Rico. Source: WSR-88D TJUA.
|
Rainfall
|
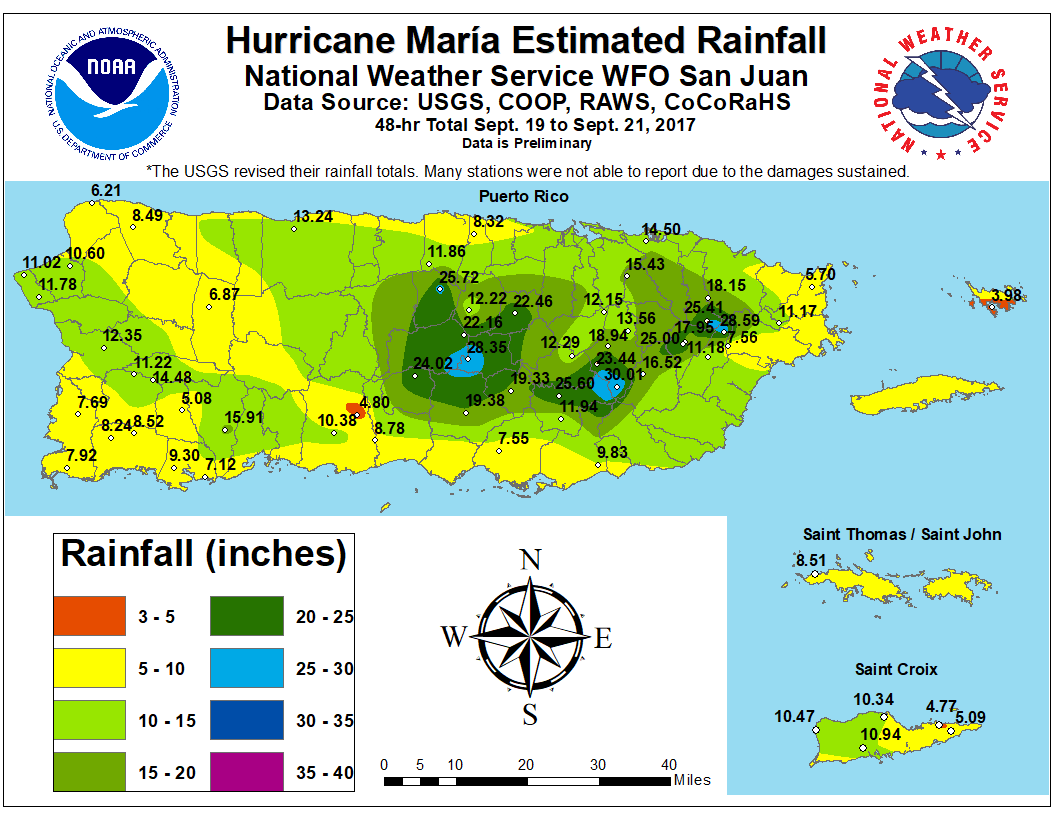
Figure 1: 48-hour rainfall from 8 AM AST Sep 19, 2017 to 8 AM AST Sep 21, 2017.
|
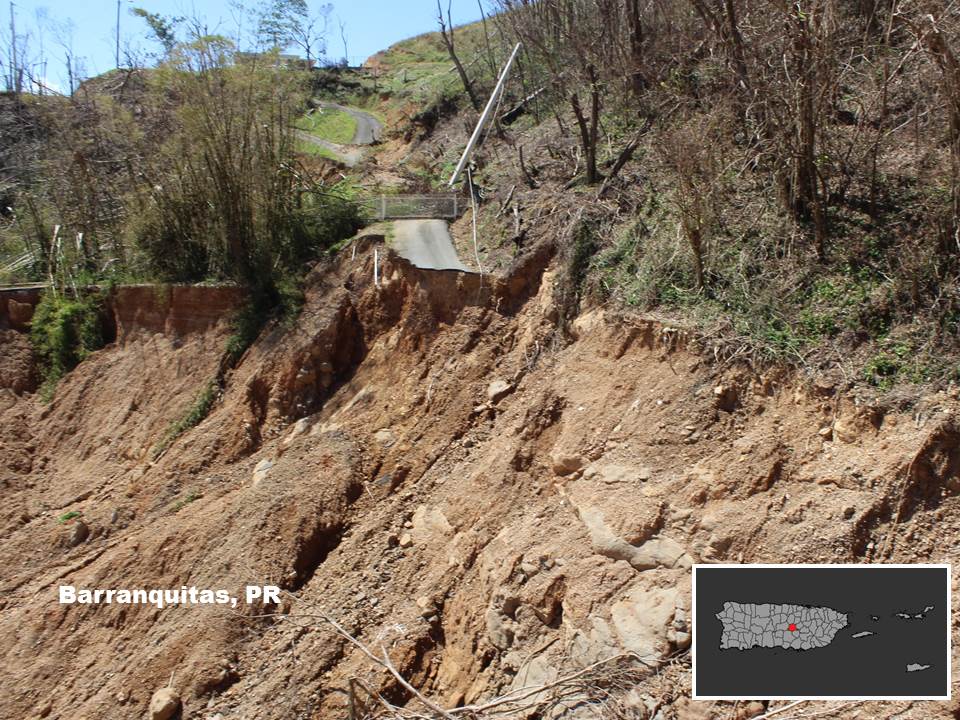
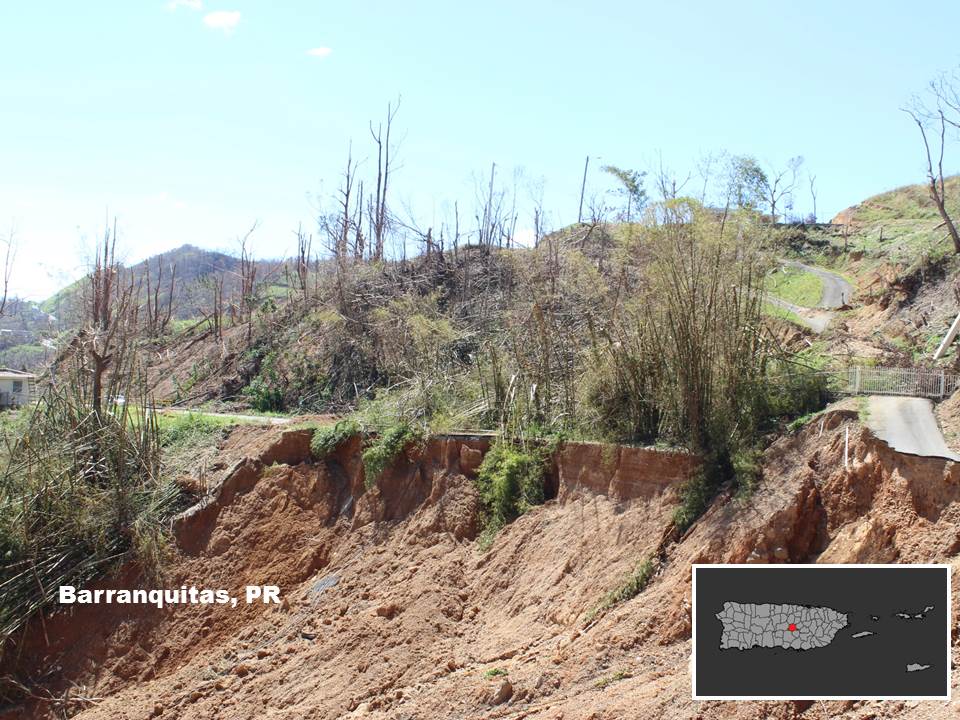
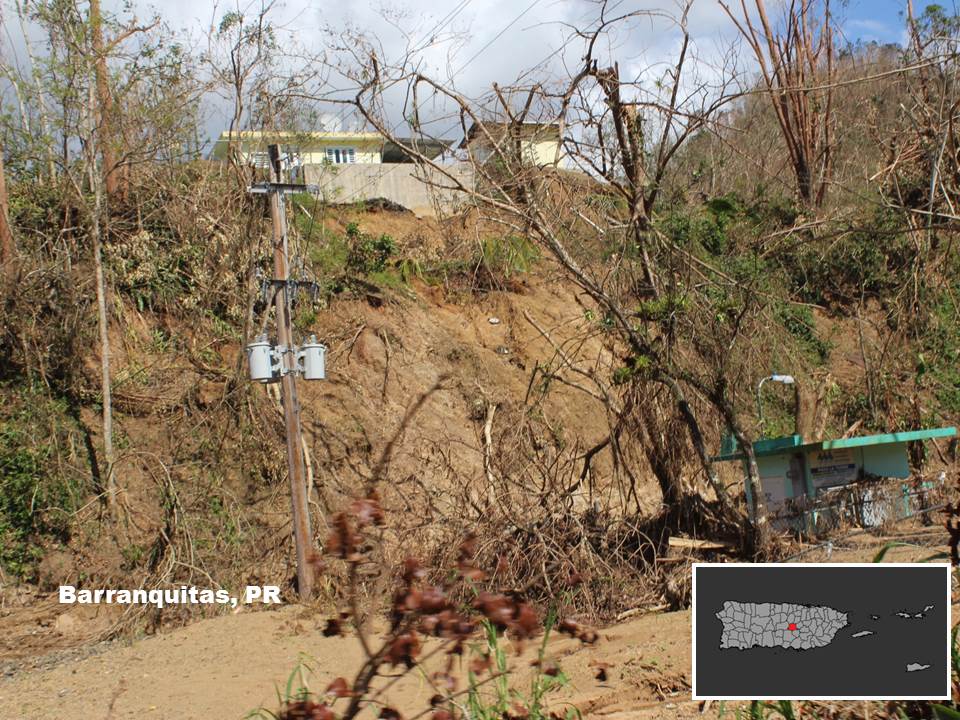
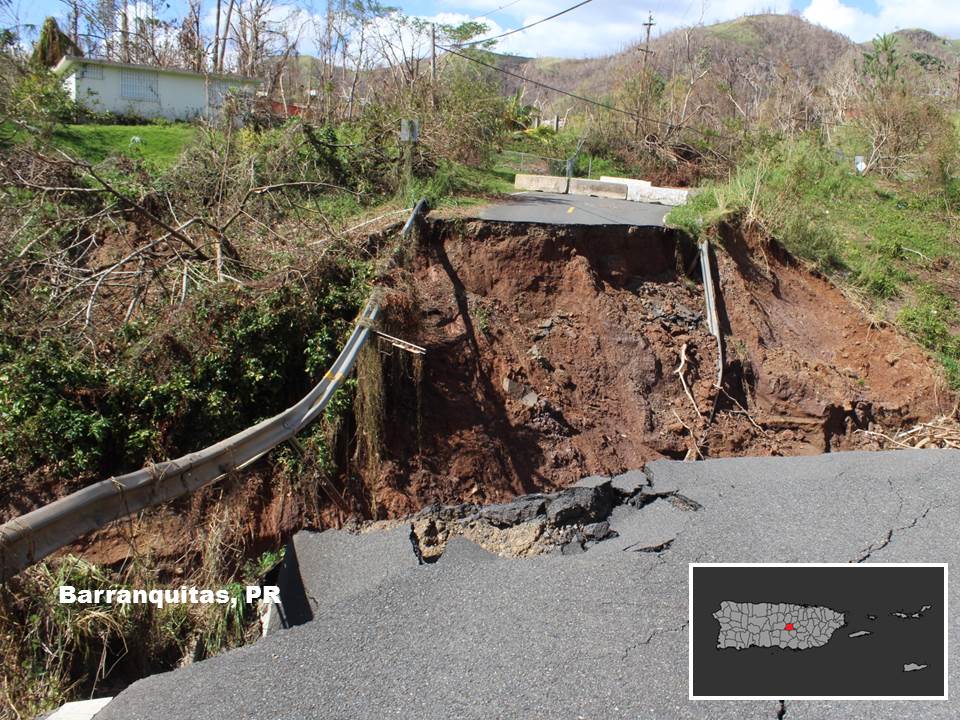
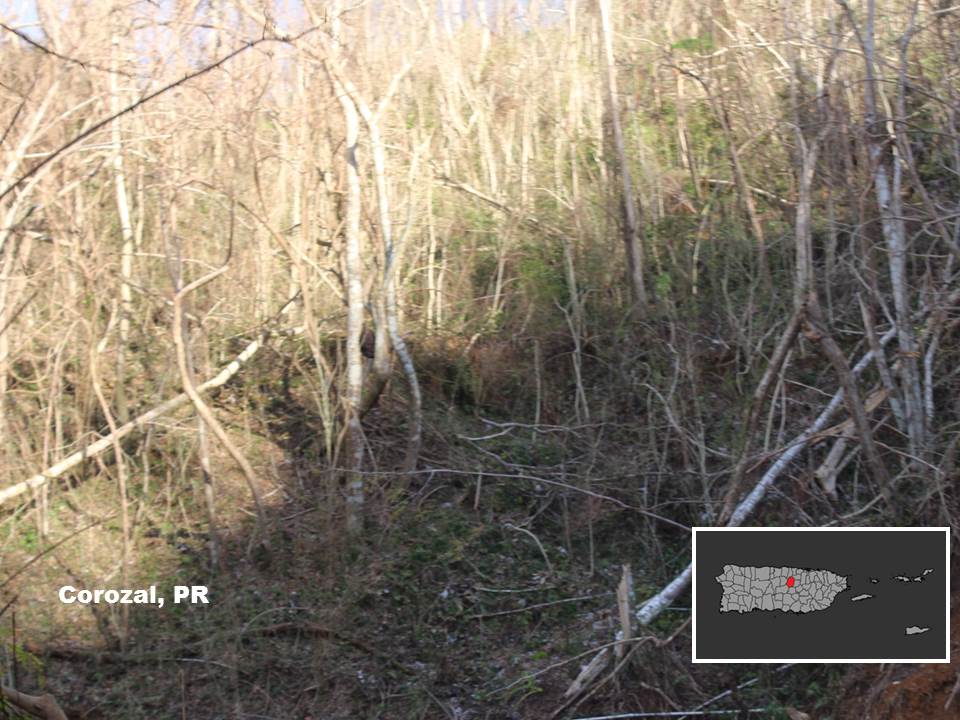
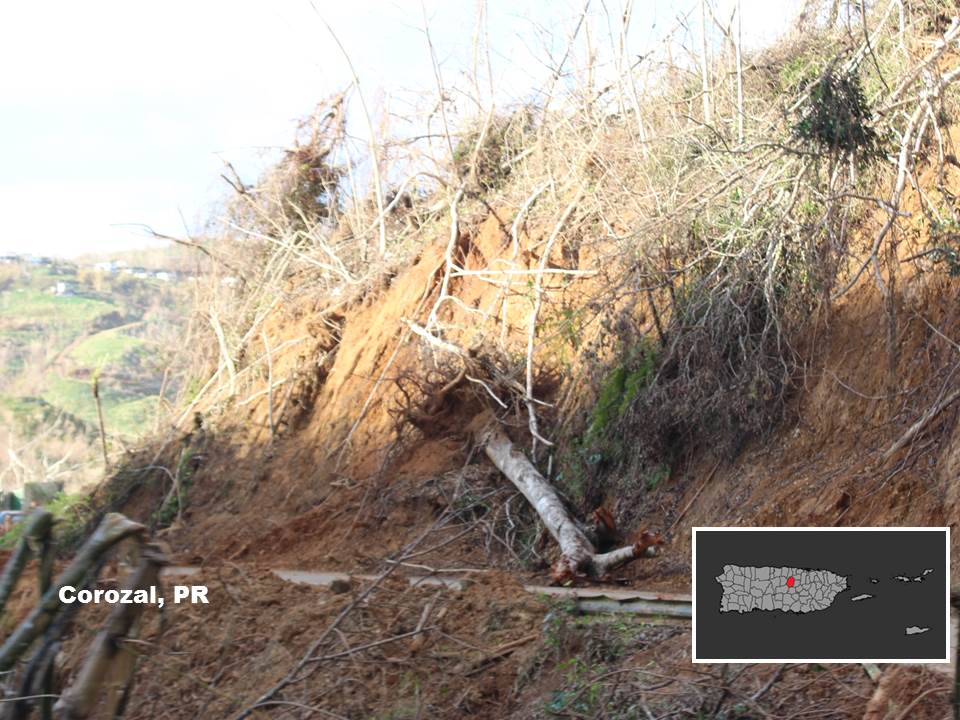
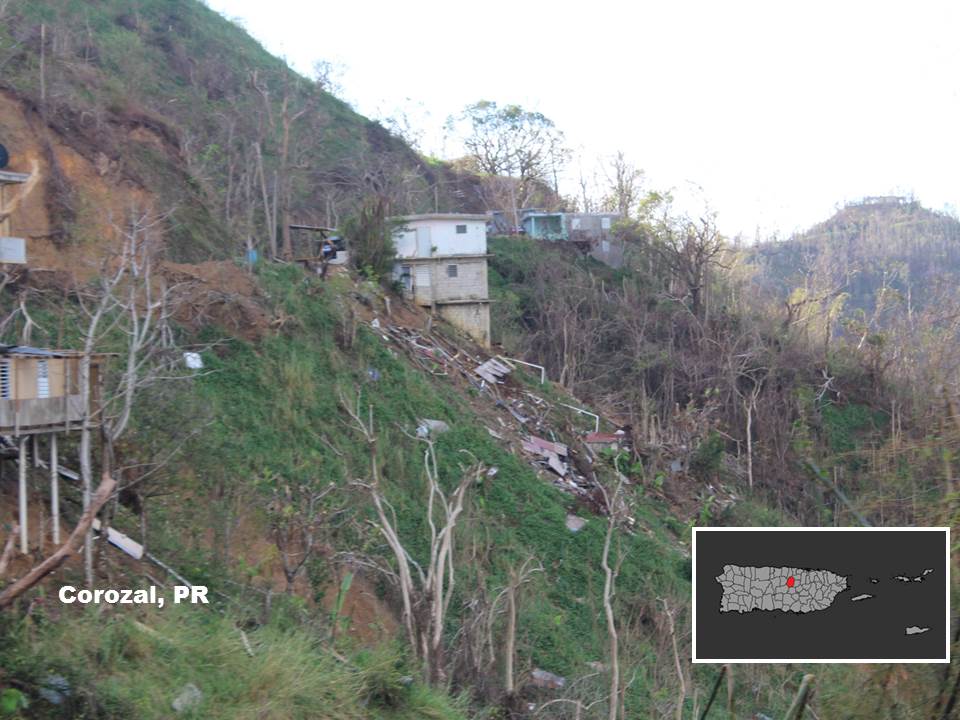
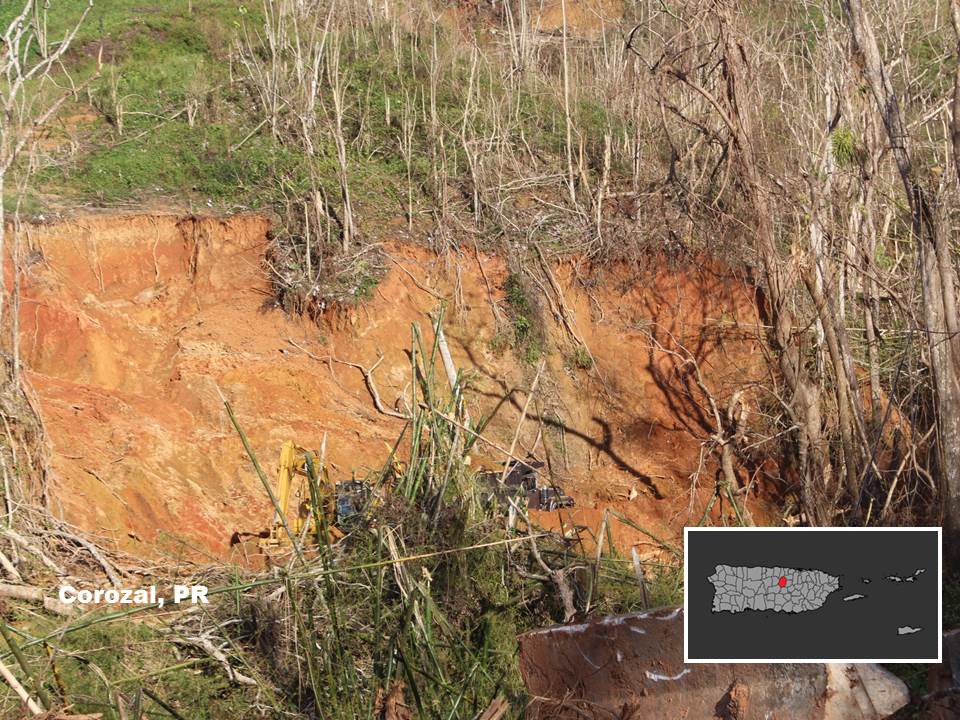
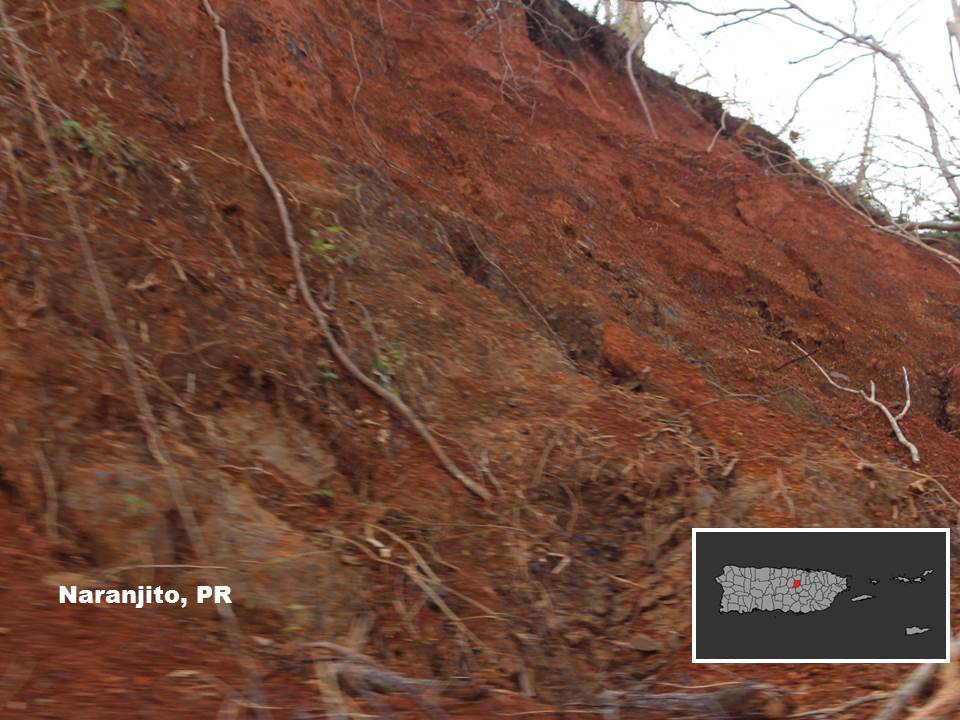
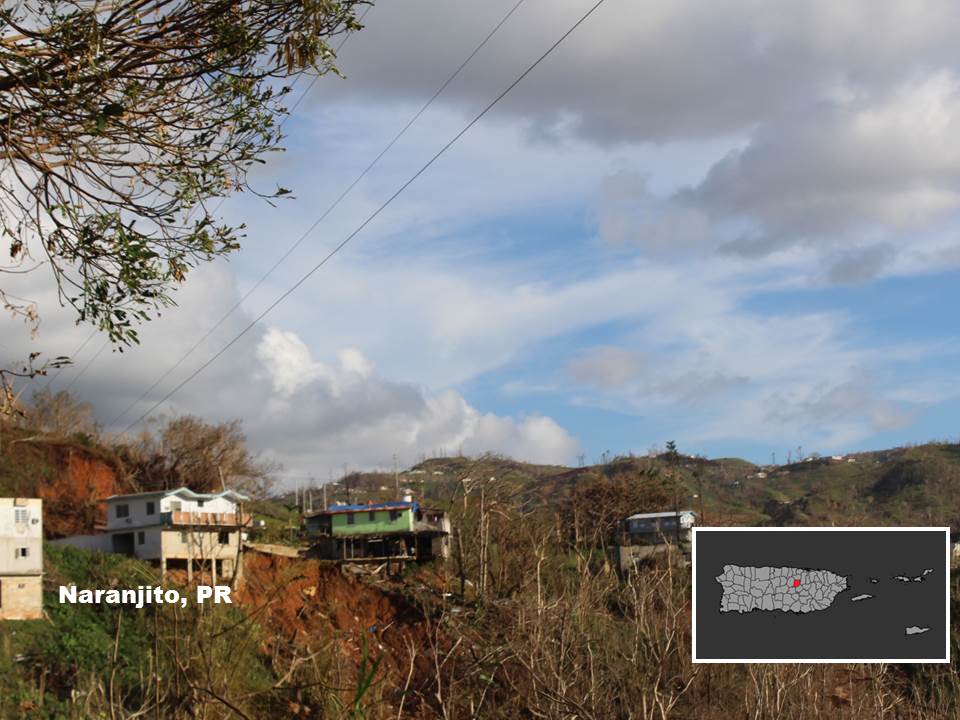
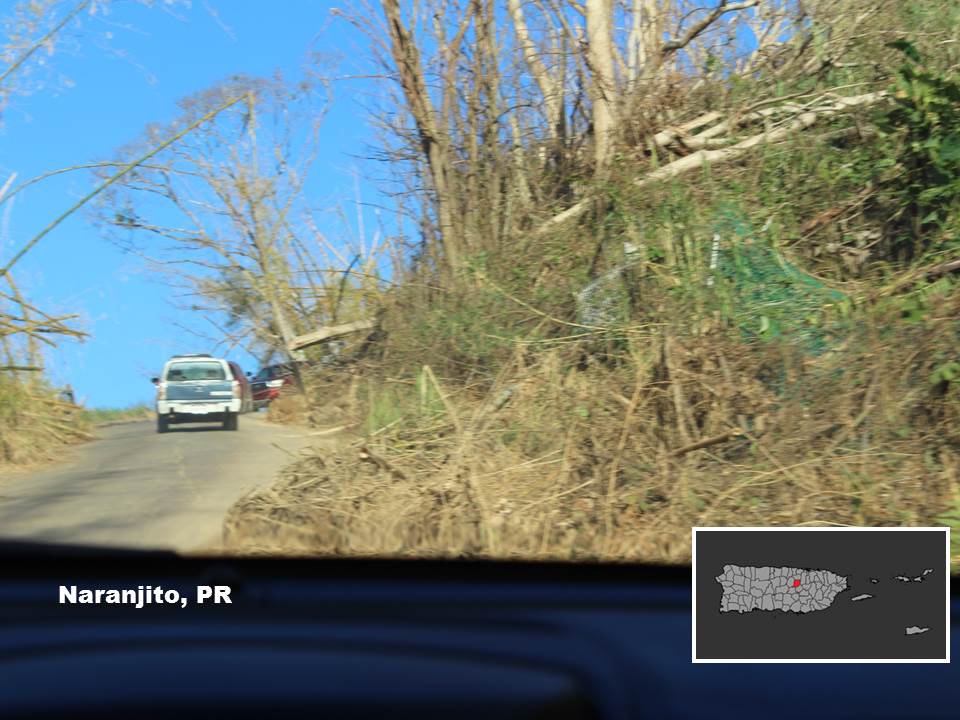
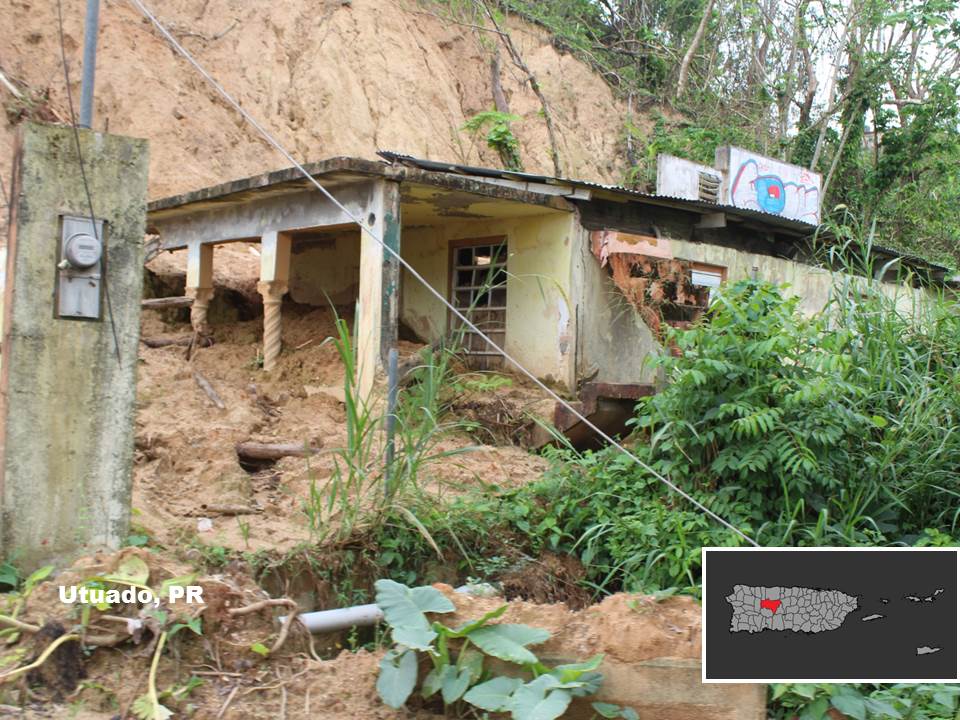
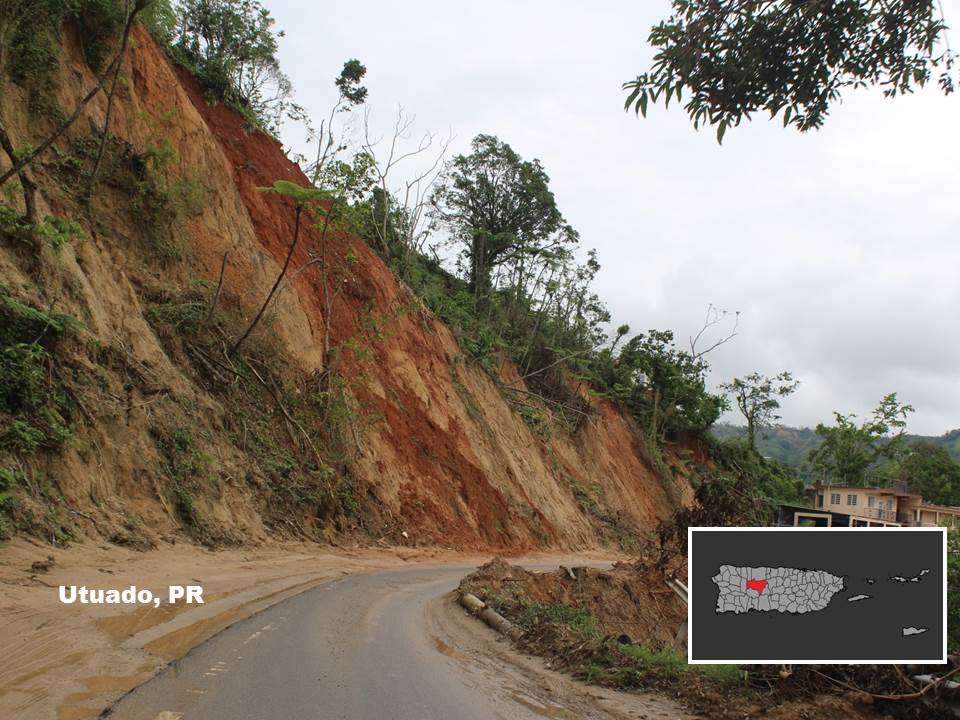
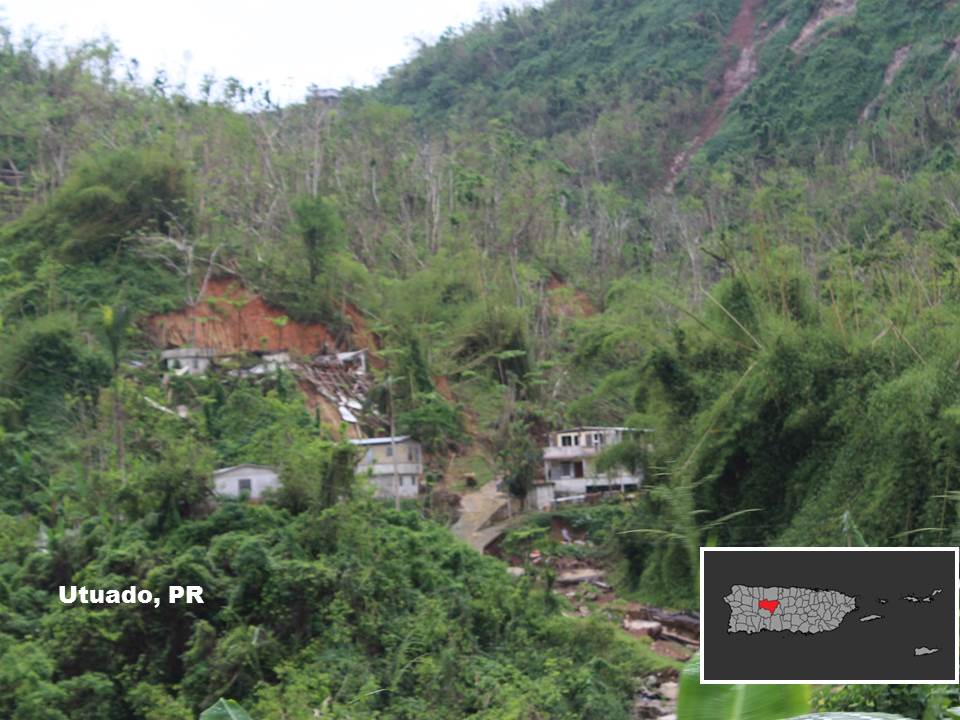
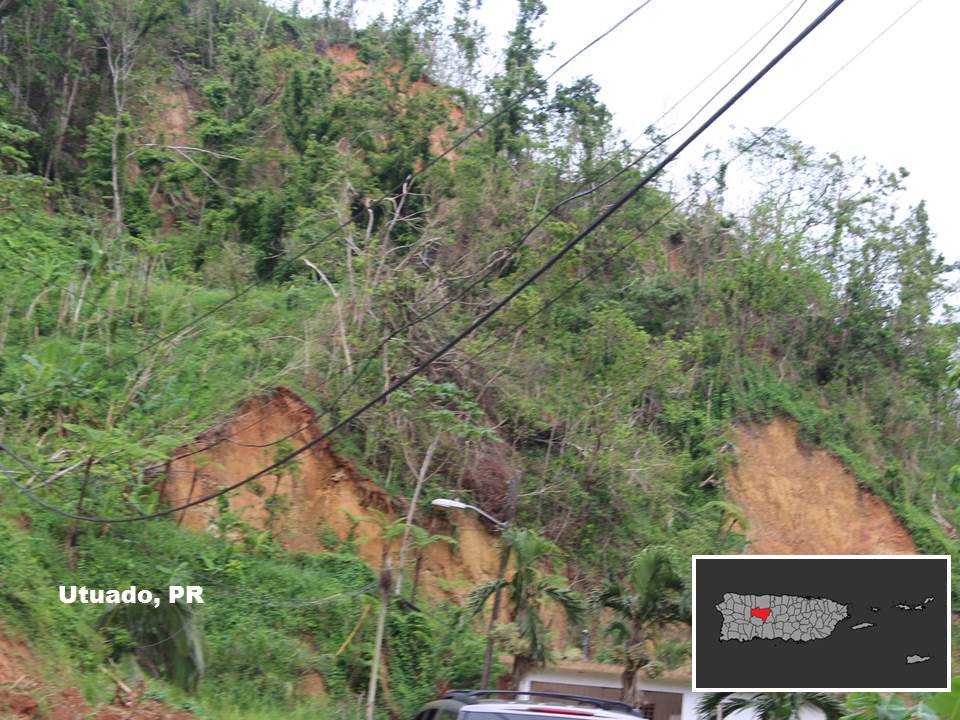
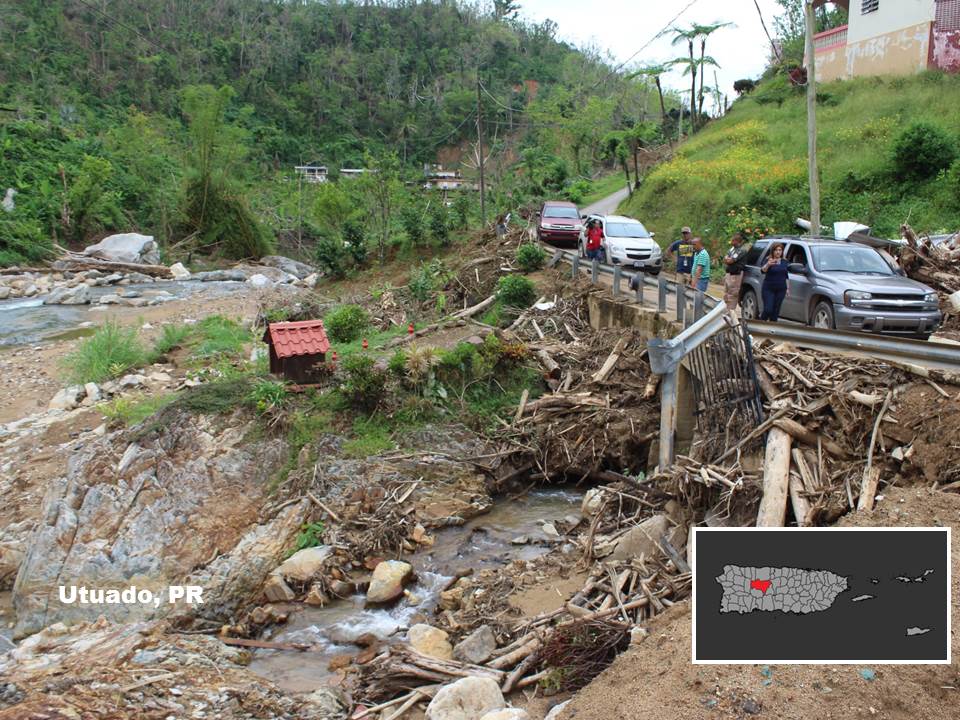
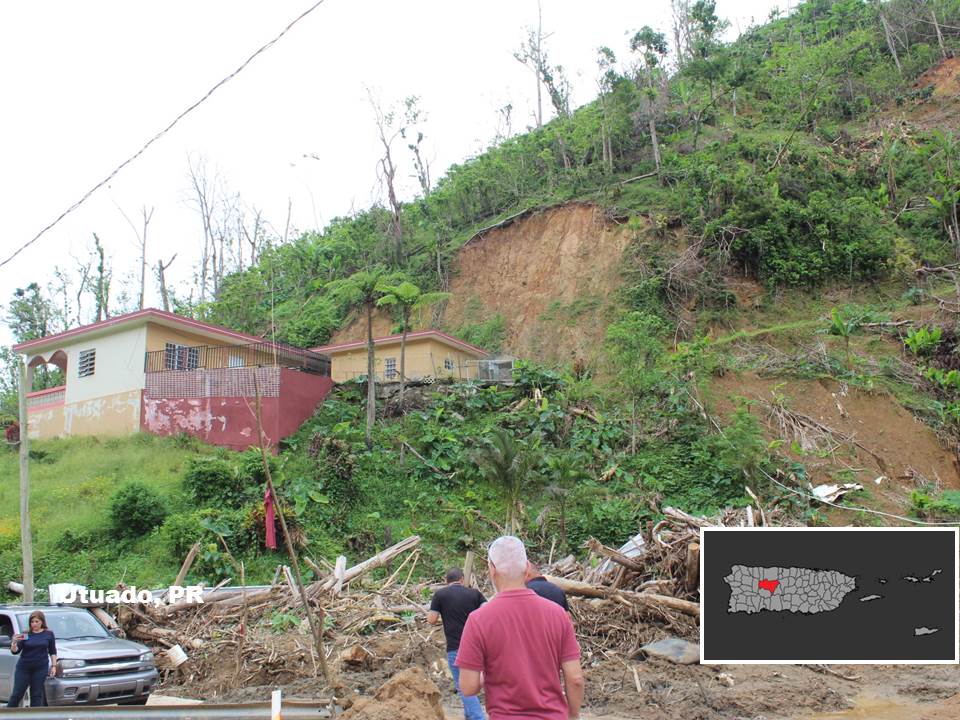
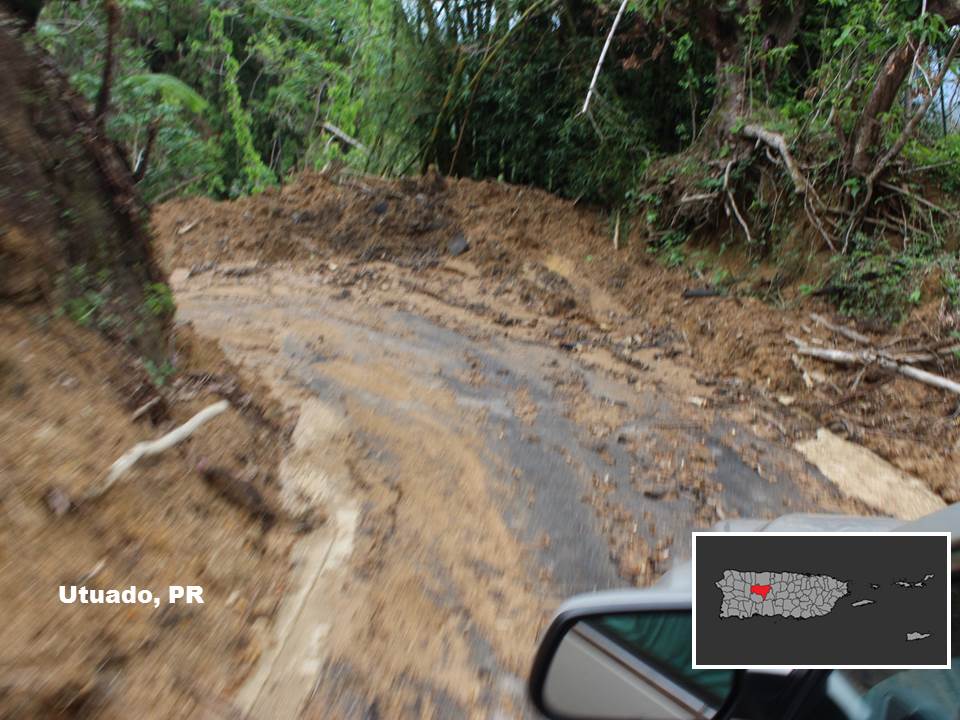
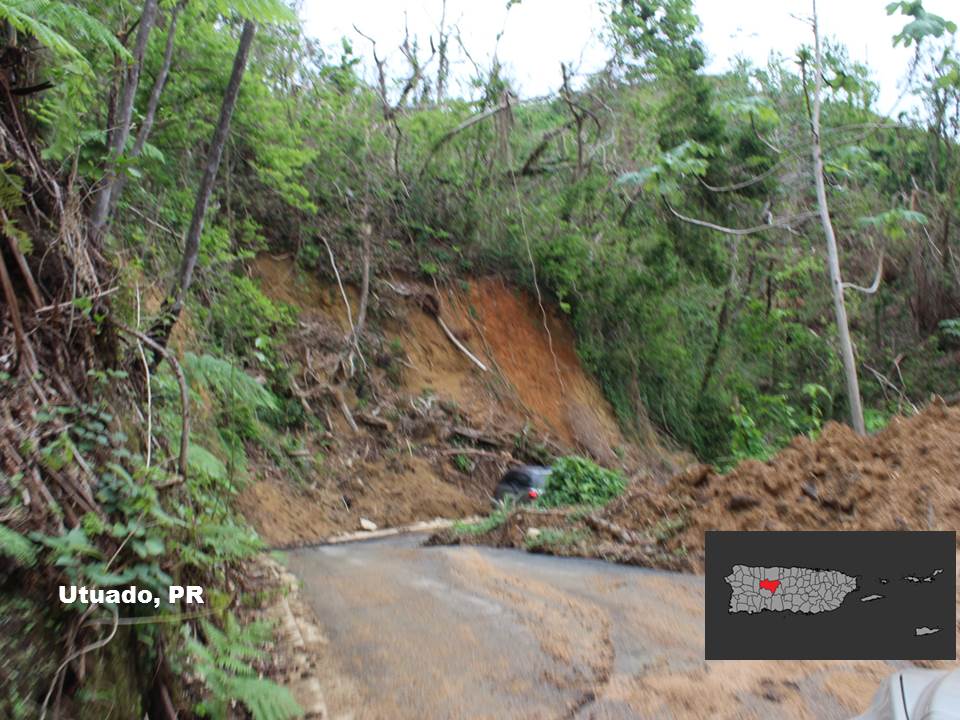
Landslides
|
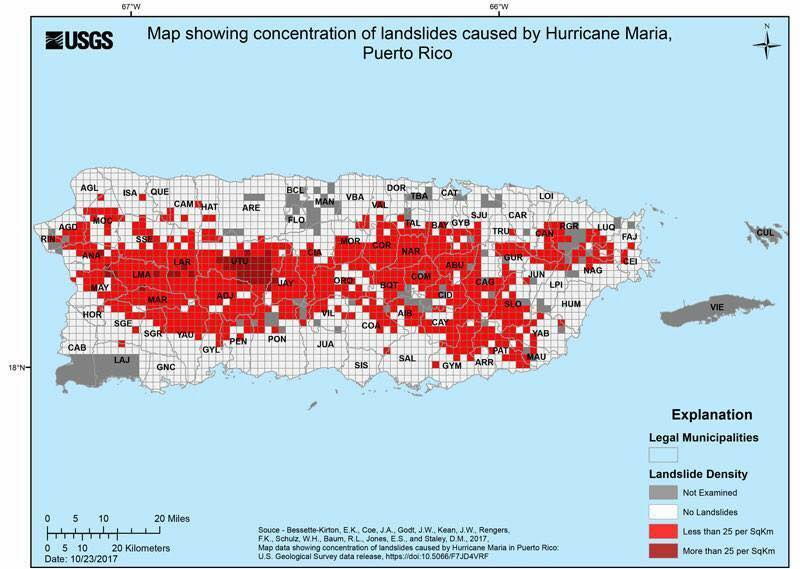
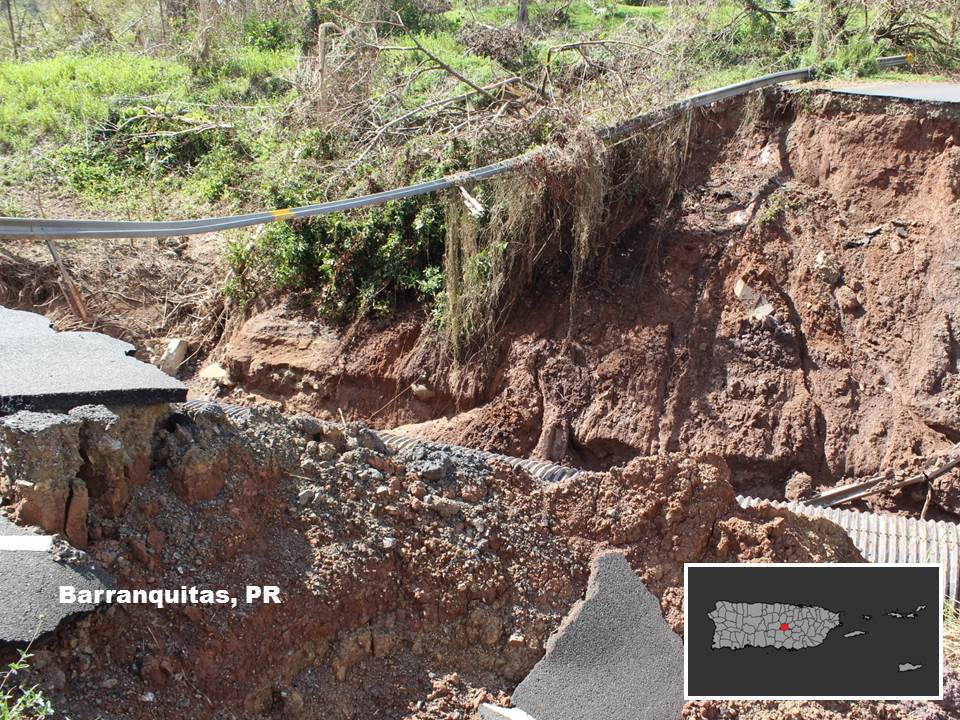
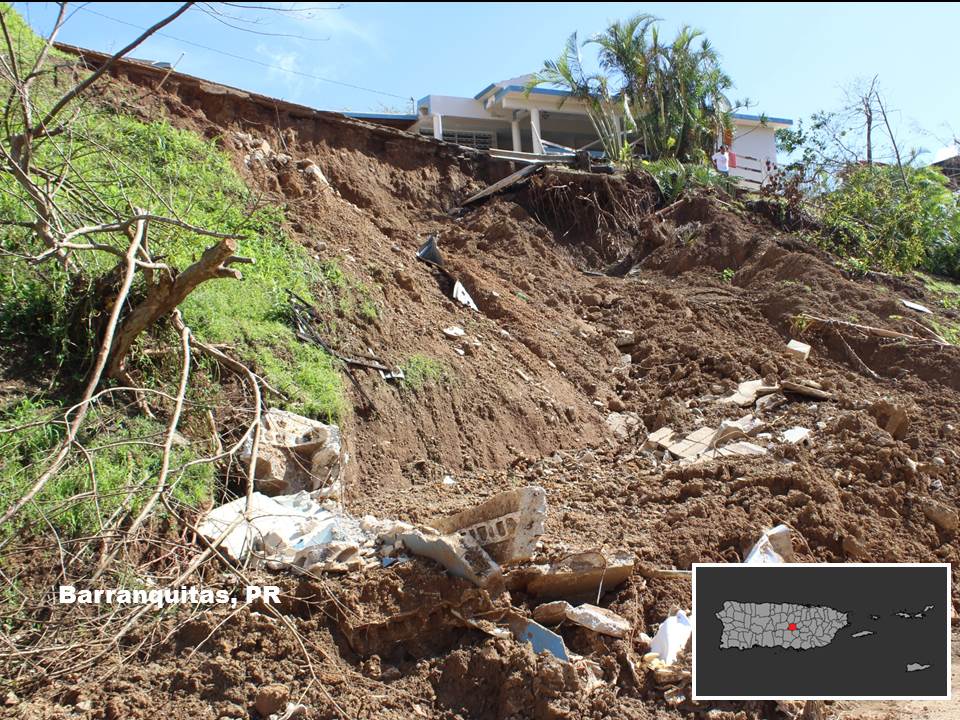
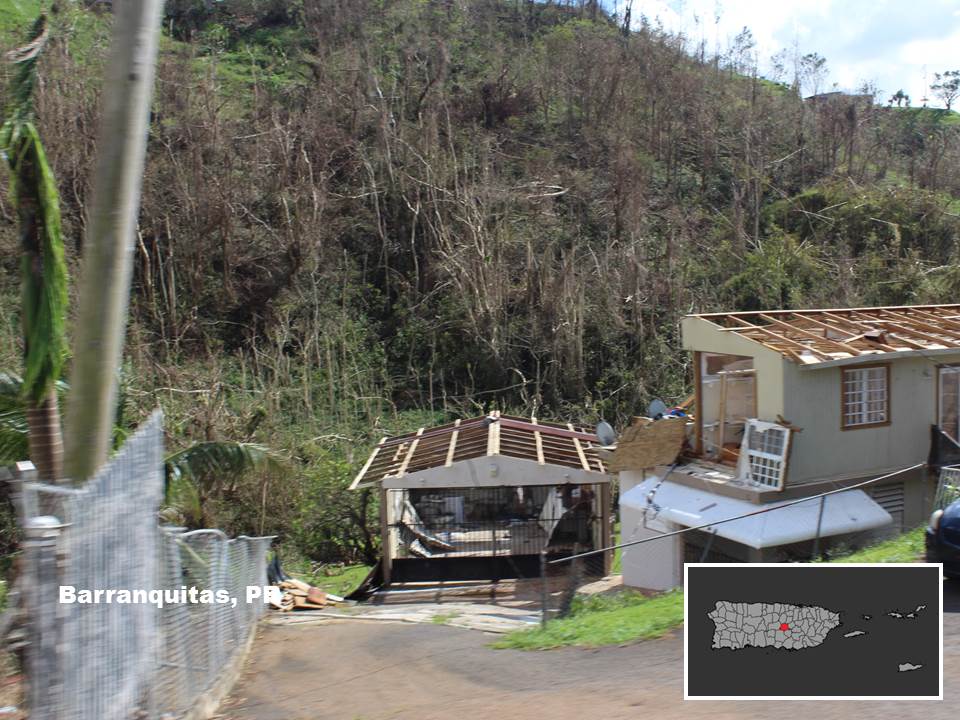
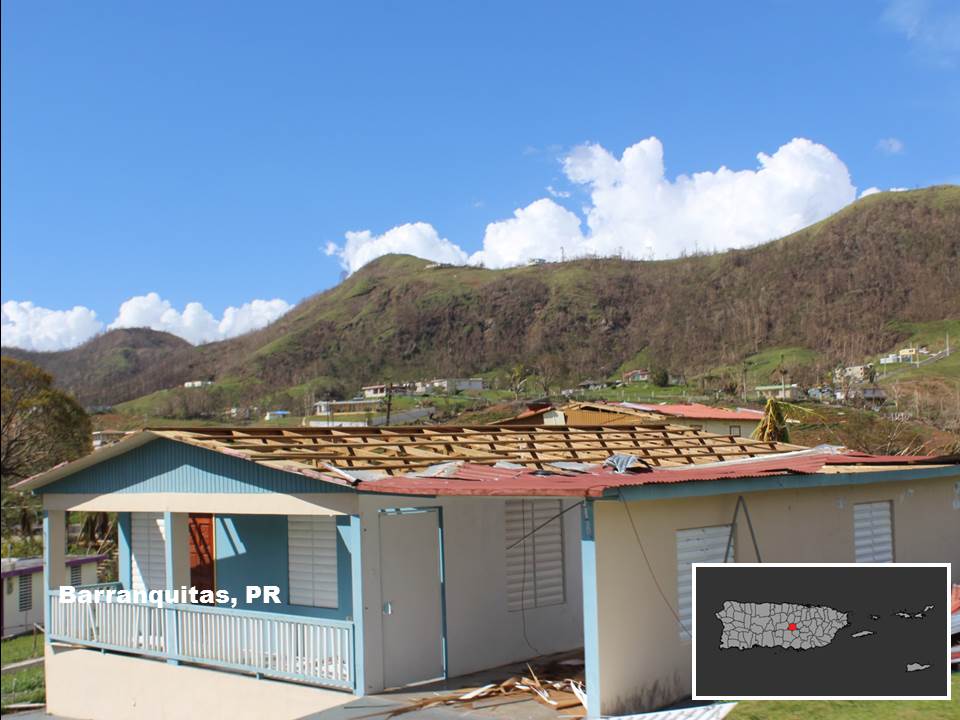
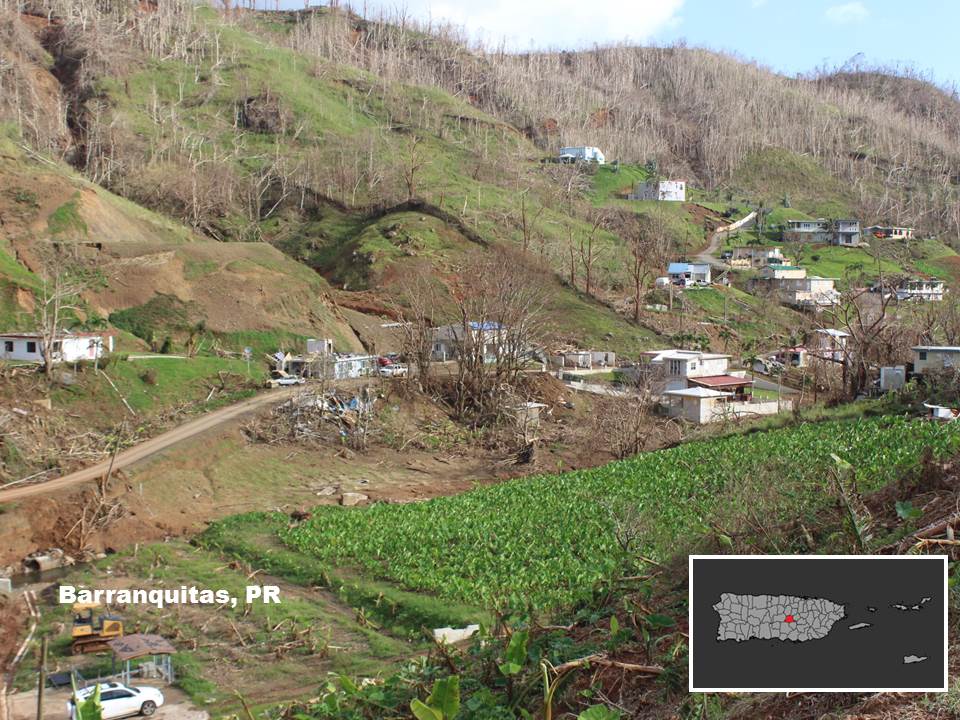
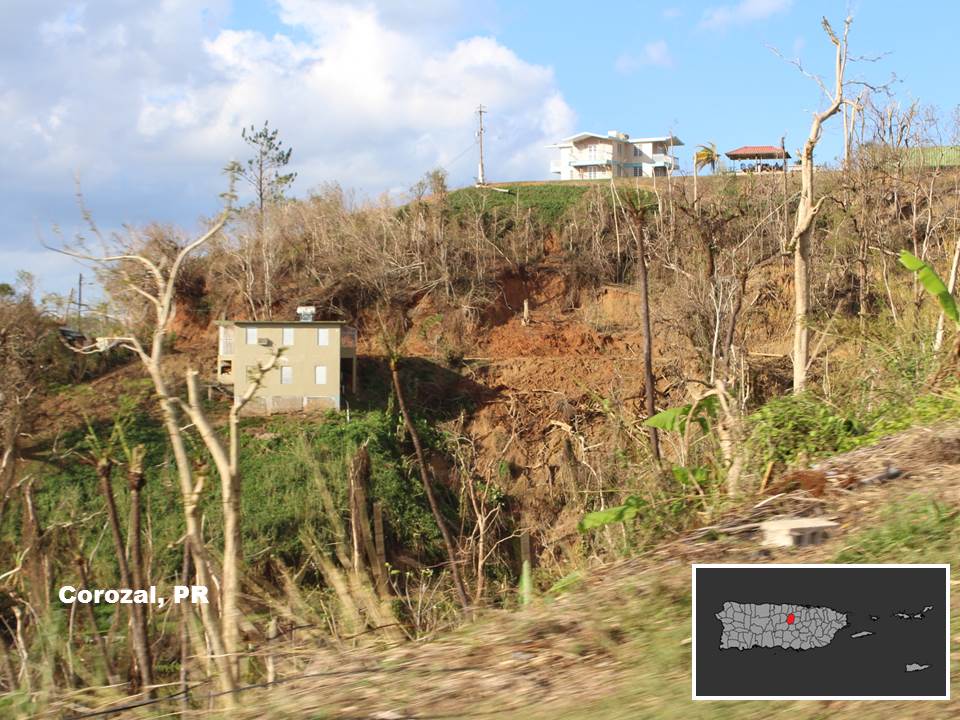
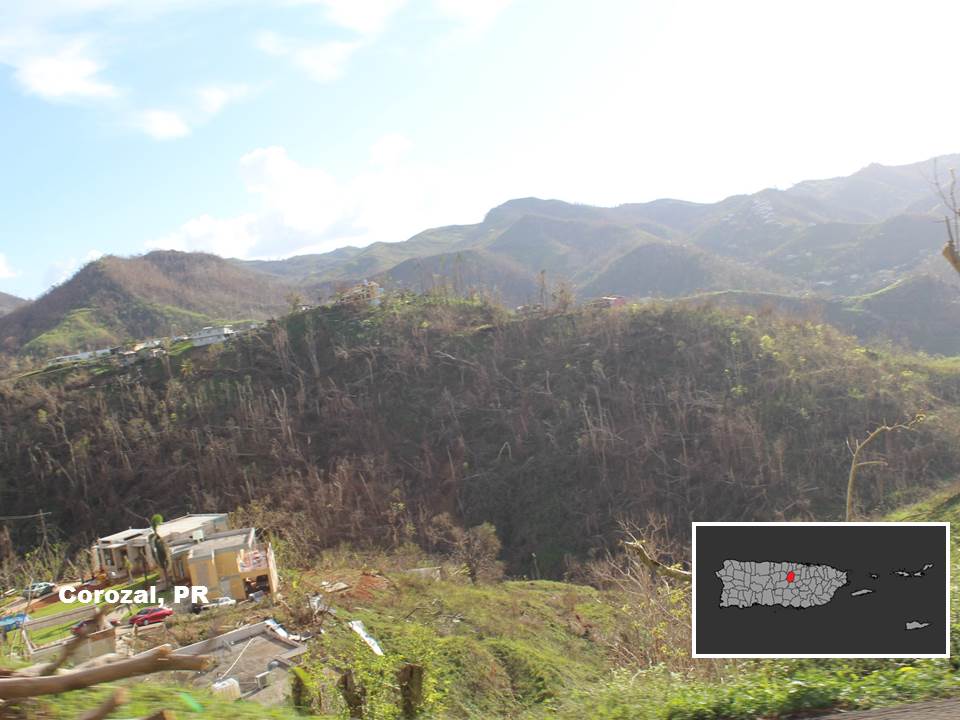
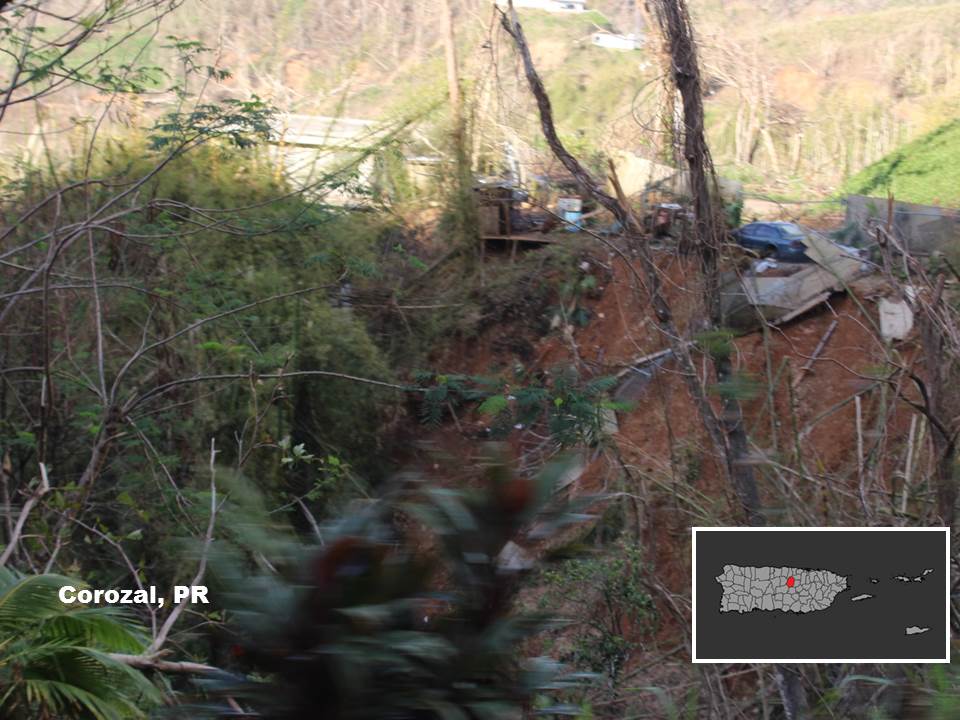
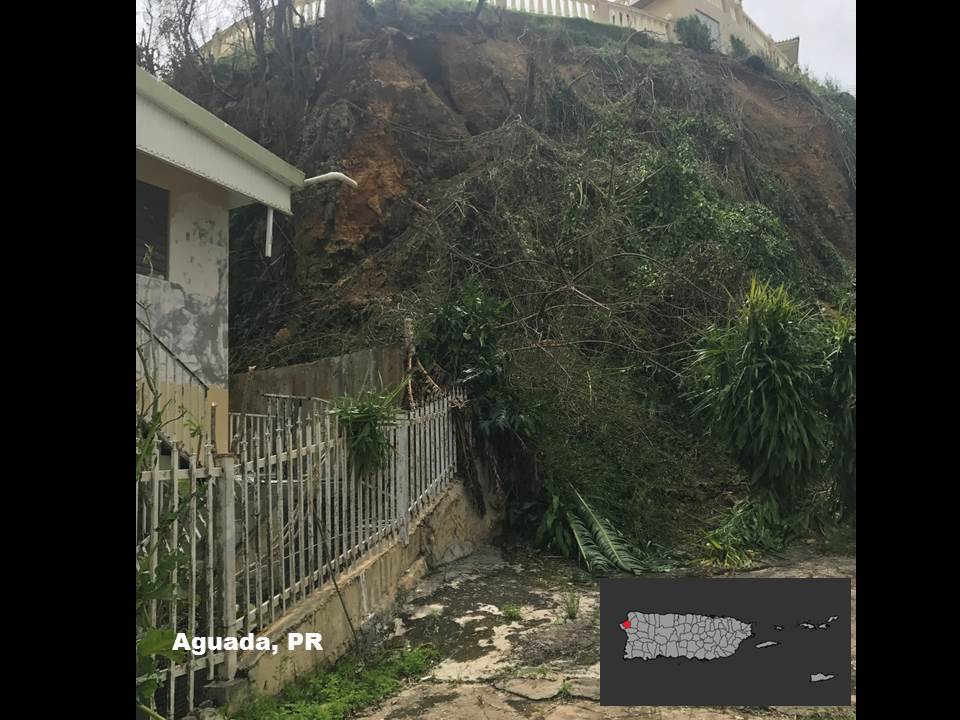
Figure 1: Concentration of landslides caused by Hurricane Maria. Source: U.S. Geological Survey.
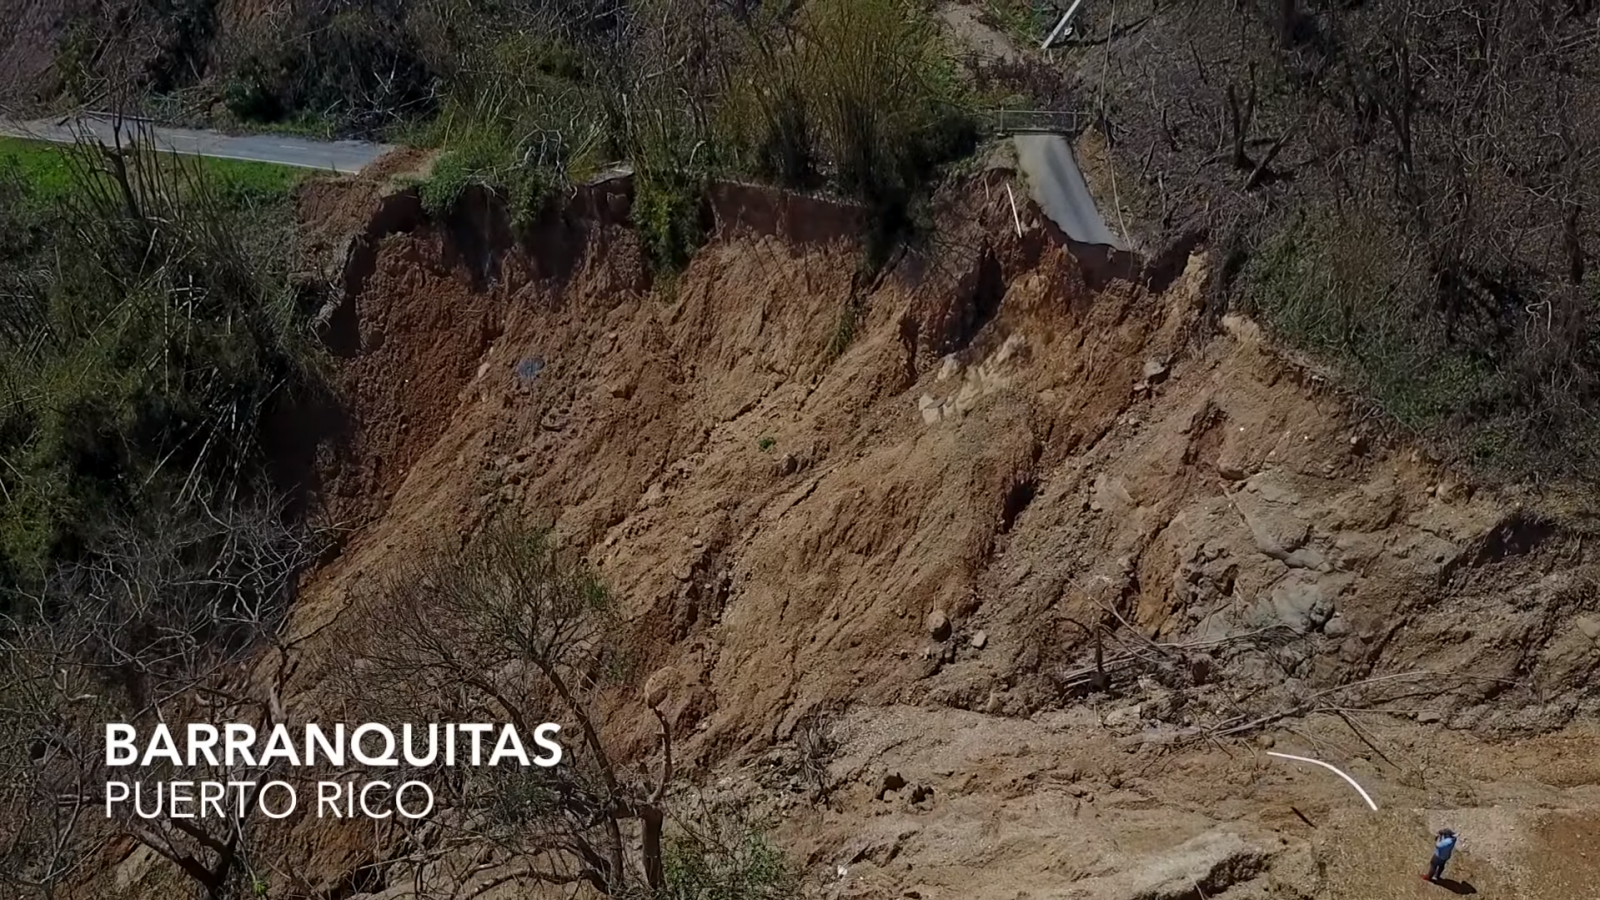
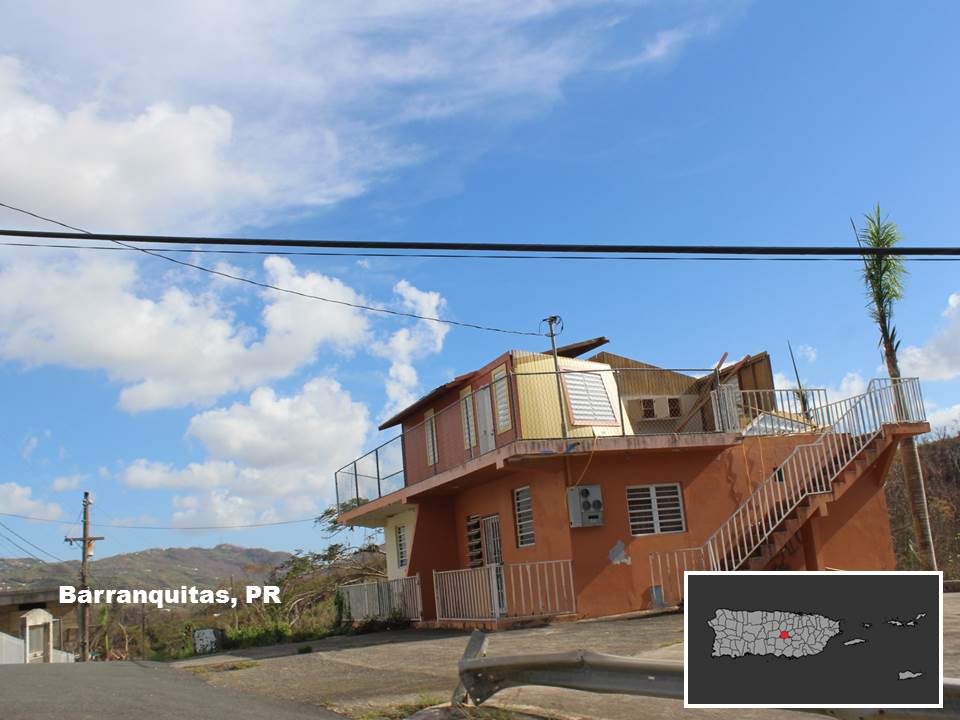
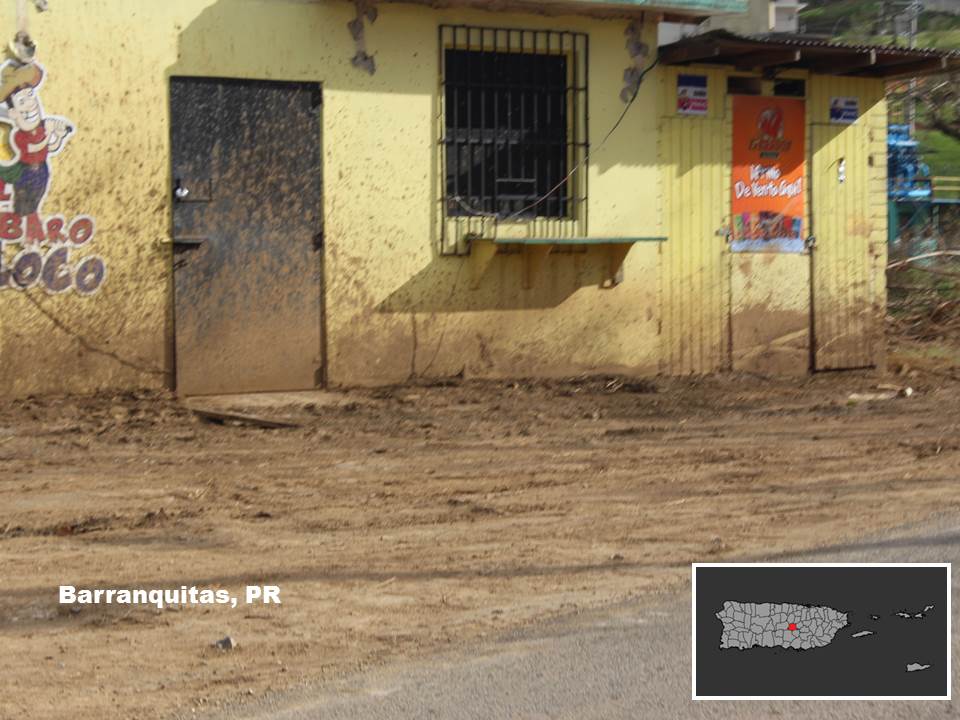
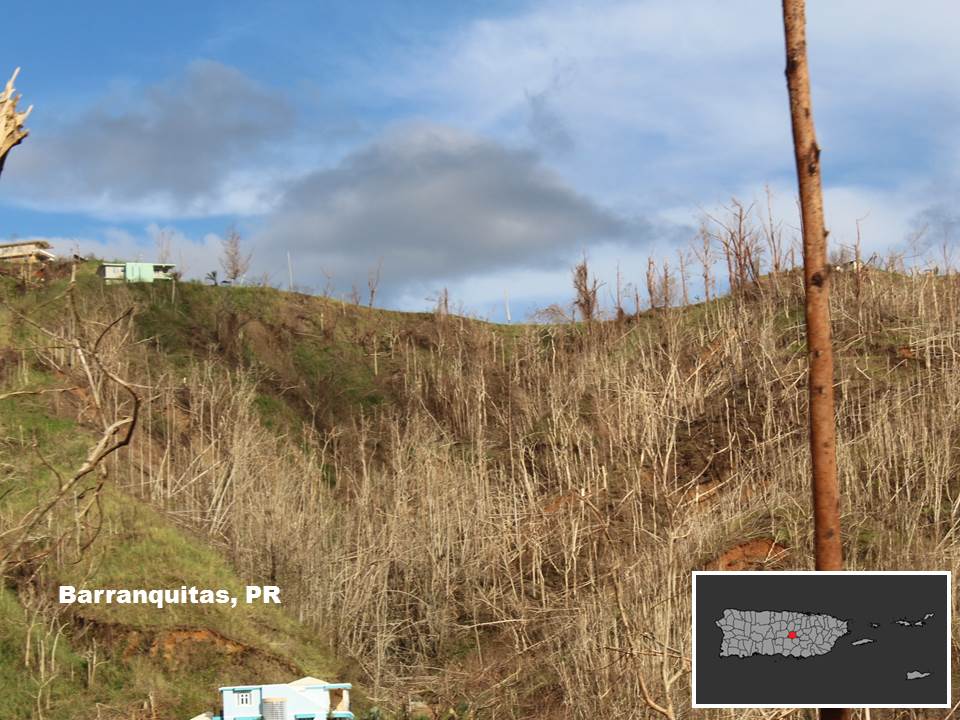
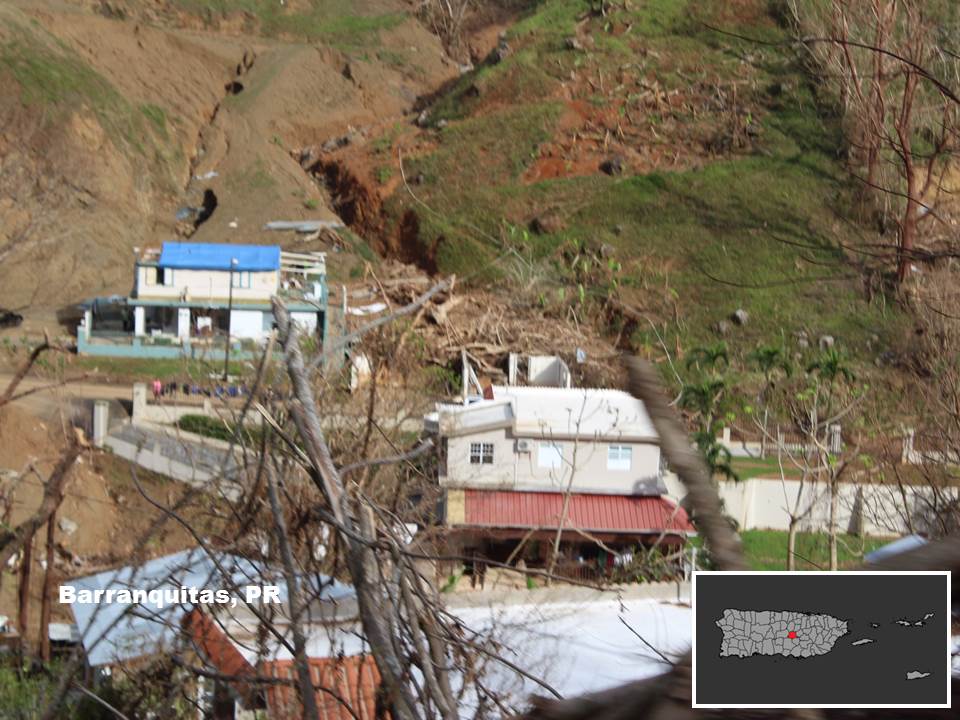
Figure 2: Significant landslide in Barranquitas Puerto Rico.
|
Winds
|
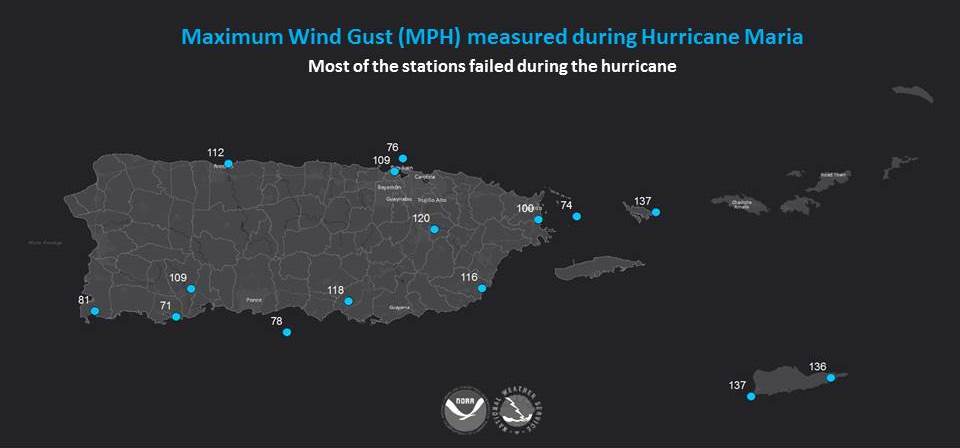
Figure 1: Maximum wind gust (MPH) measured by weather stations. Most if not all the stations failed during Hurricane Maria.
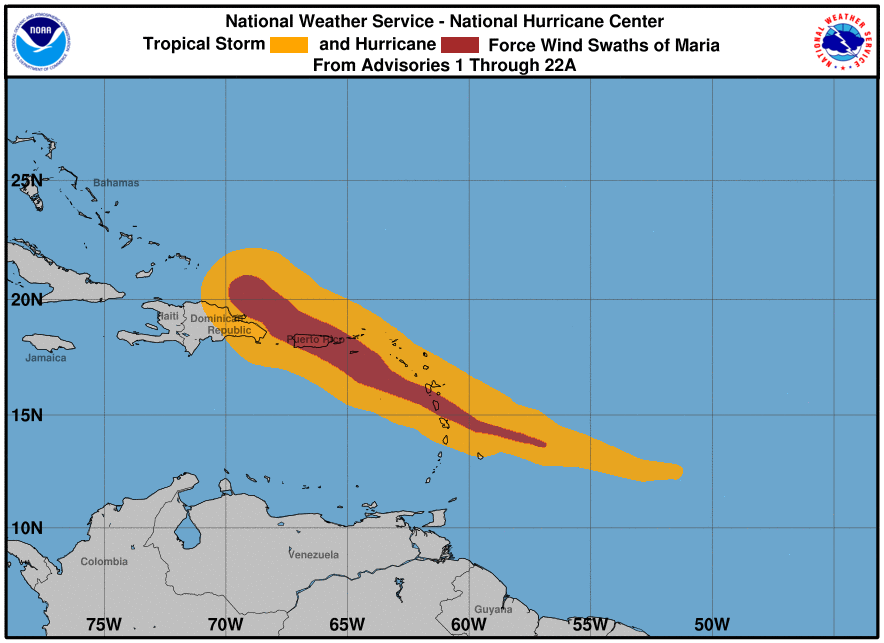
Figure 2: Wind swaths of Hurricane Maria as it moves across the Northeast Caribbean Region.
|
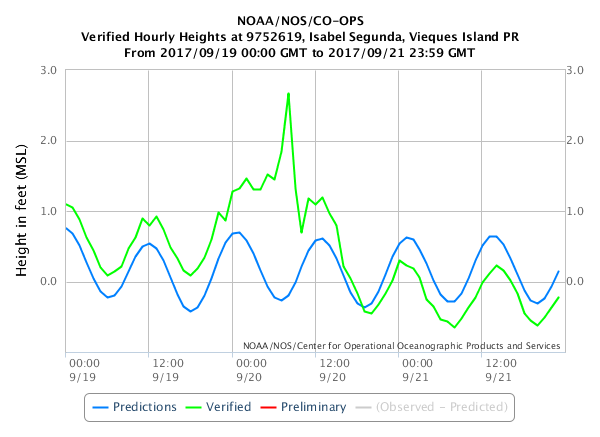
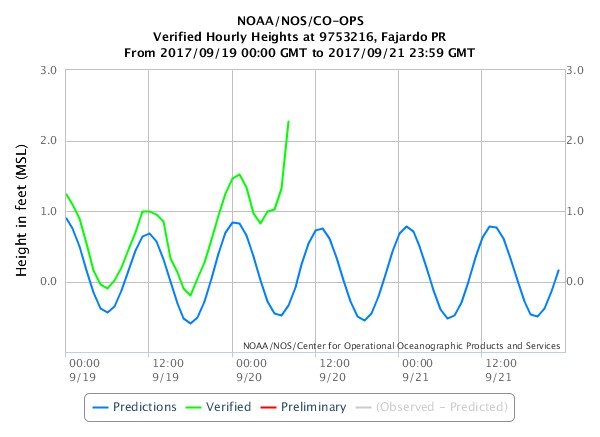
Wave Heights
|
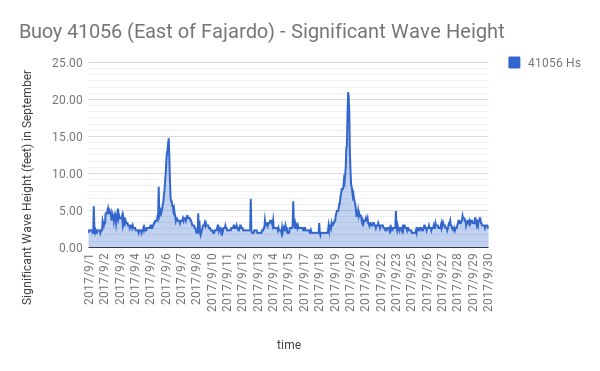
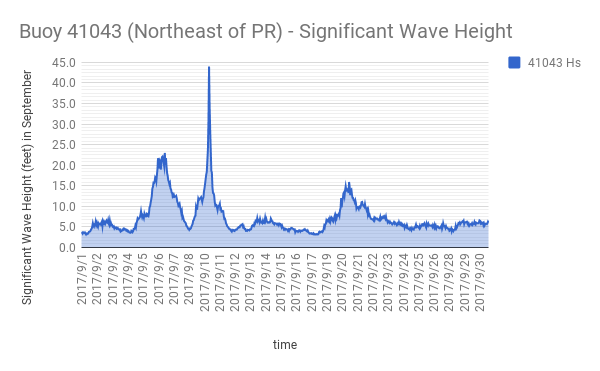
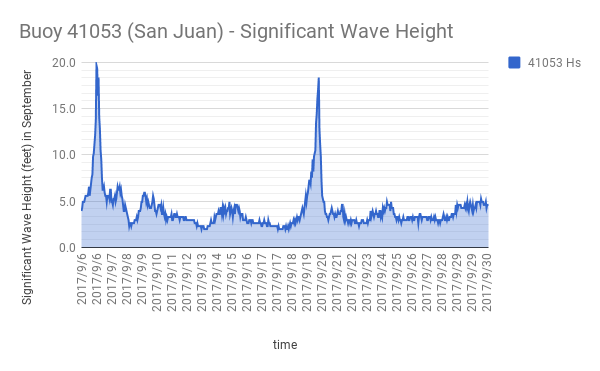
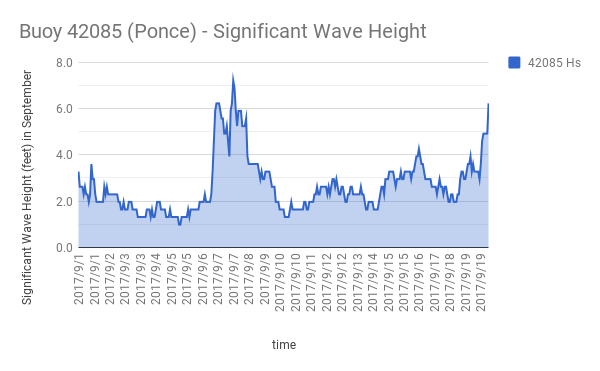
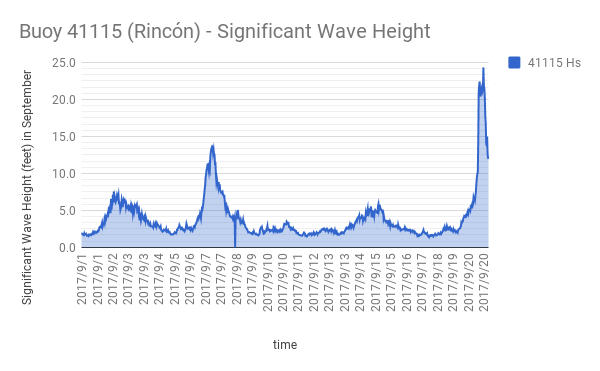
|
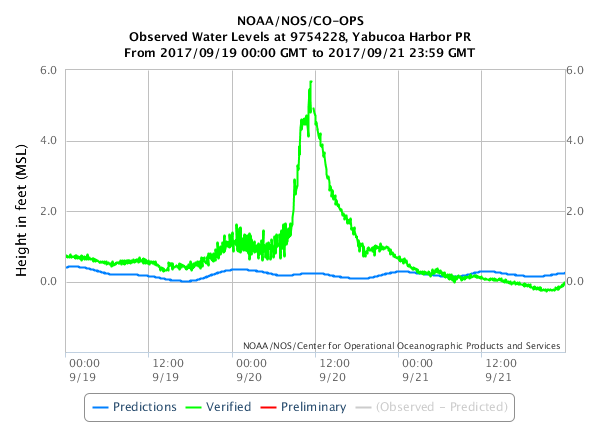
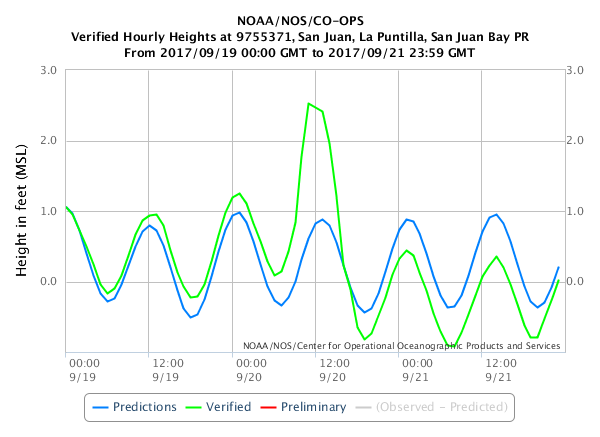
Storm Surge
|
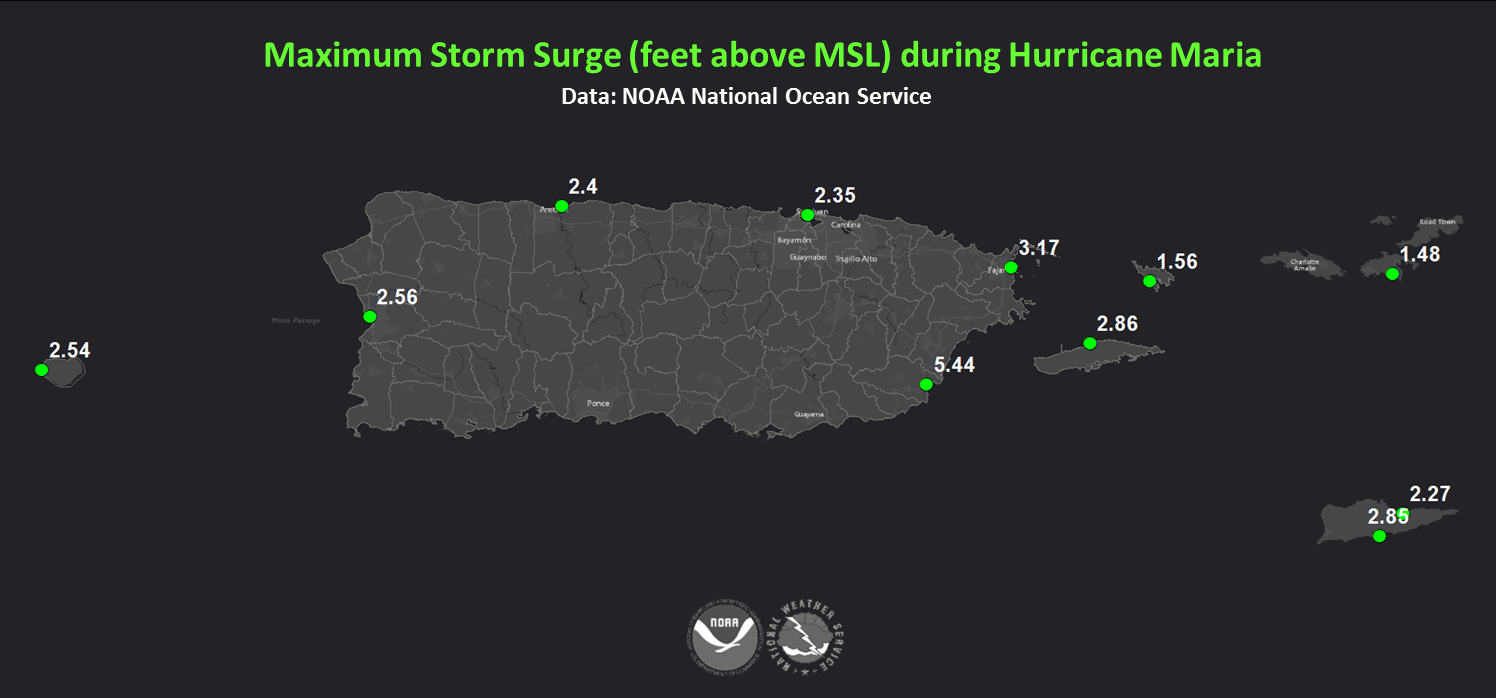
Figure 1: Maximum Storm Surge (feet) measured during Hurricane Maria.
|
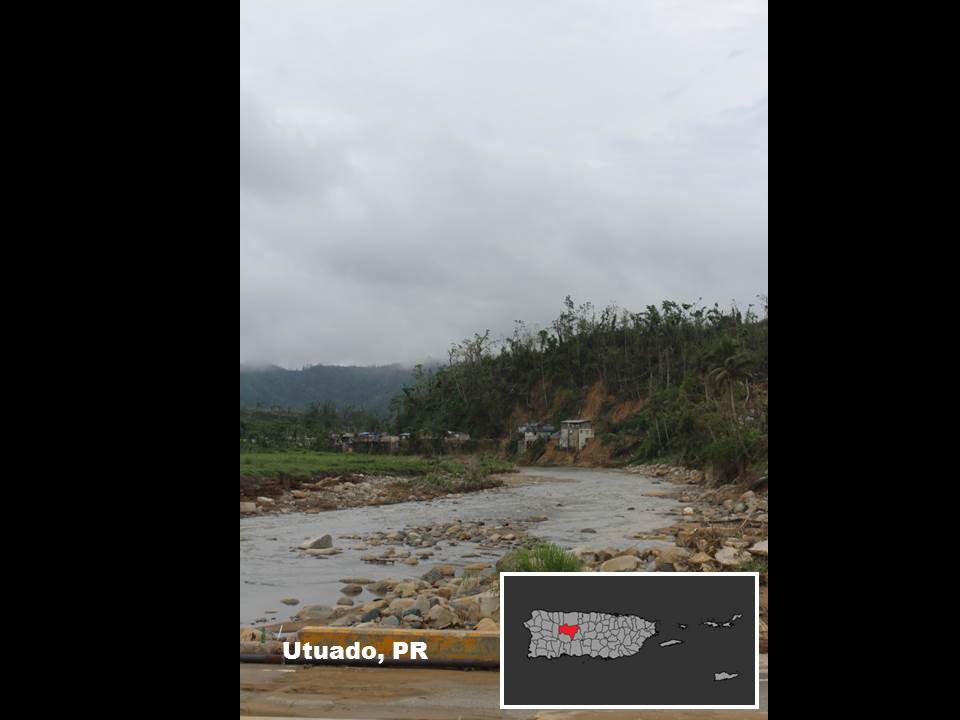
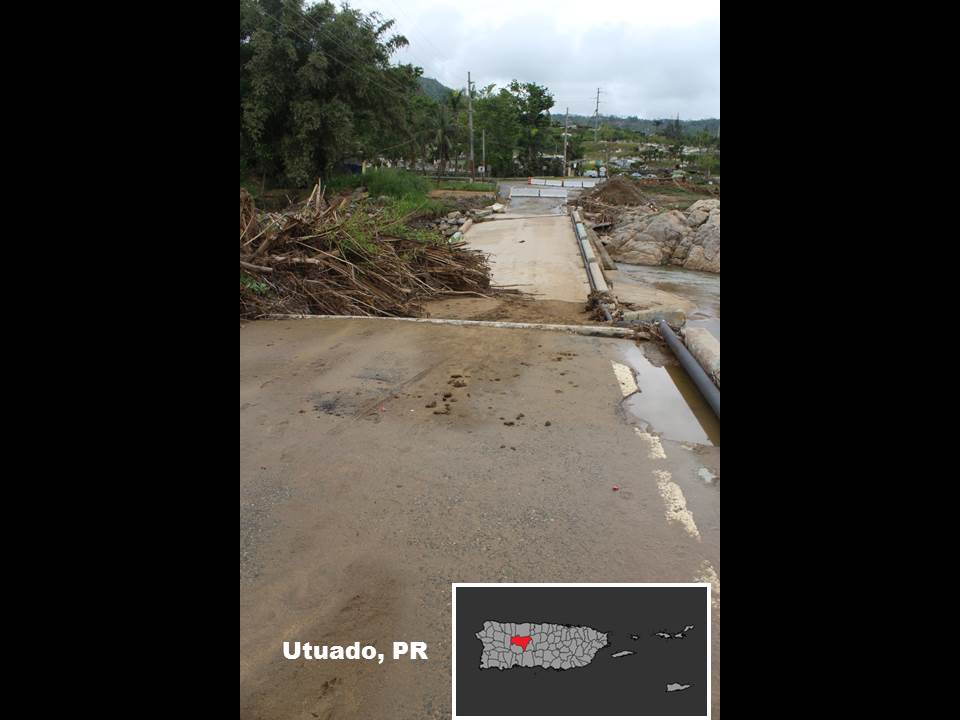
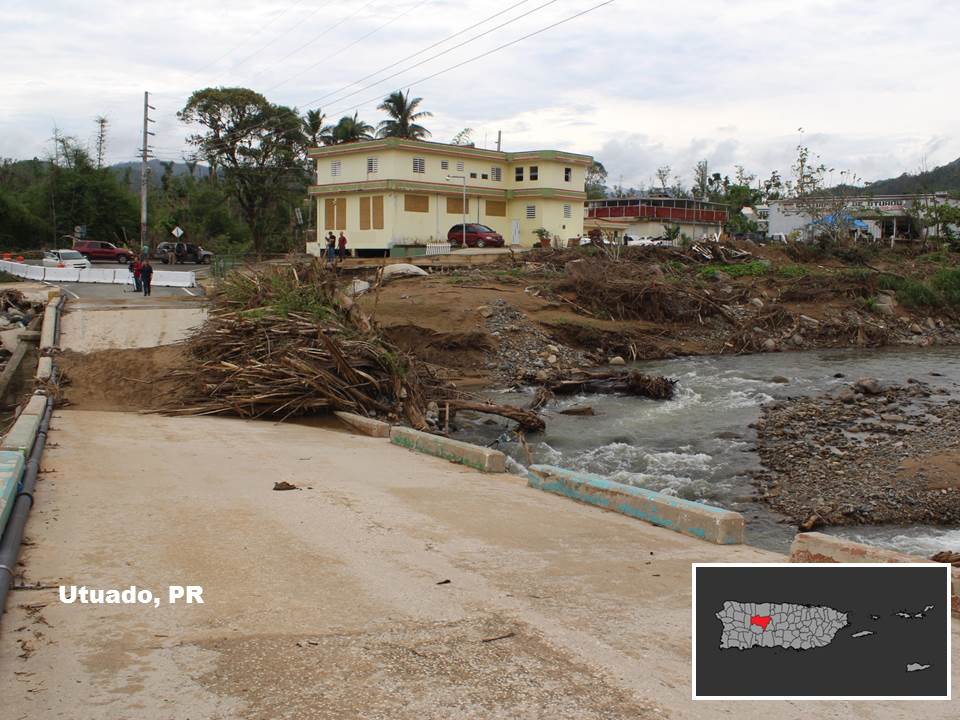
Rivers
|
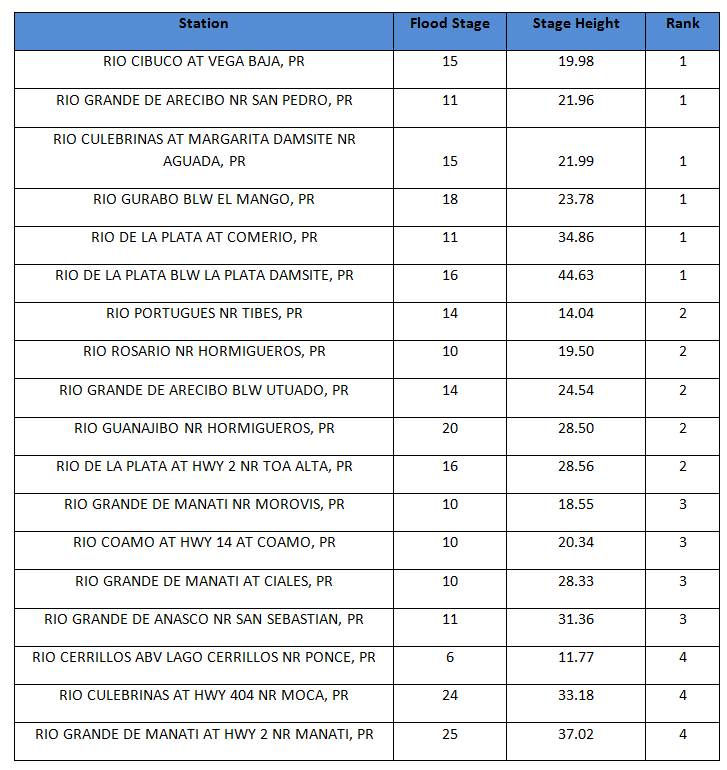
|
Tornadoes
|
|
From: Simon Brewer (meteorologist and storm chaser) Two tornadoes appeared to have passed very close to the Yabucoa Post Office at approximately 7:18 am AST. The tornadoes were relatively narrow visually (100 meters or less in diameter). They appeared to be moving very quickly from south to north. These tornadoes were observed as the east side of the inner eyewall began affecting a few blocks east of the Yabucoa Post Office. A third tornado was observed at approximately 11:26am AST over open fields east of Highway 3 and north of Highway 901 north of "Ralphs Food Warehouse". This tornado was moving very quickly from SSE to NNW. |
|
Warnings
|
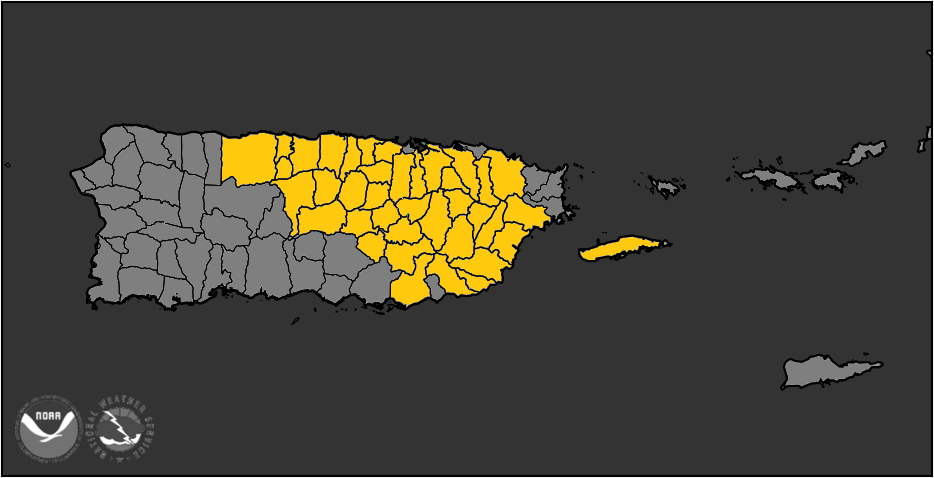
Figure 1: Municipalities where Extreme Wind Warnings were issued as the eyewall of Hurricane Maria moved over Puerto Rico with maximum sustained winds in excess of 115 mph.
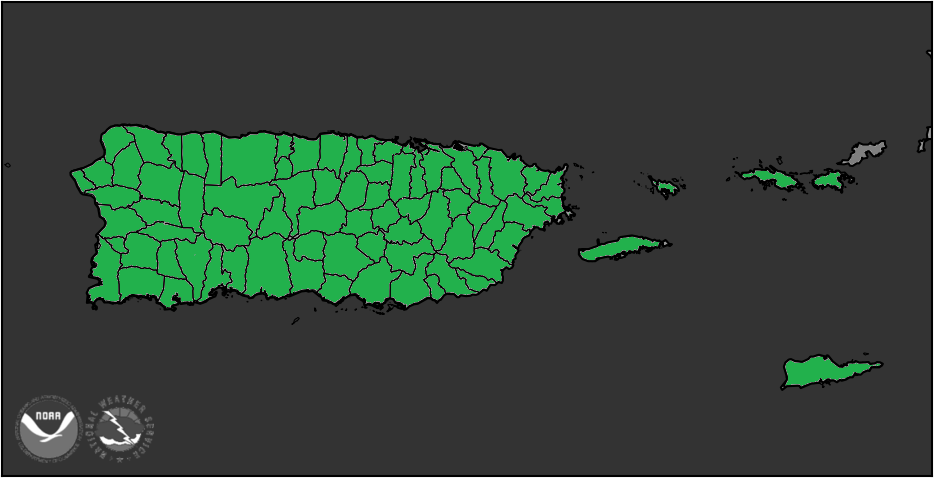
Figure 2: All municipalities in Puerto Rico as well as the U.S. Virgin Islands were in a Flash Flood Warning sometime during the impact of Major Hurricane Maria.
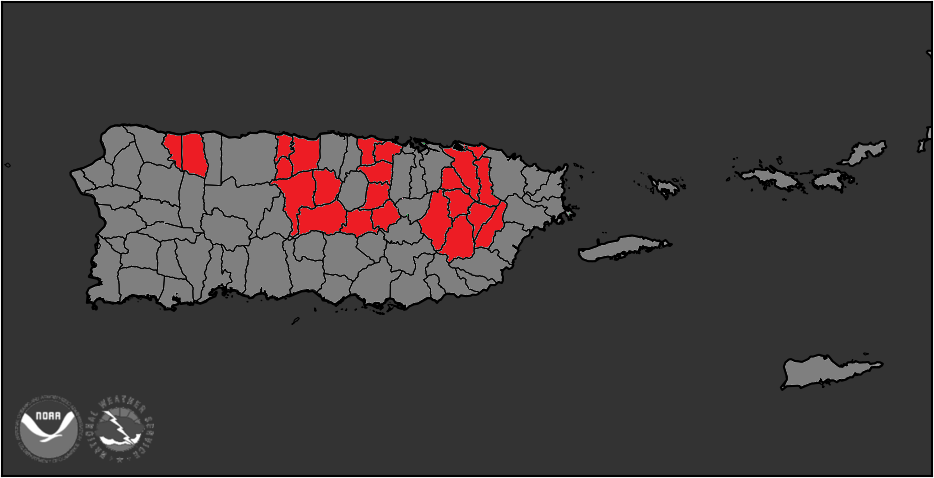
Figure 3: Municipalities where Emergency Flash Flood Warnings were issued on September 20. Historical flooding was reported across the Rio Grande de Loiza Basin, Rio La Plata Basin and Rio Grande de Manati basin during Hurricane Maria.
|
Damages
|
|
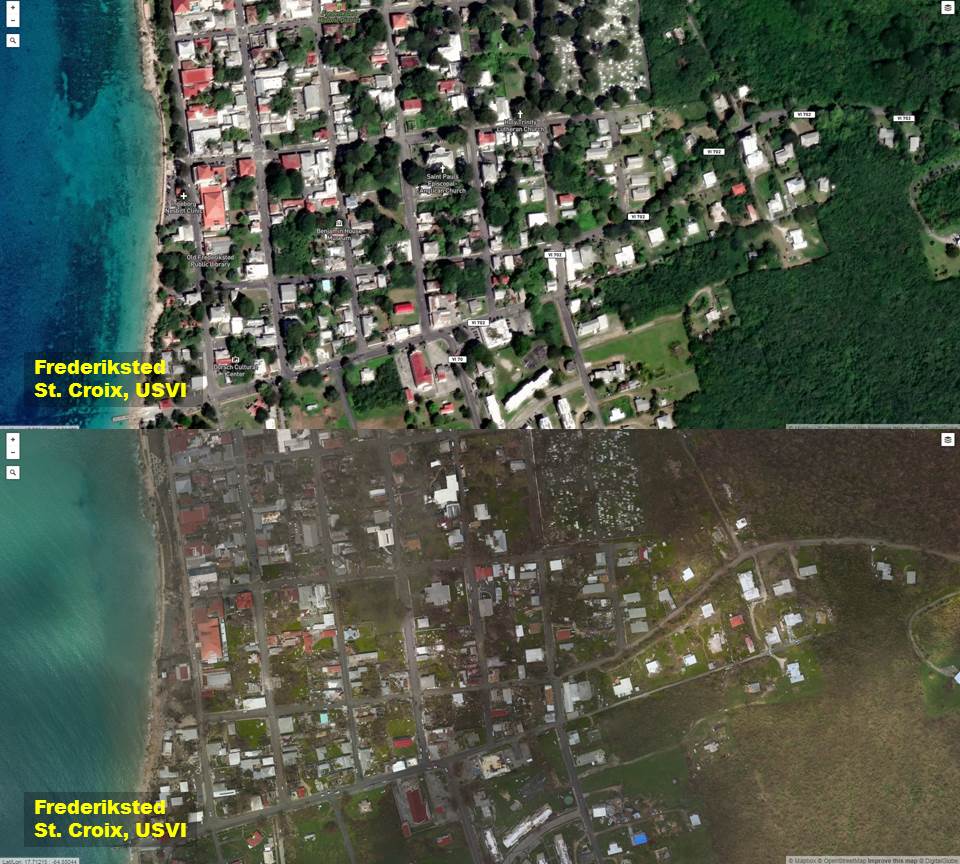
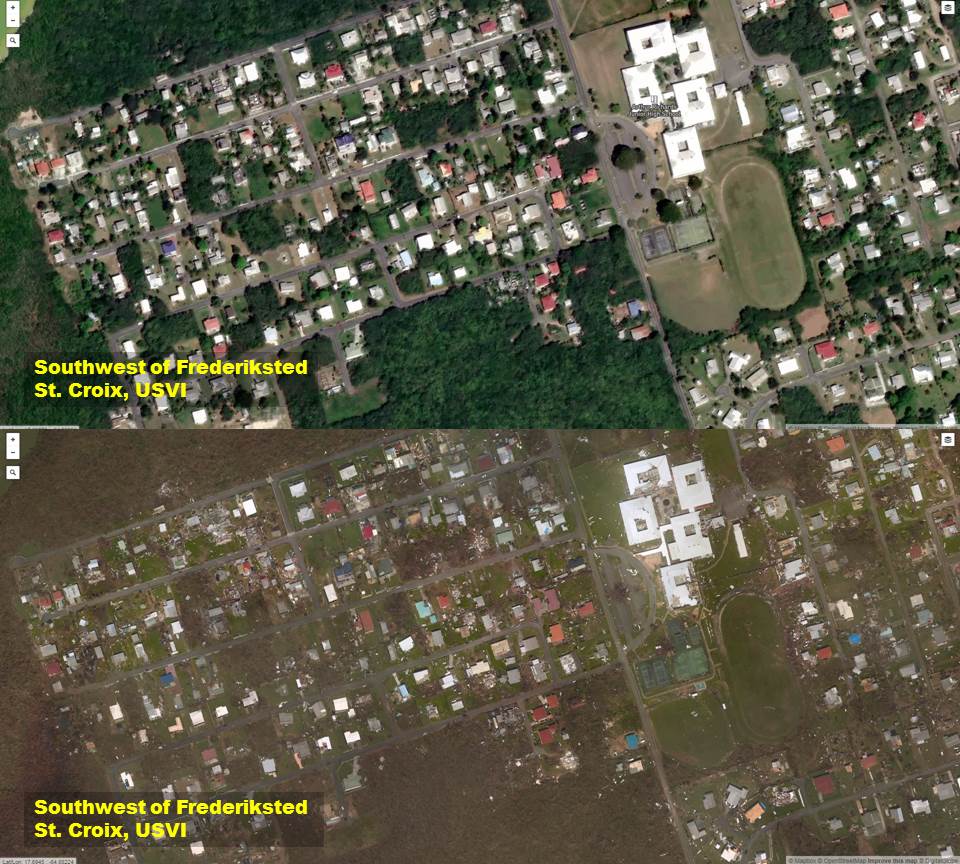
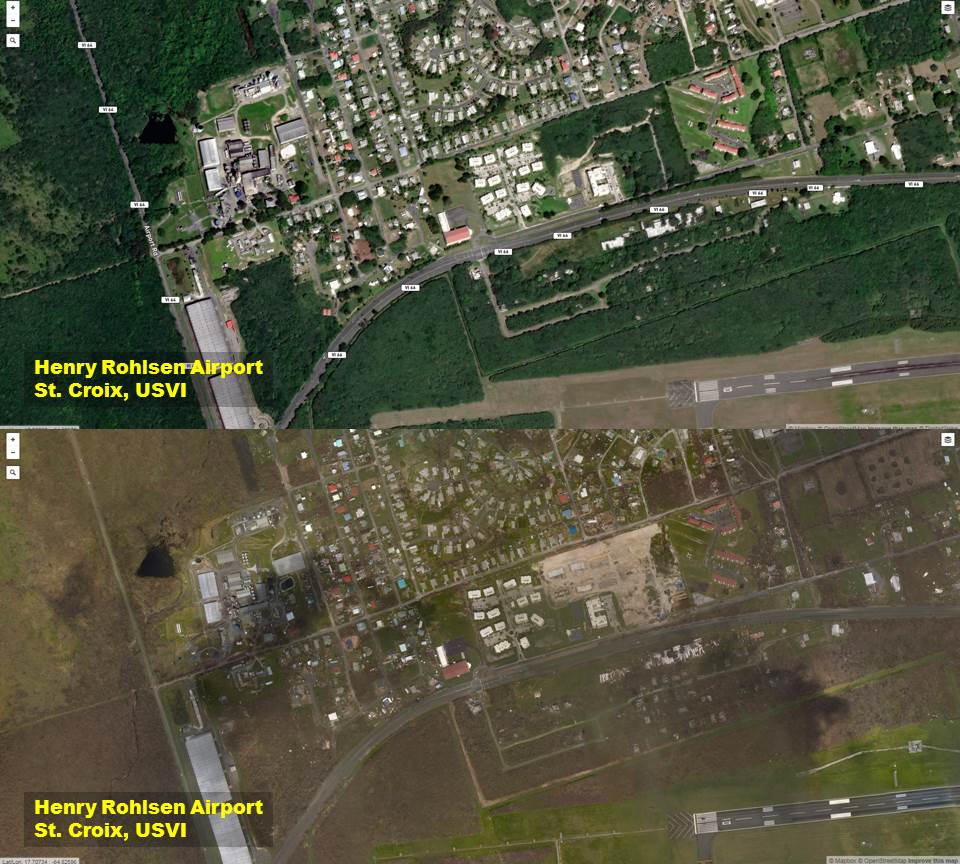
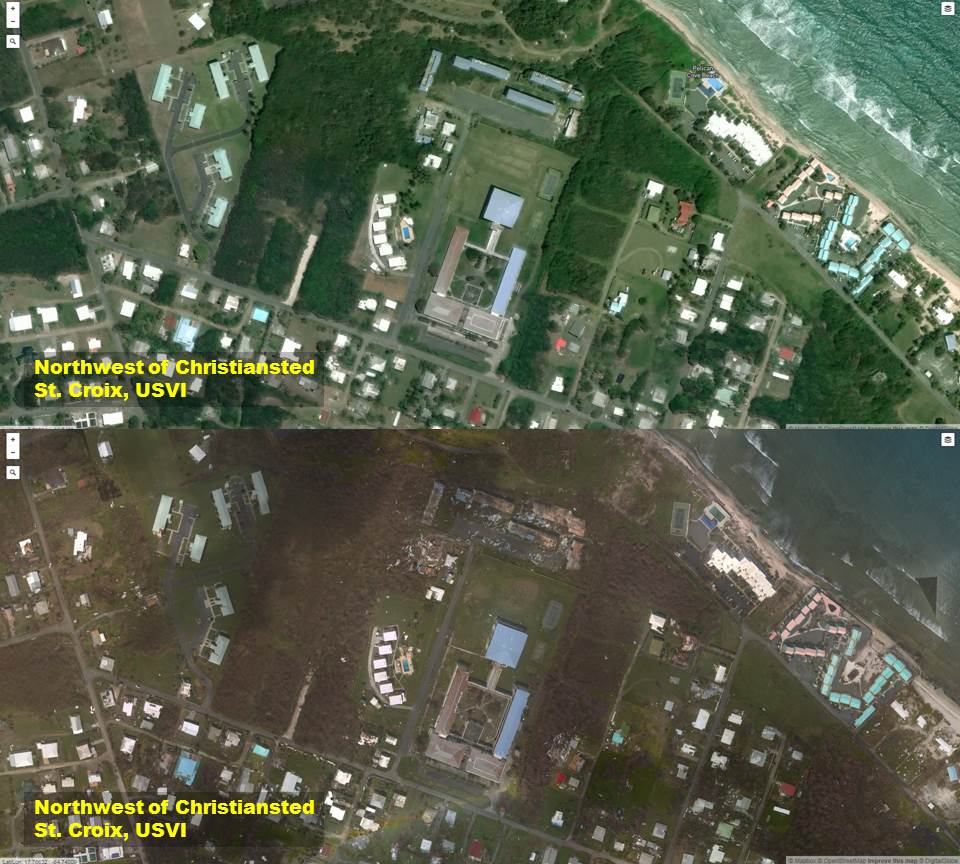
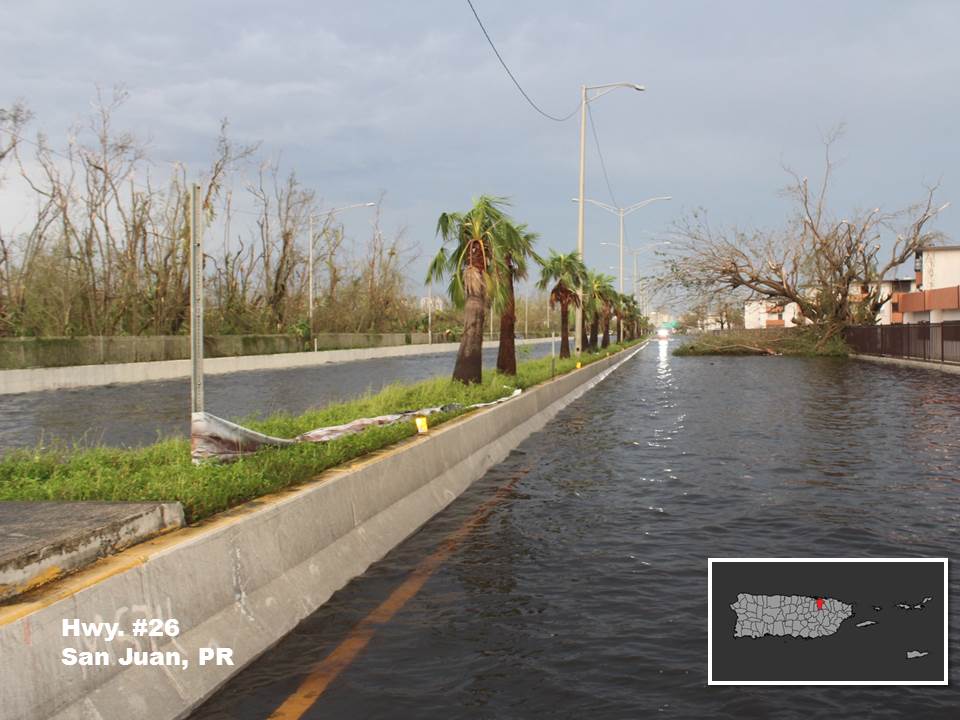
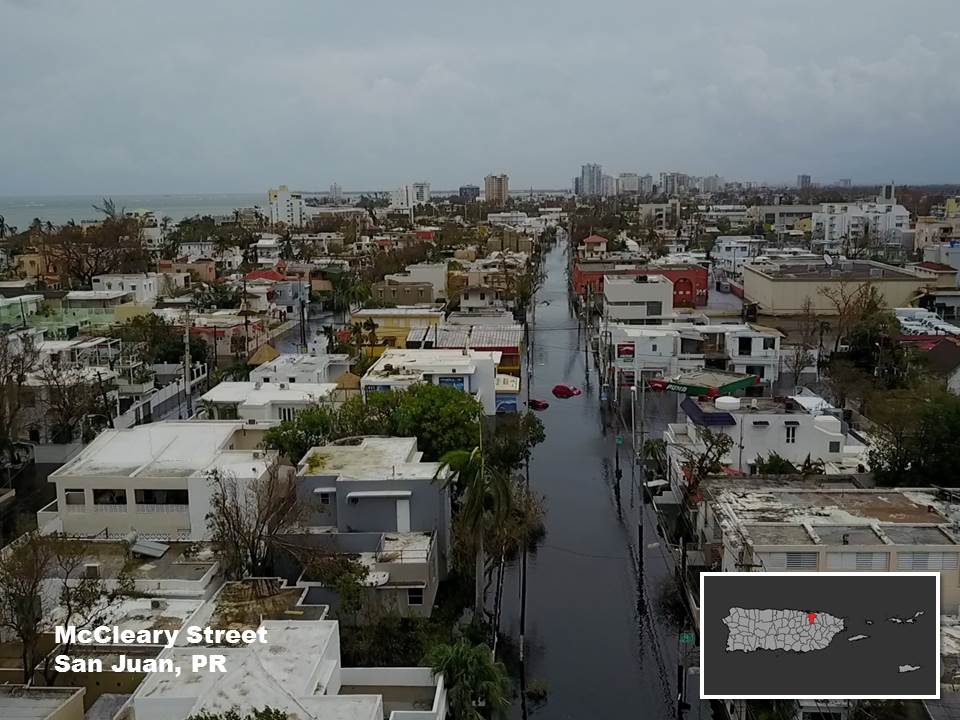
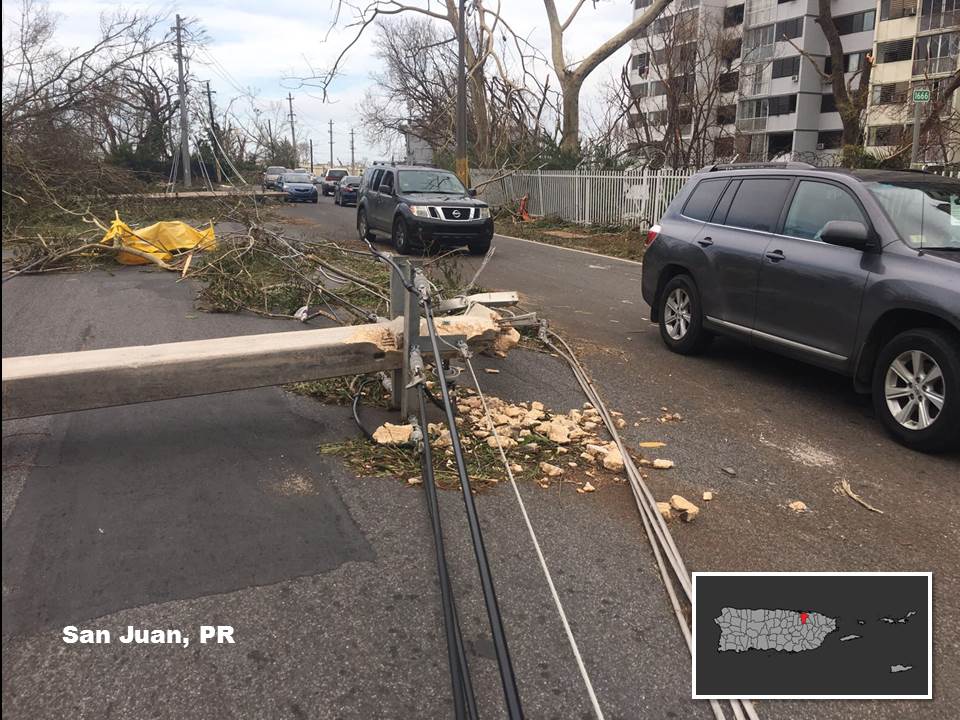
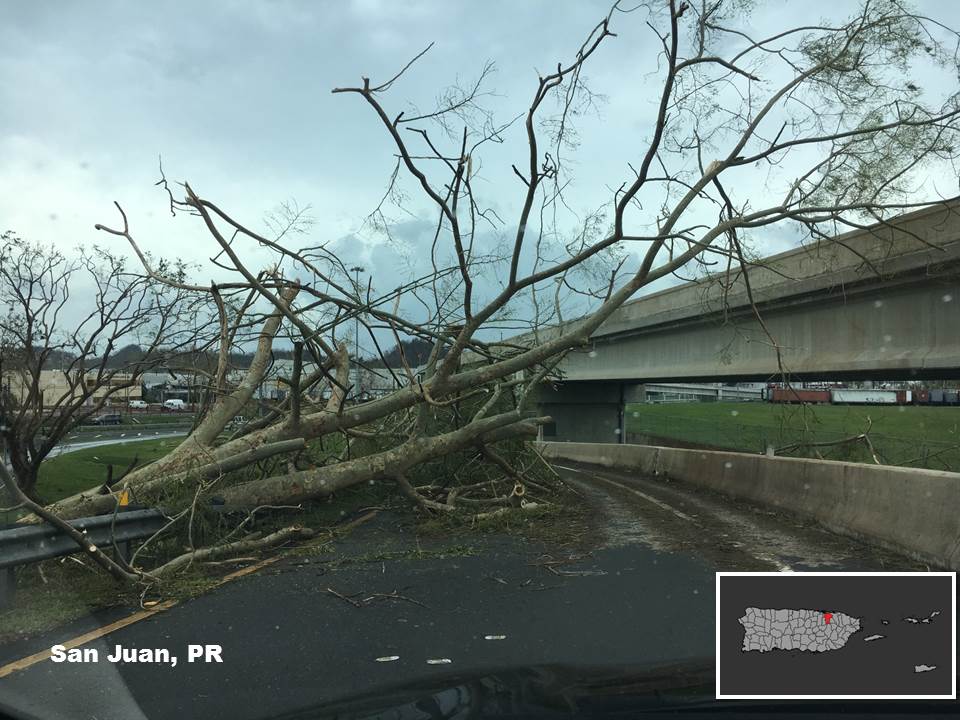
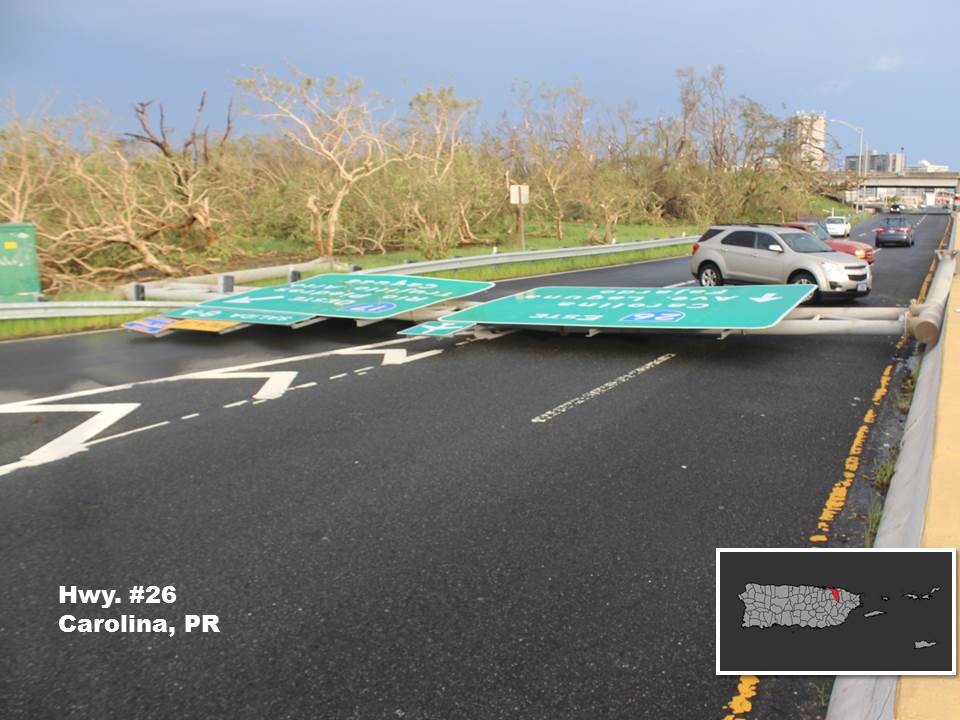
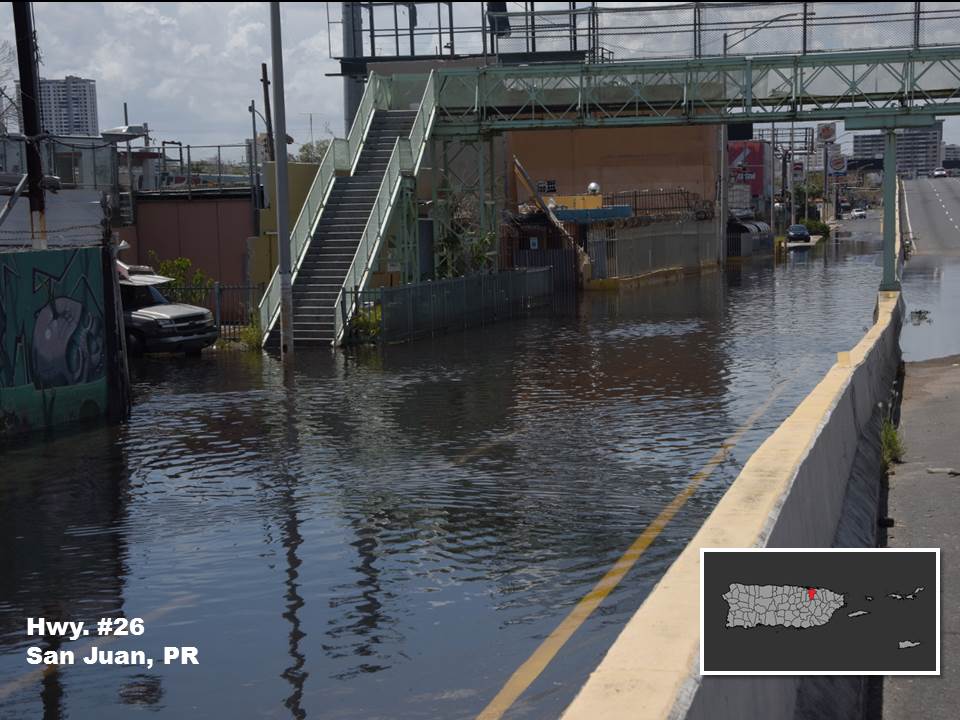
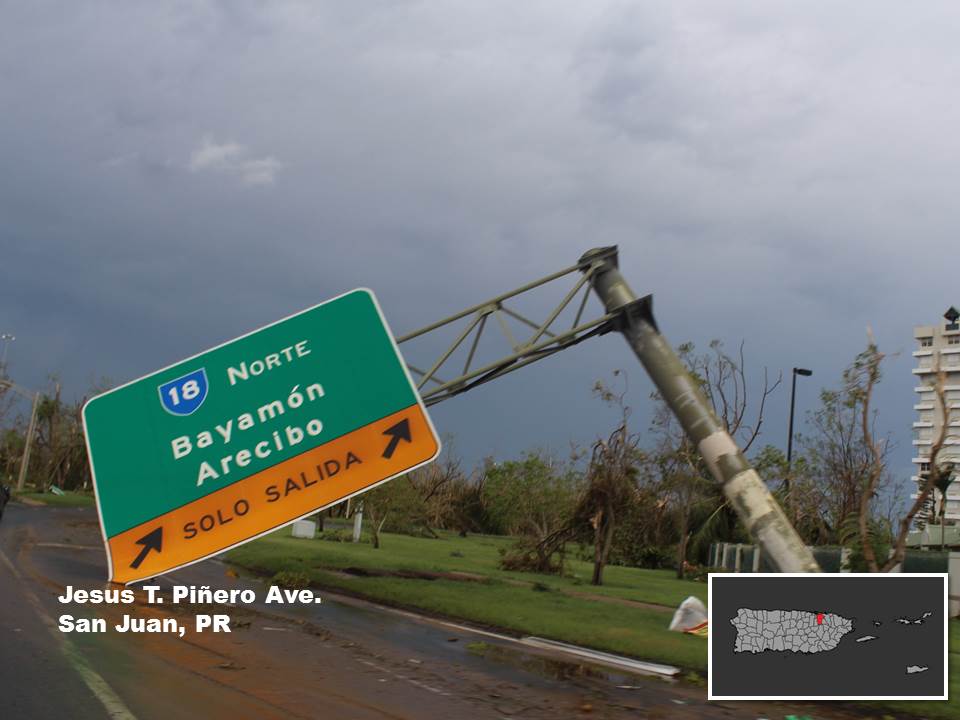
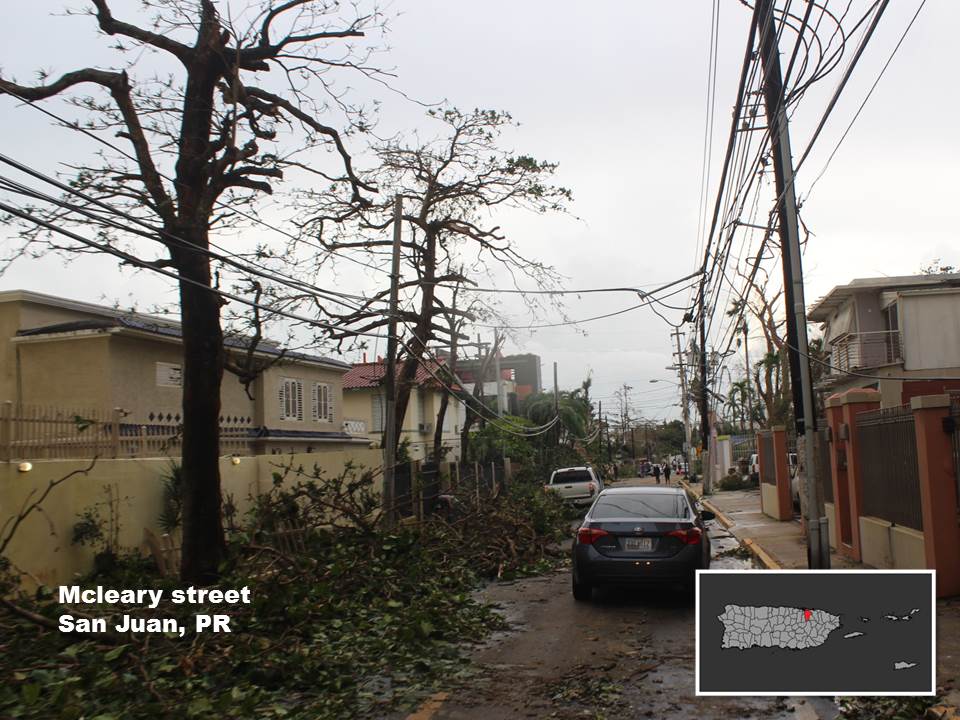
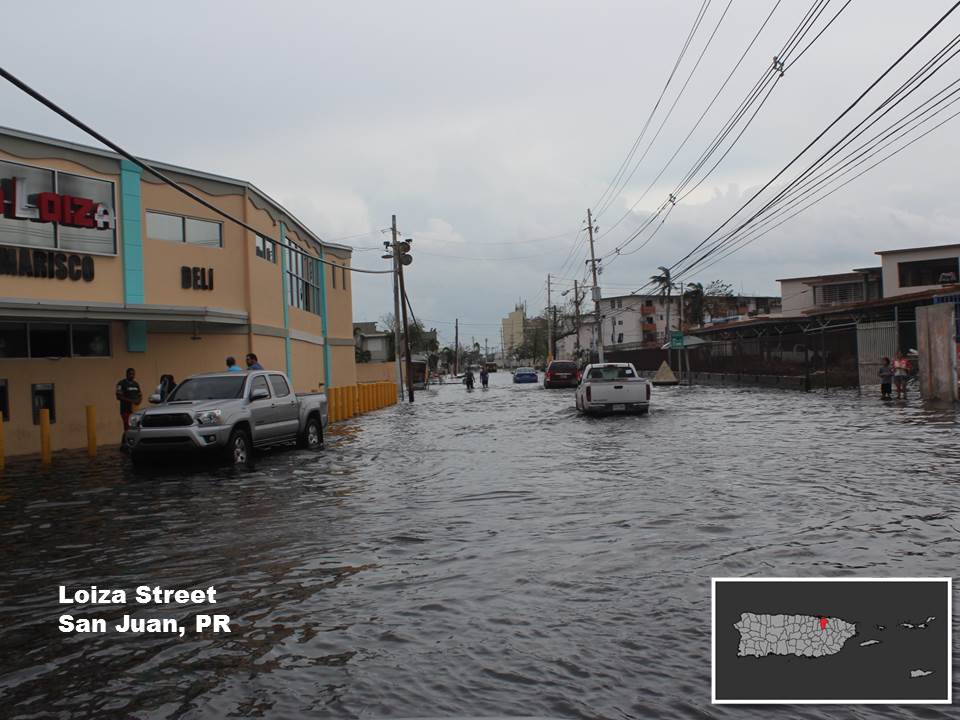
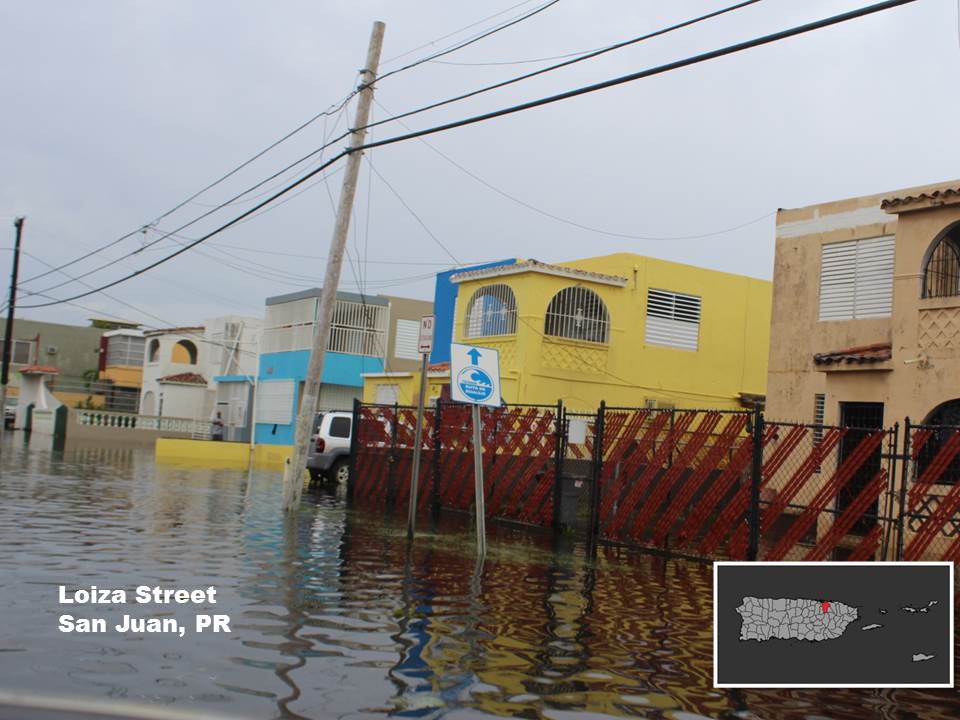
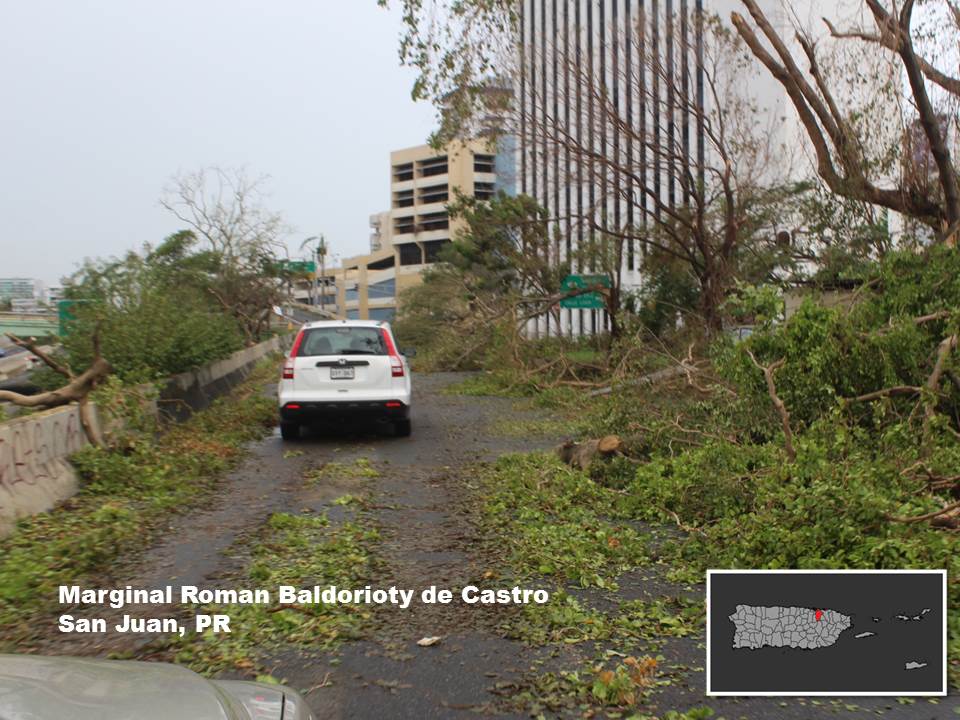
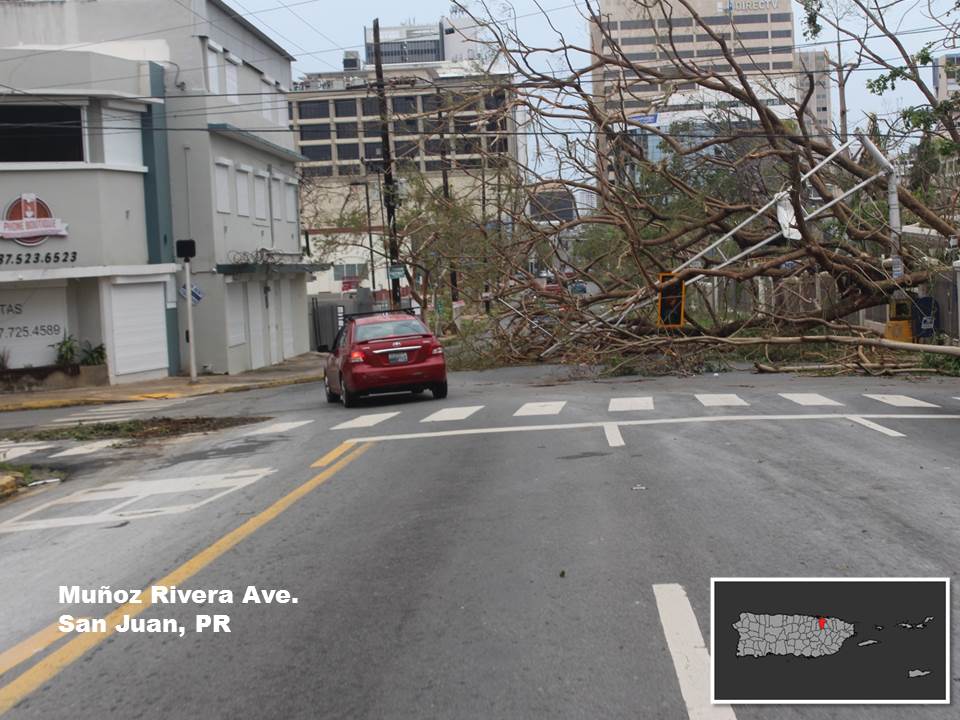
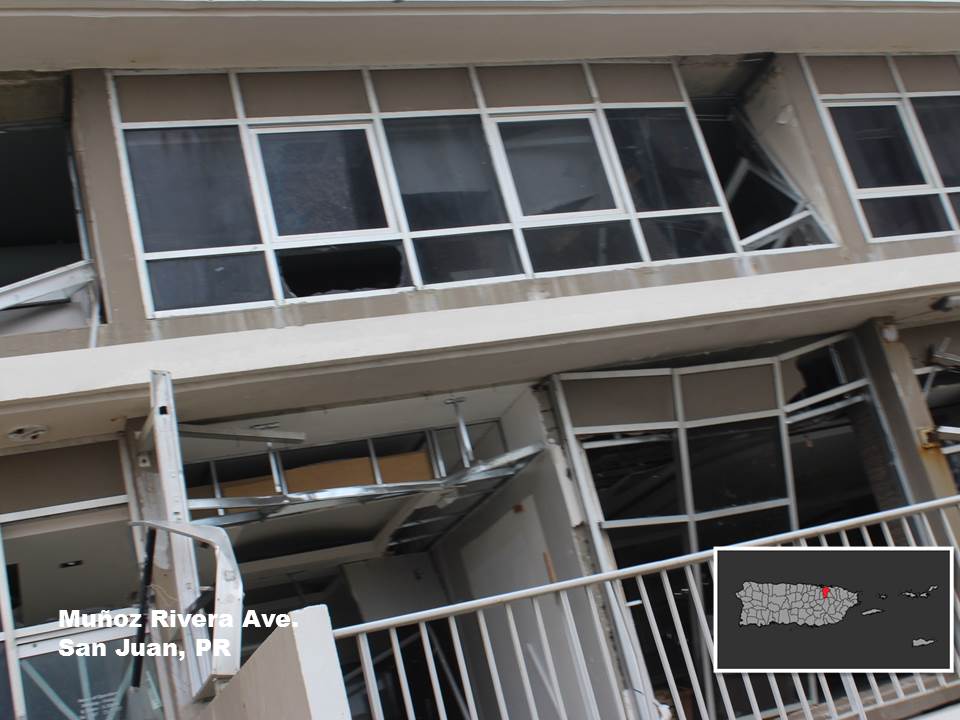
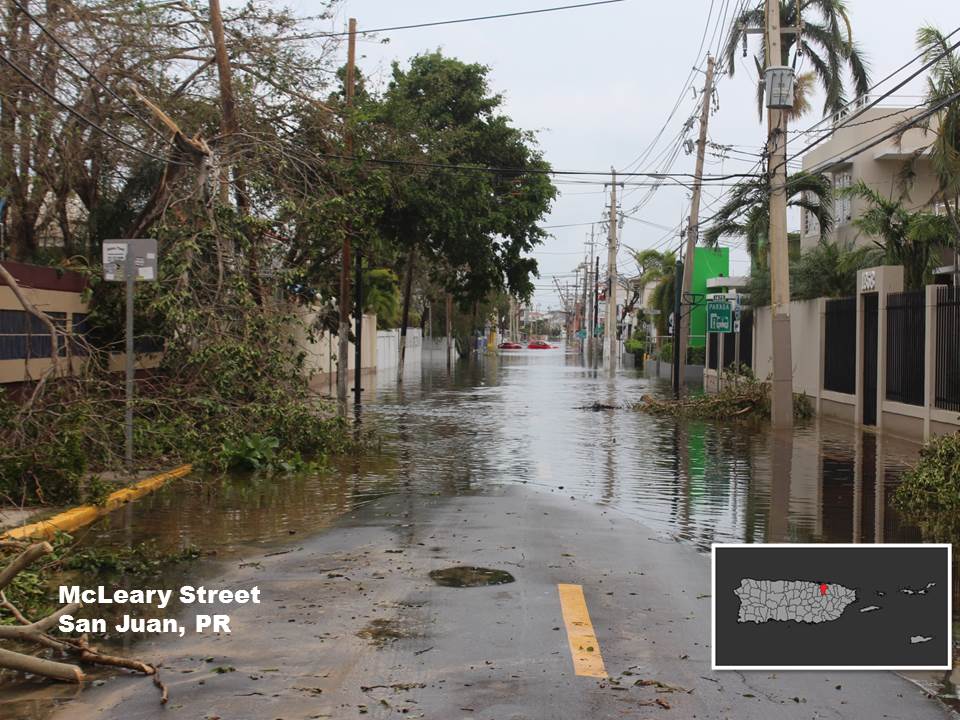
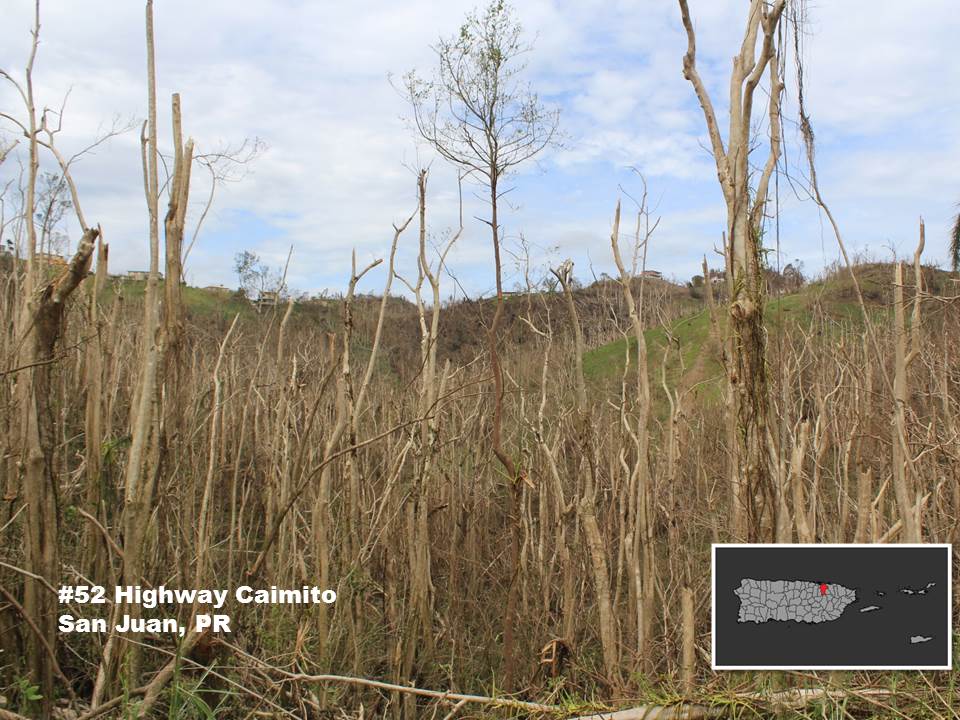
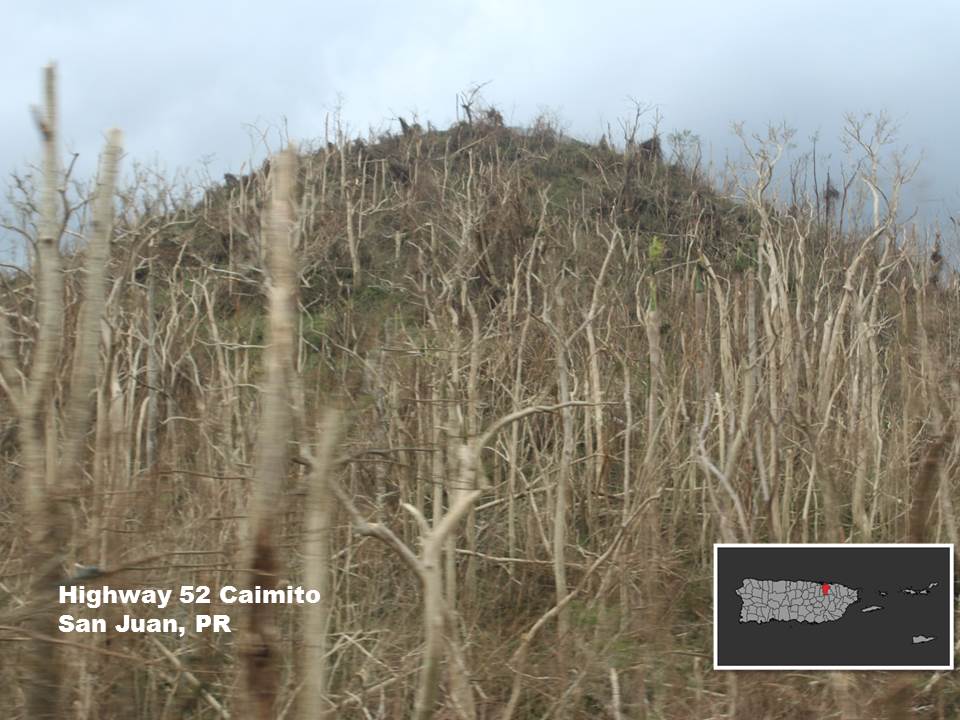
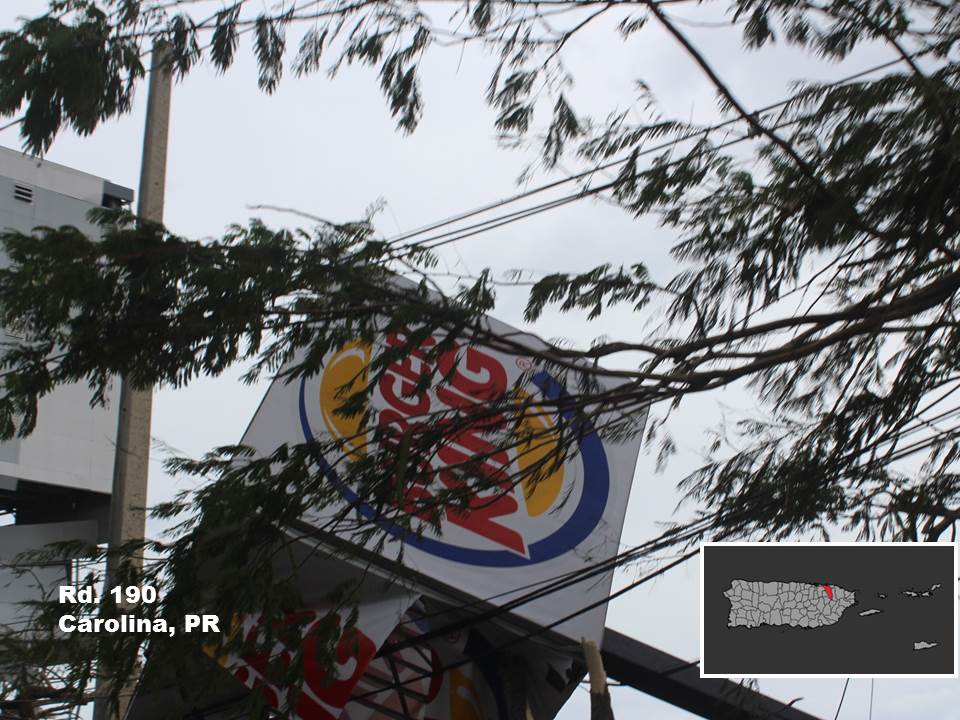
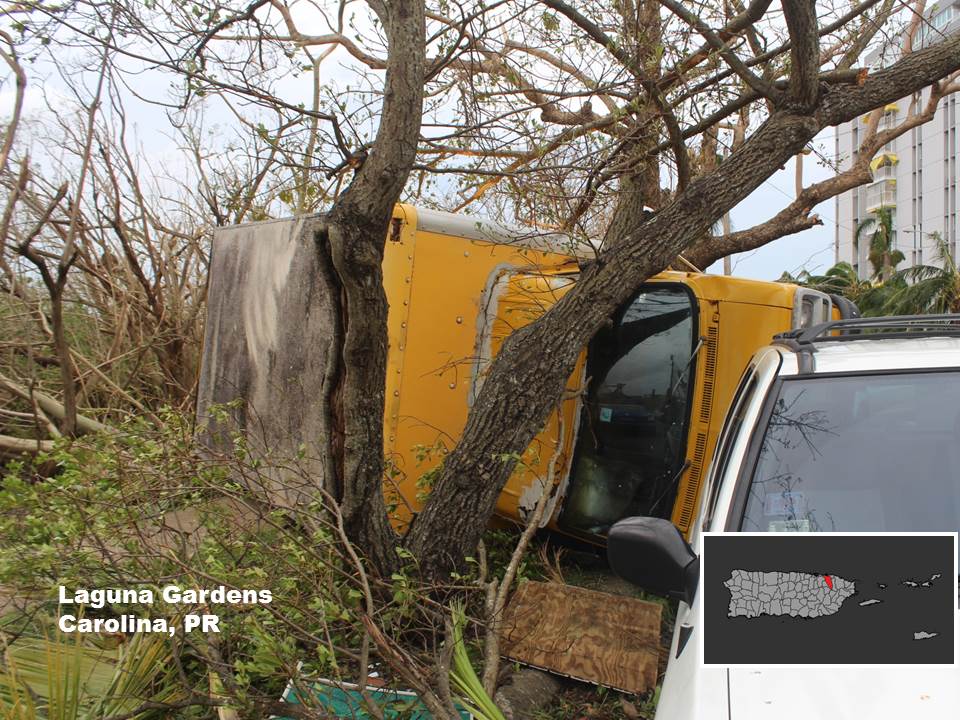
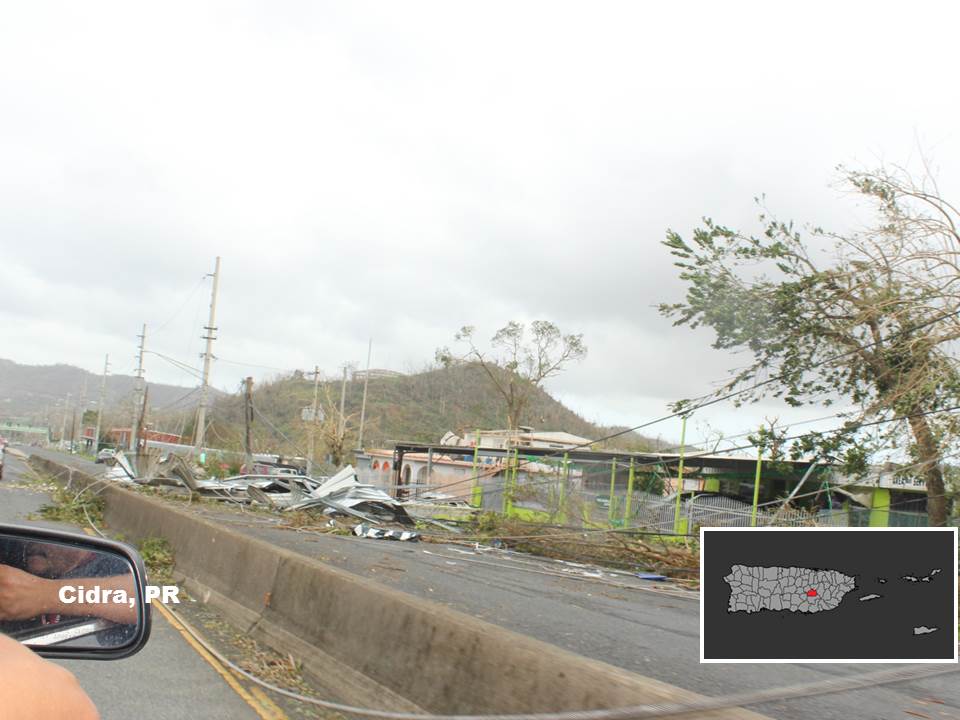
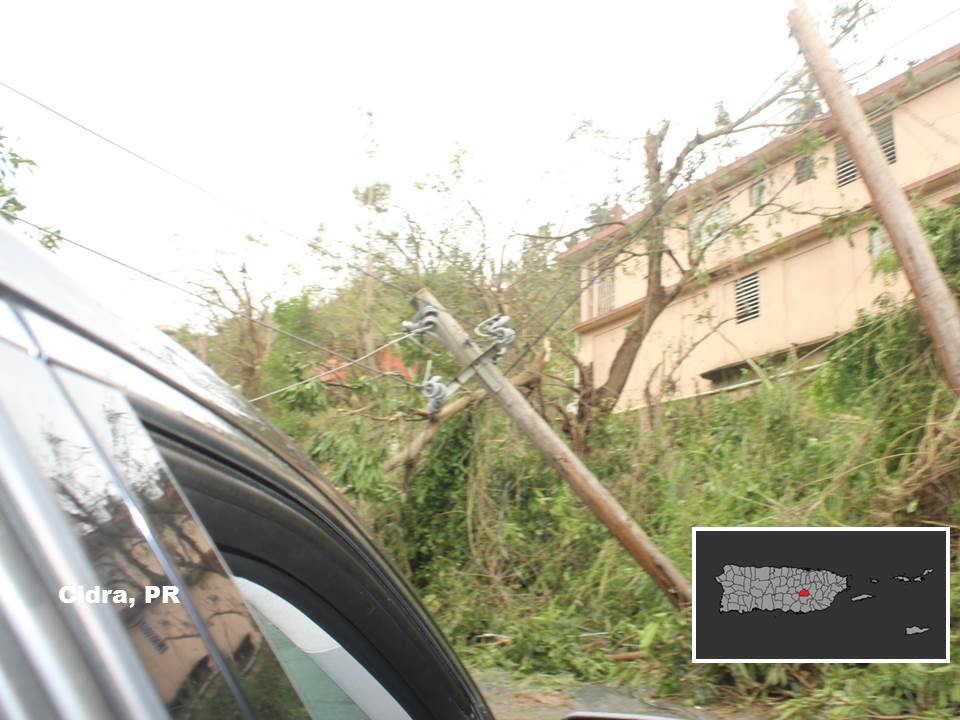
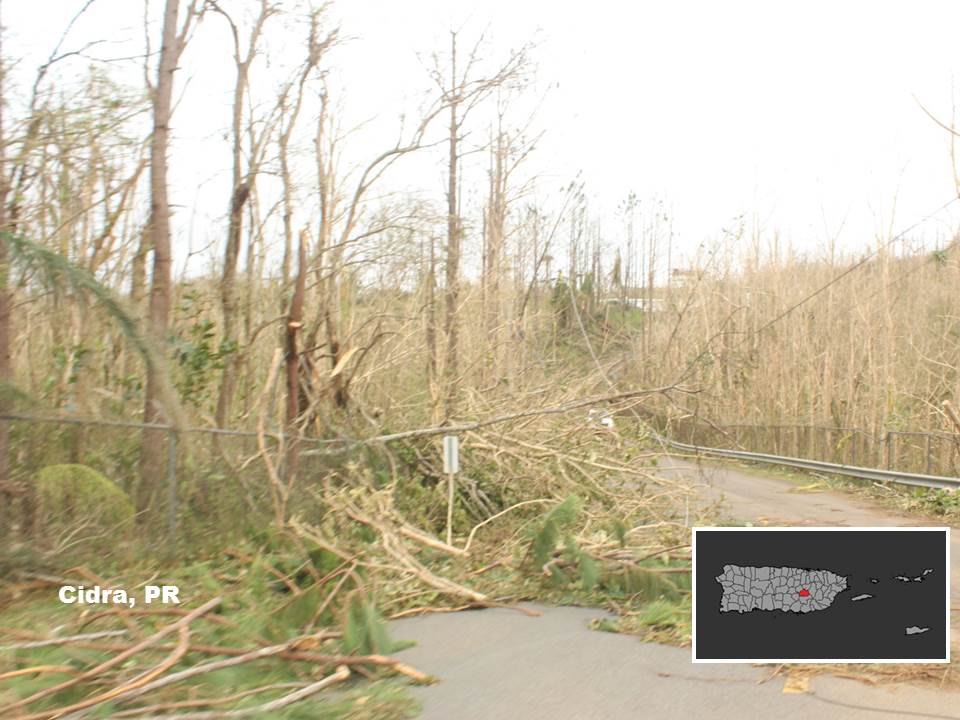
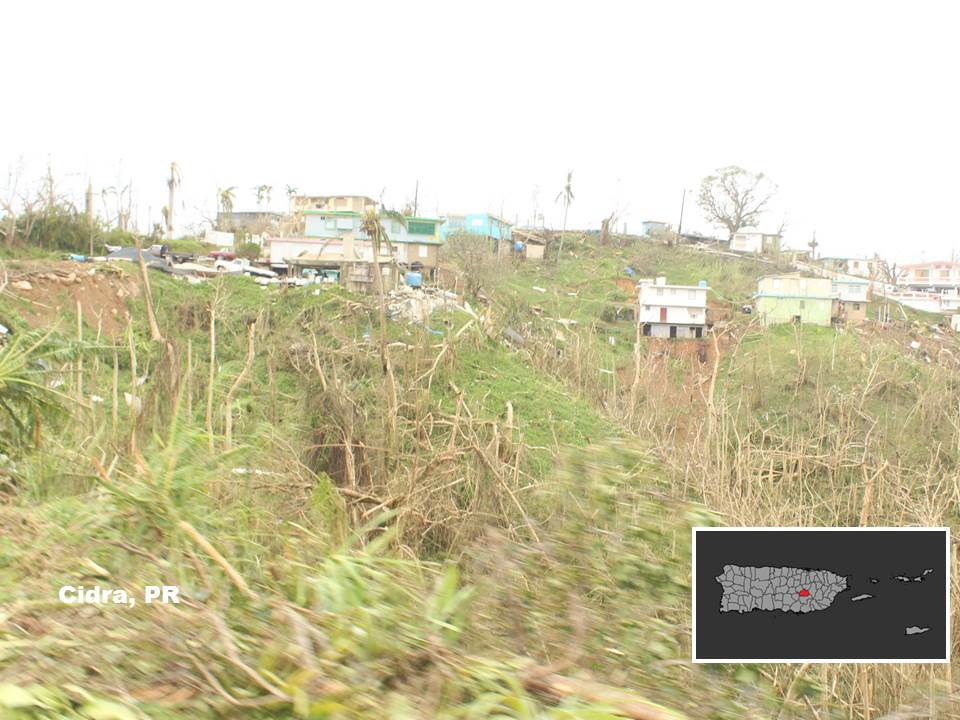
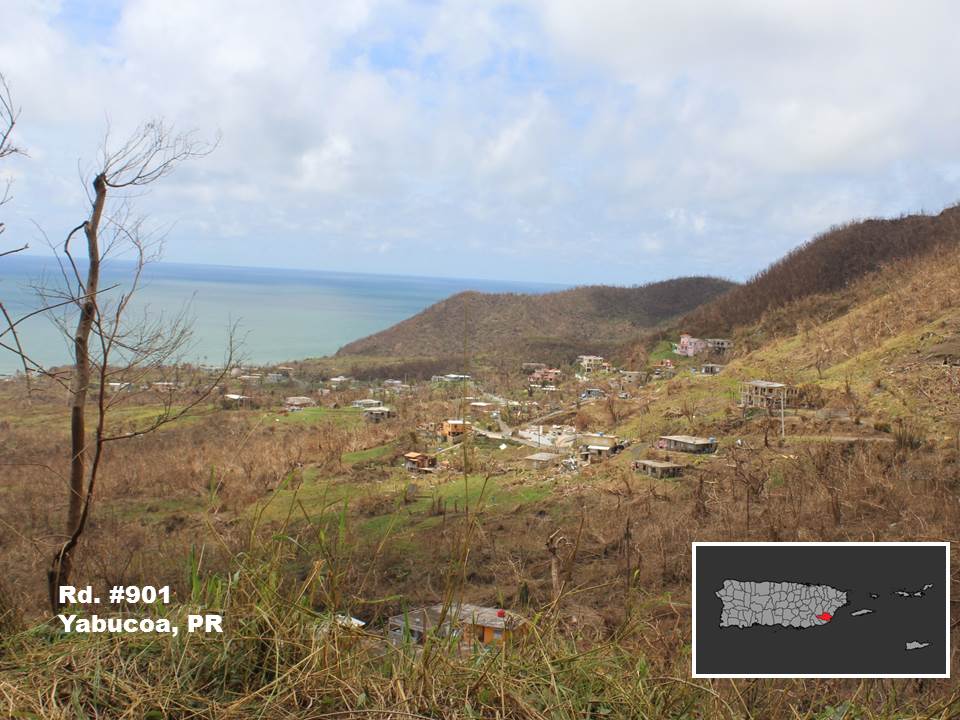
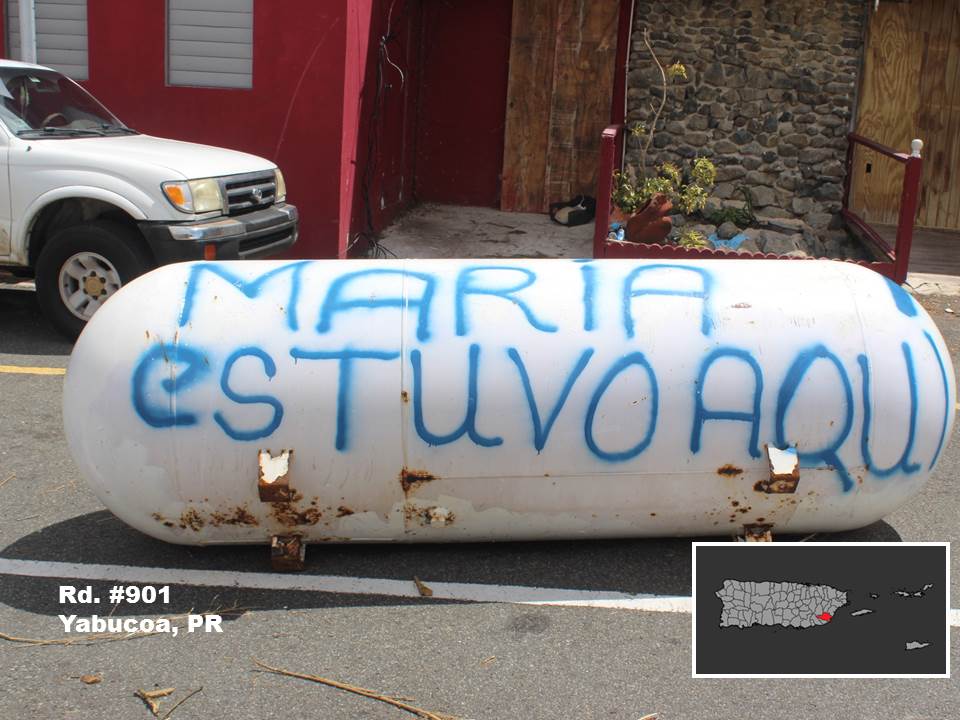
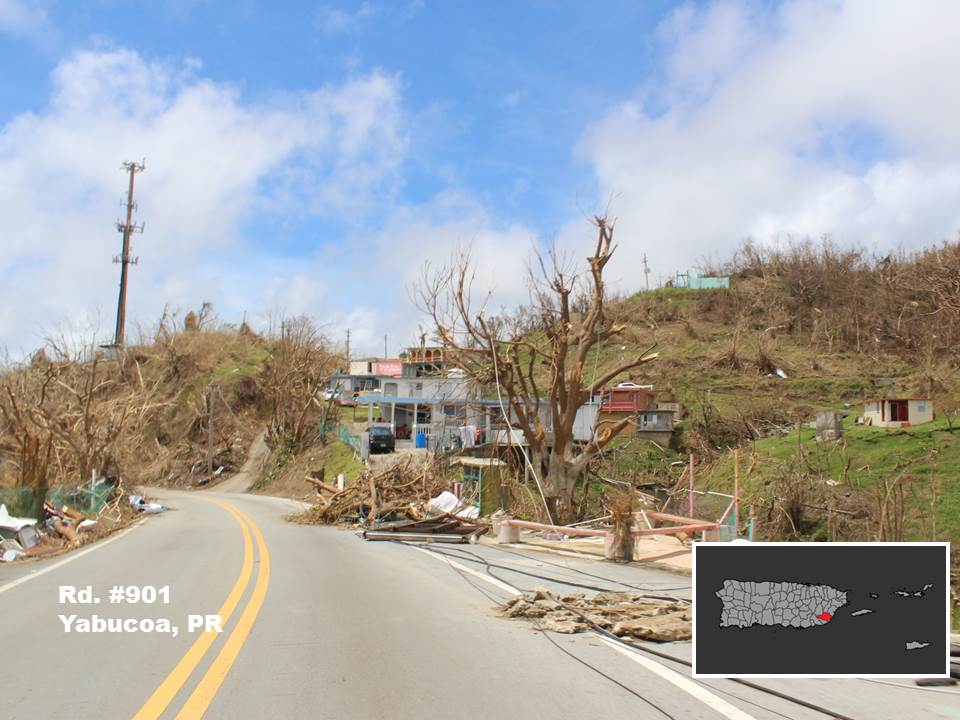
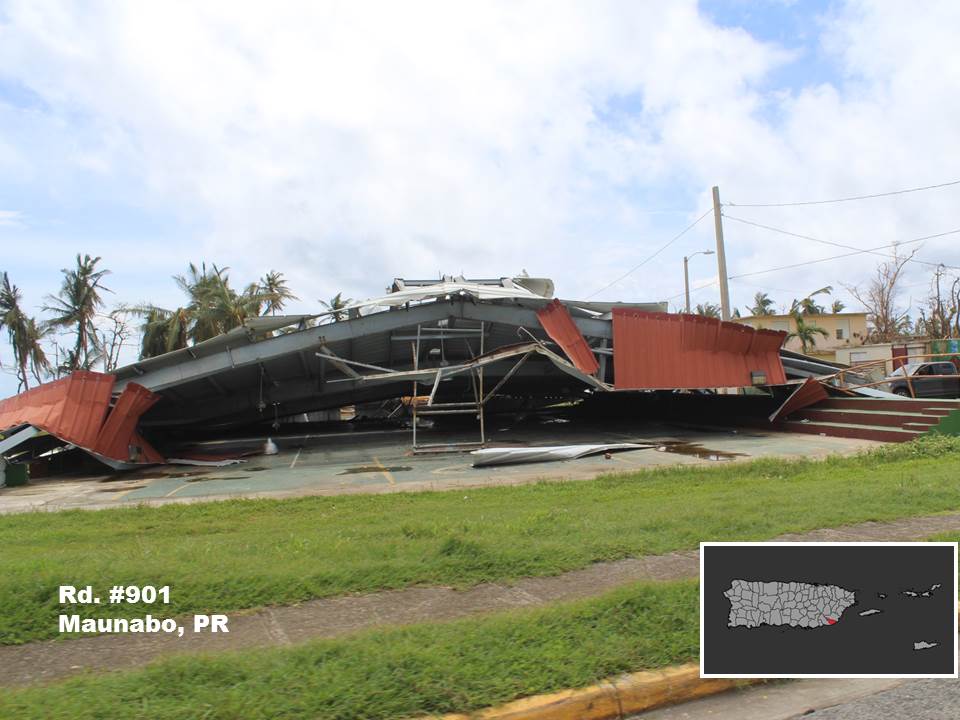
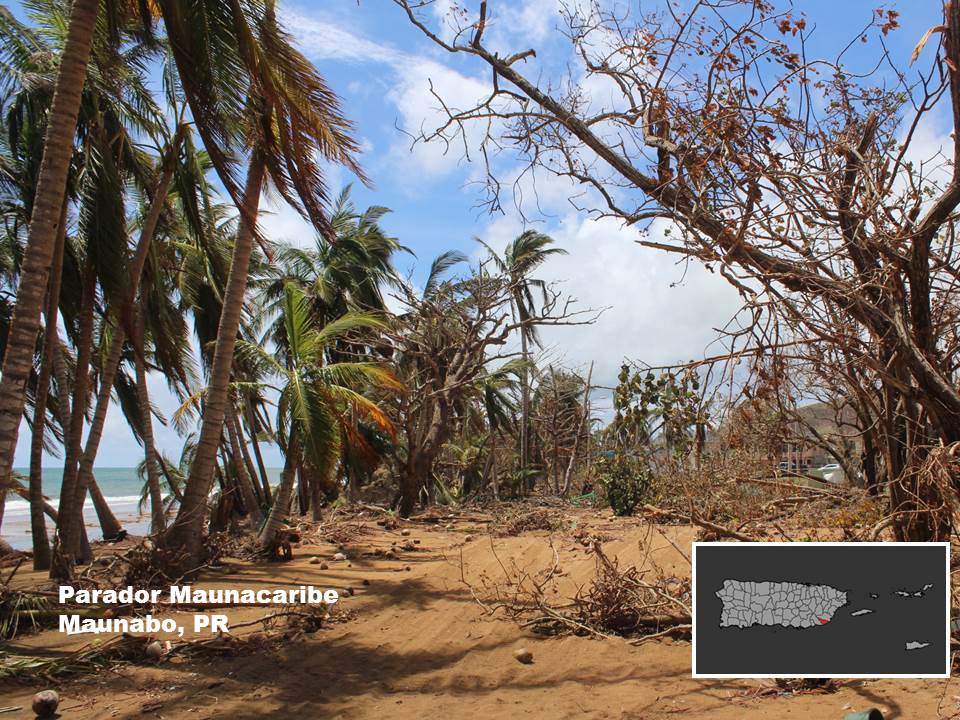
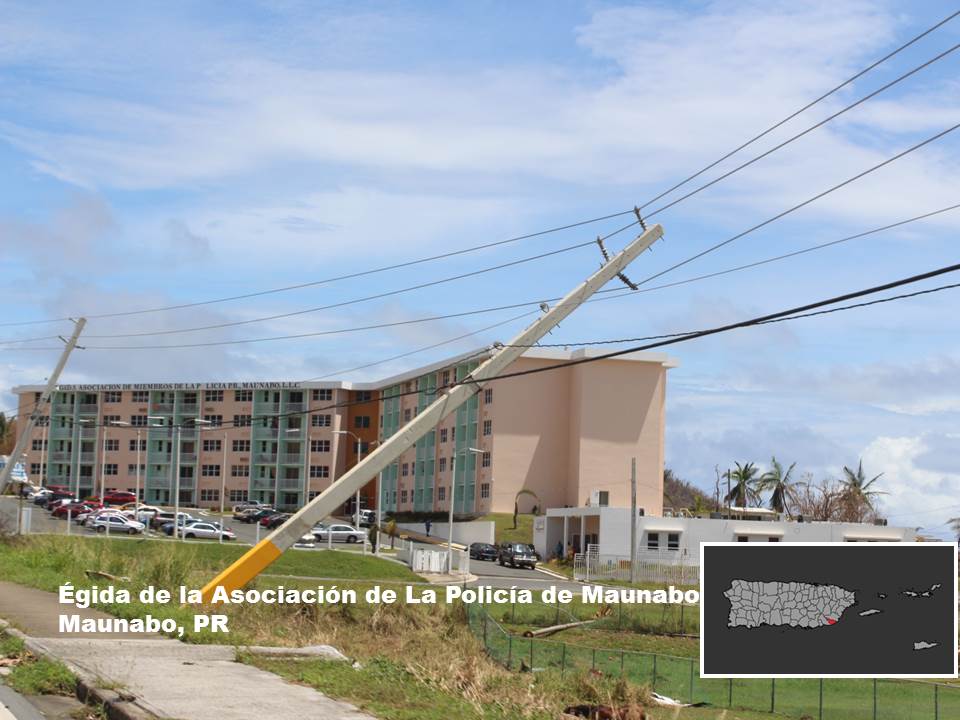
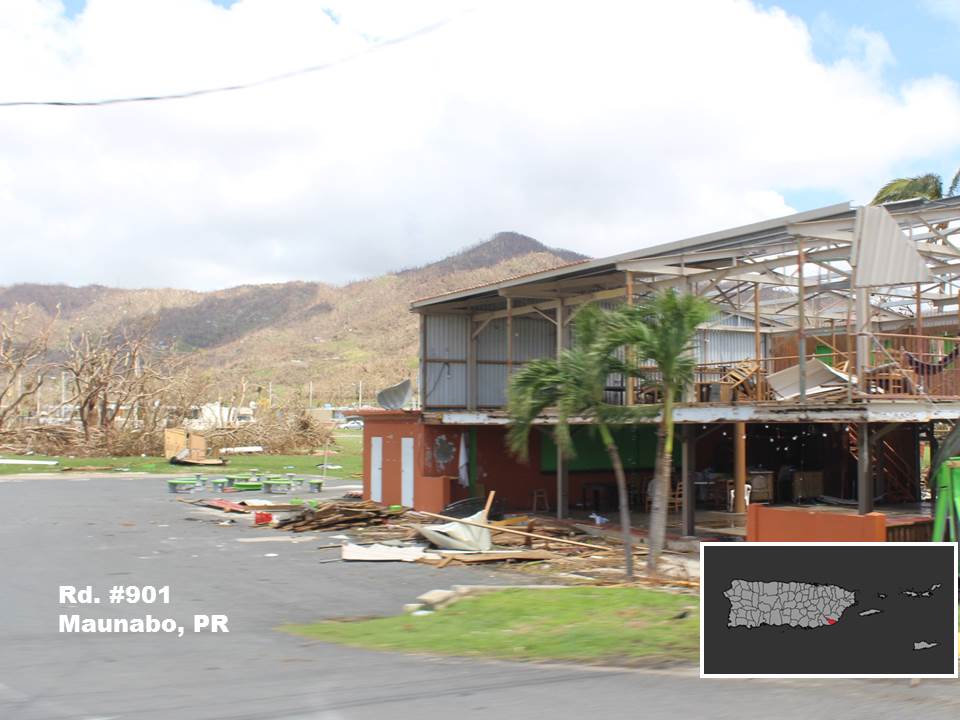
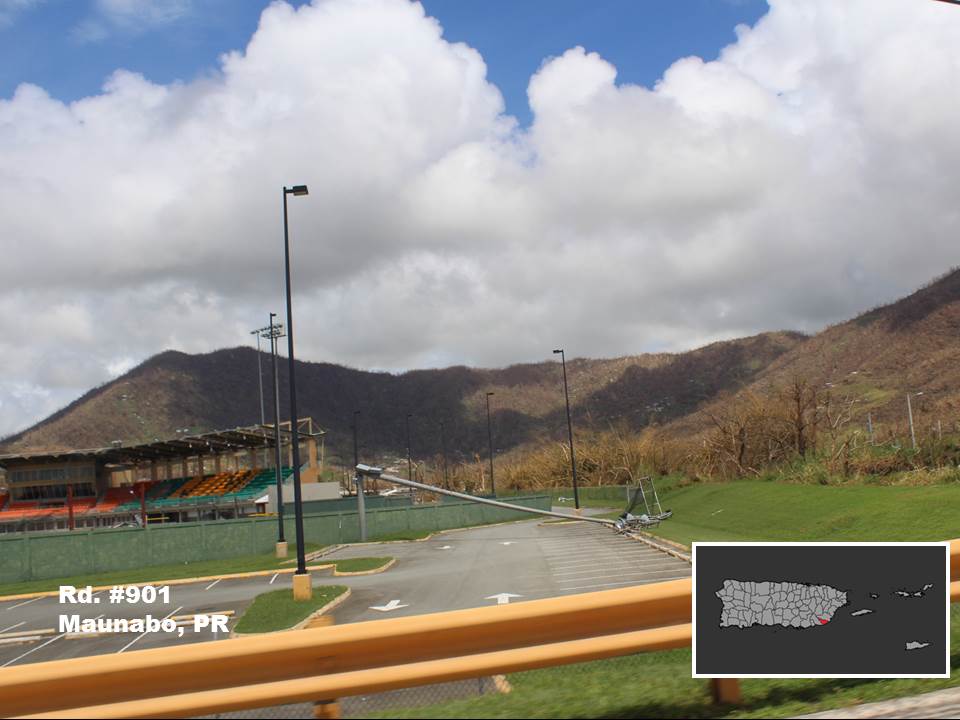
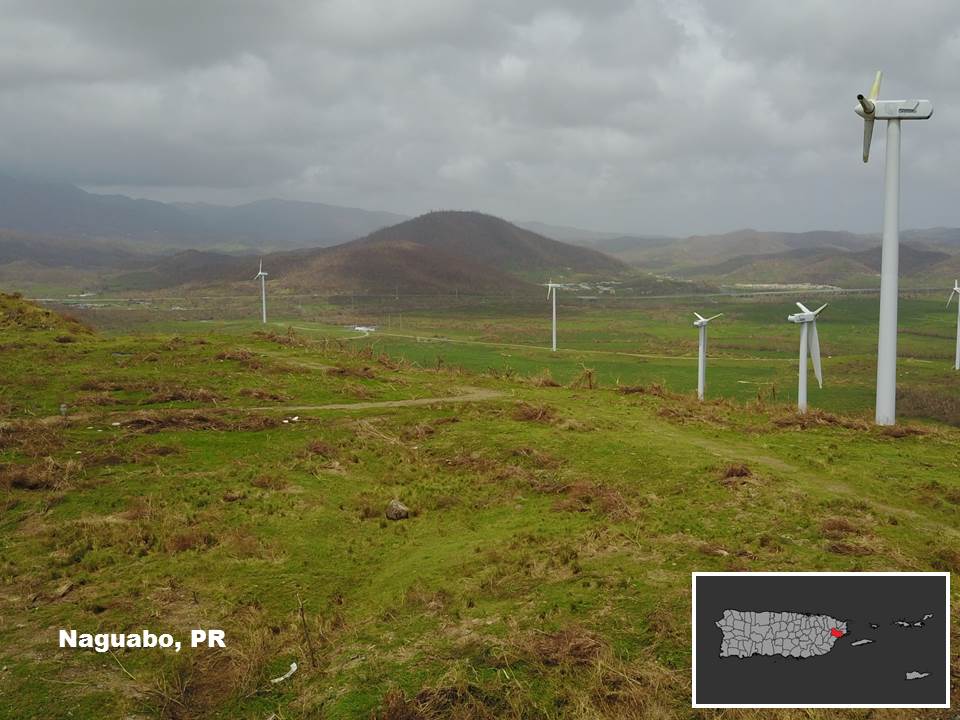
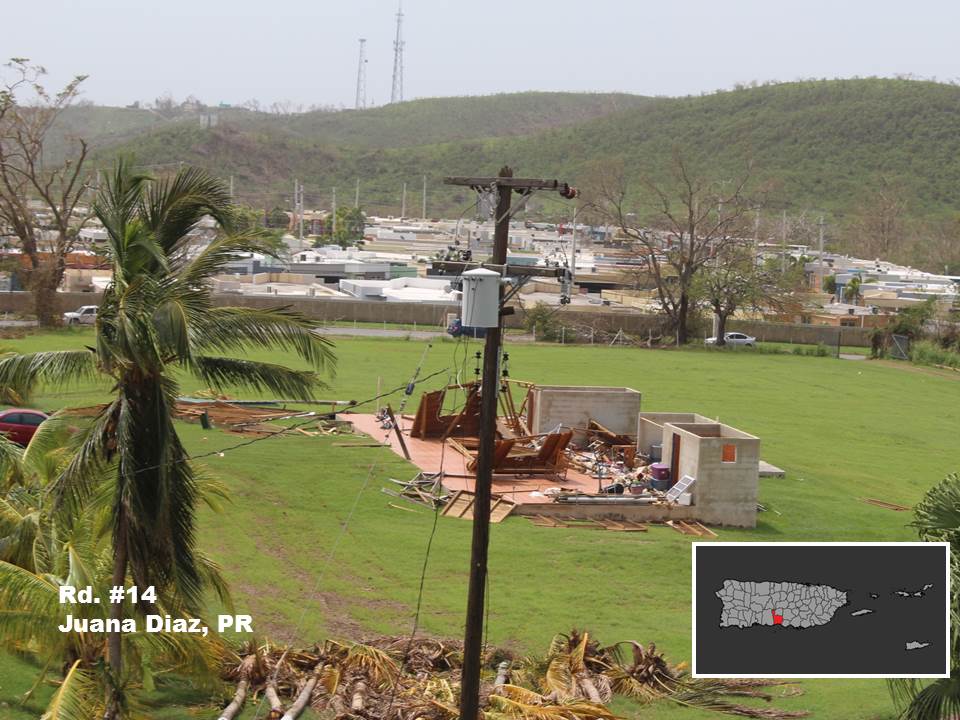
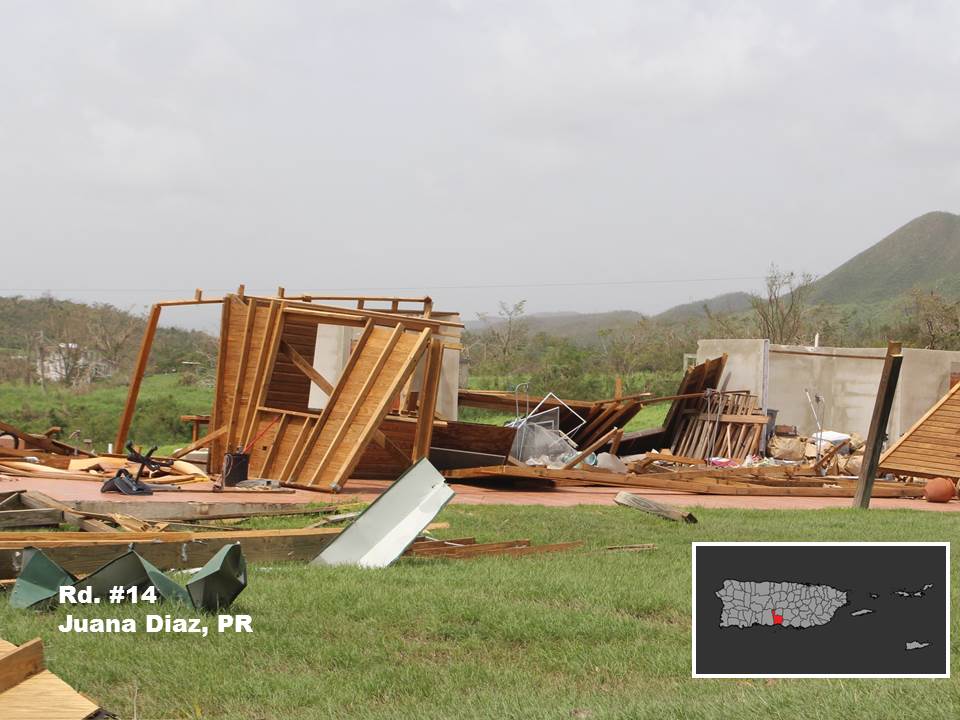
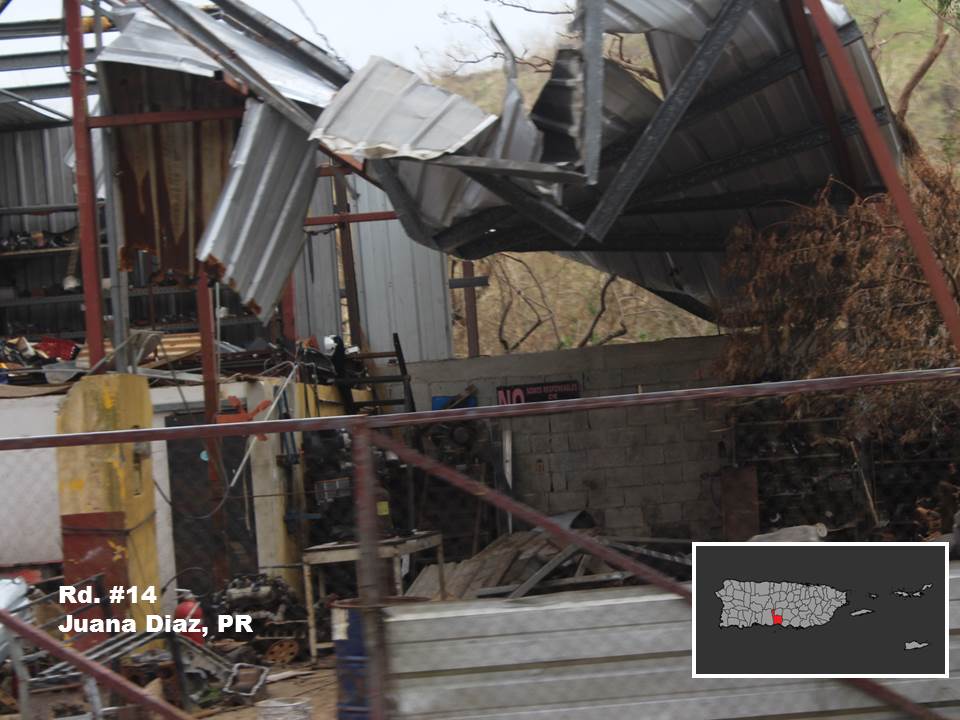
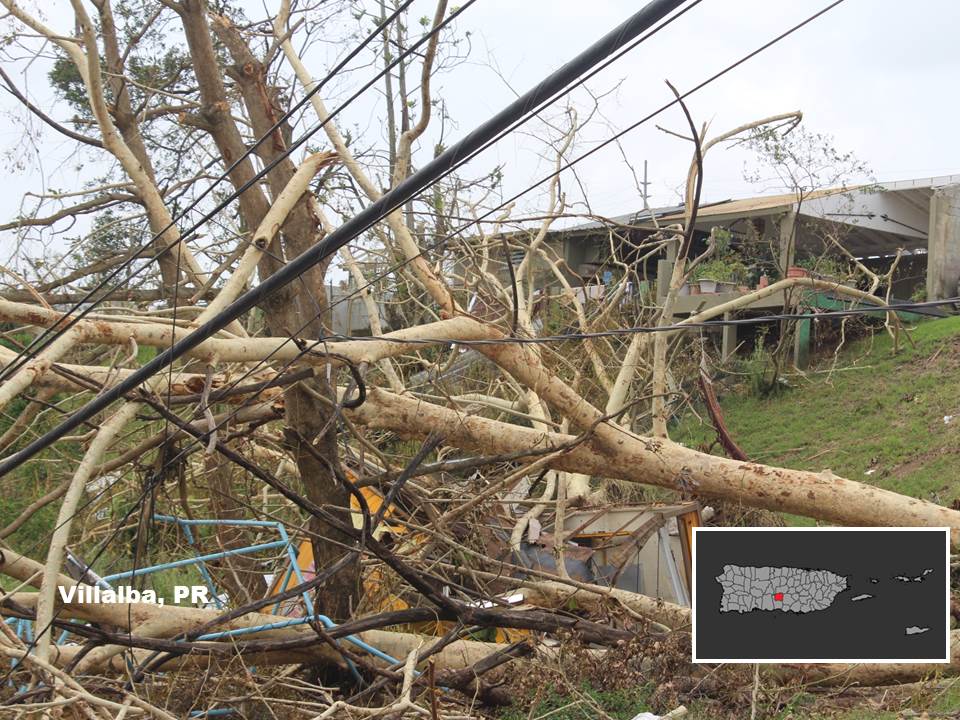
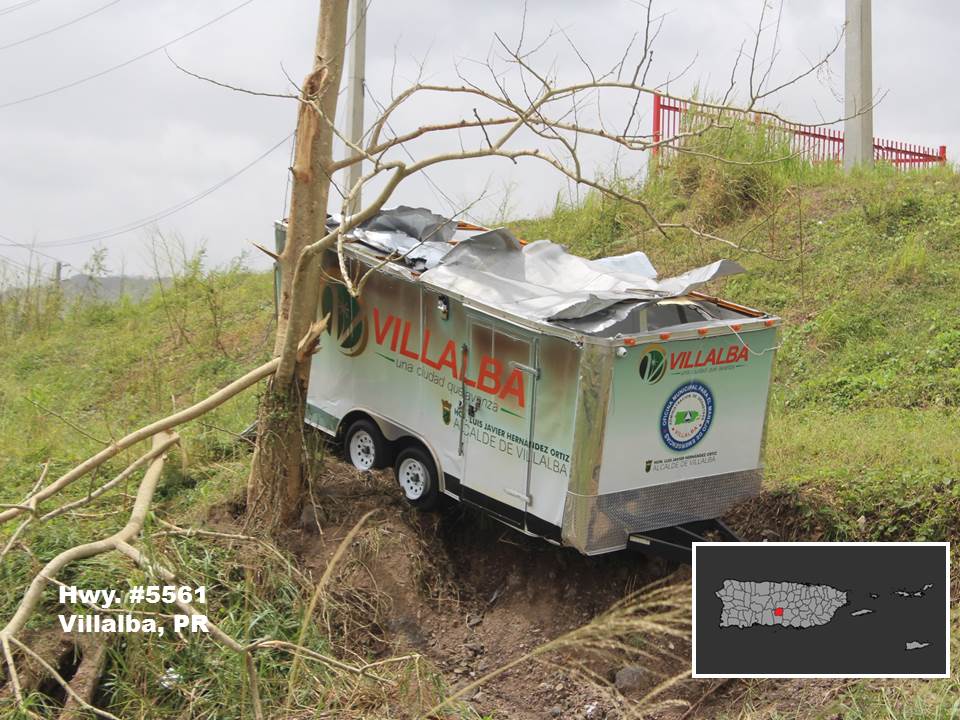
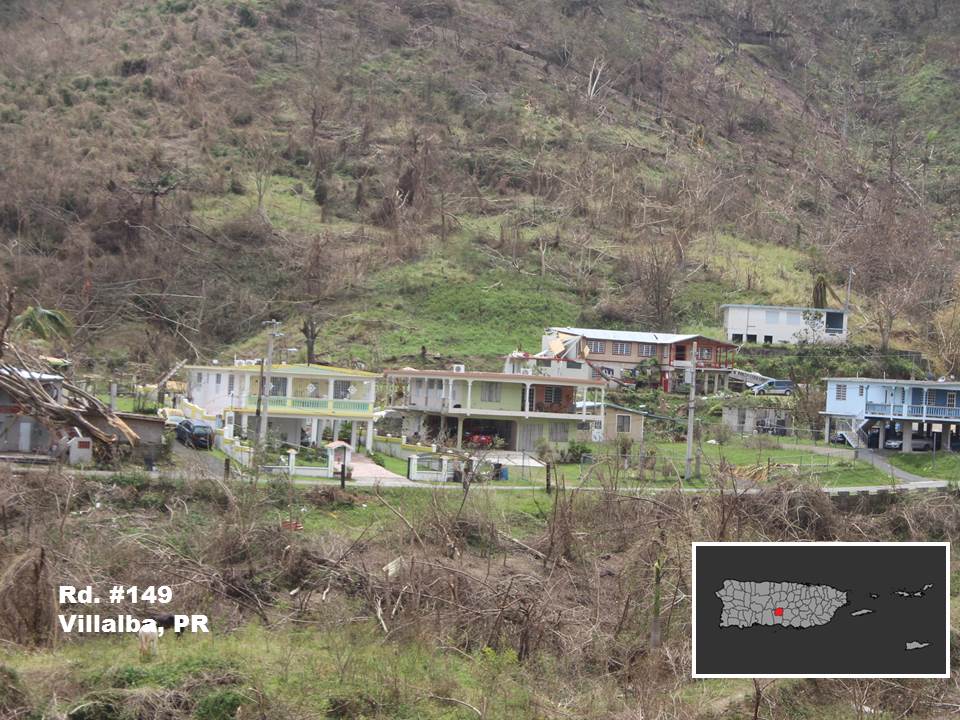
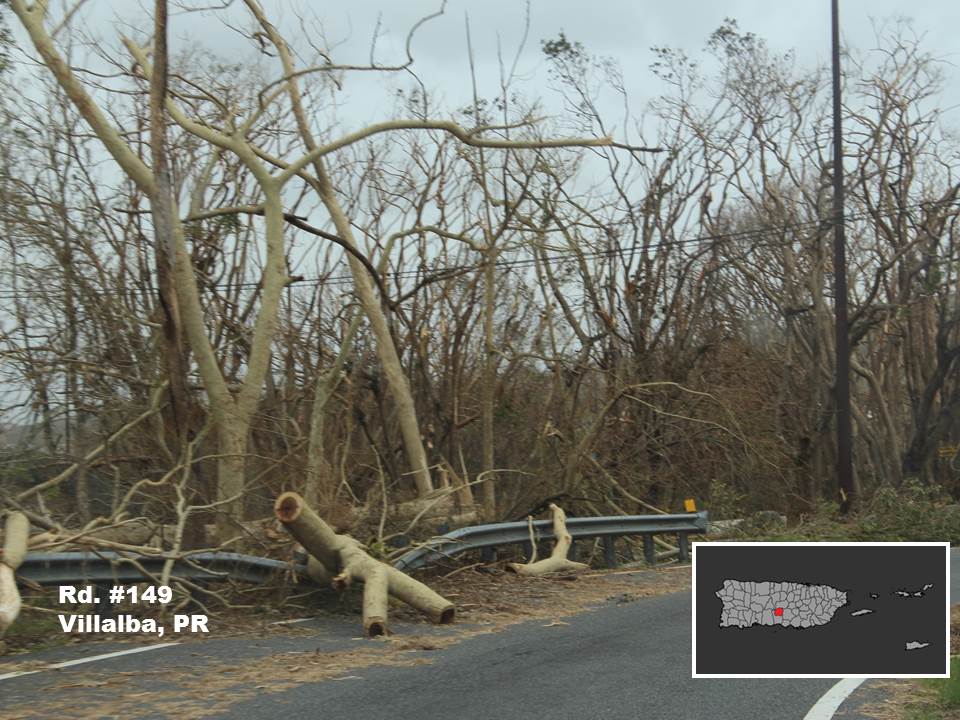
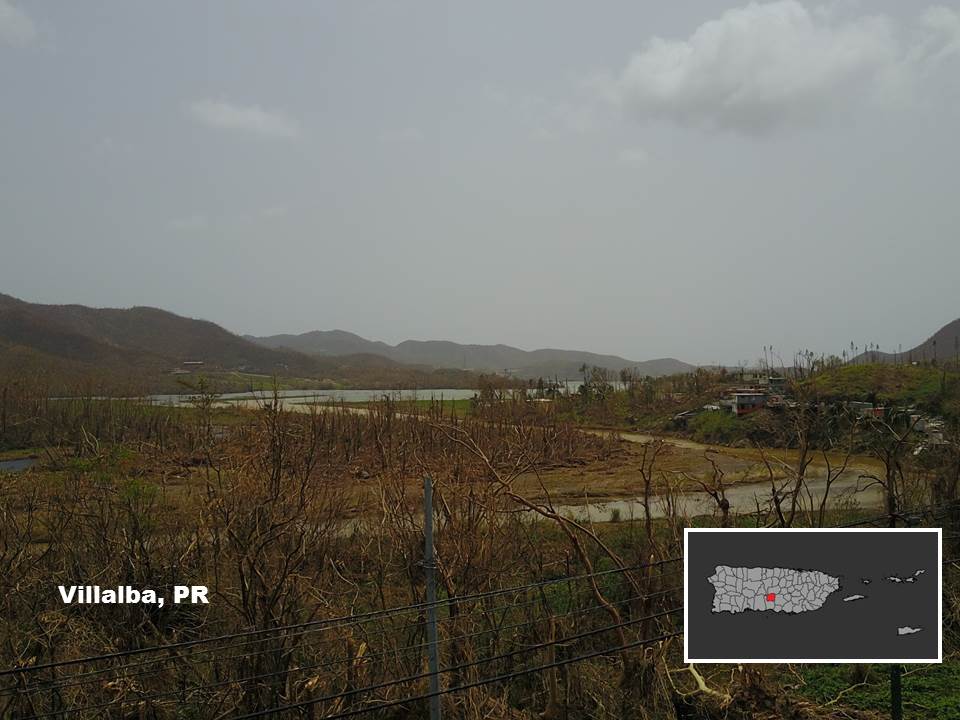
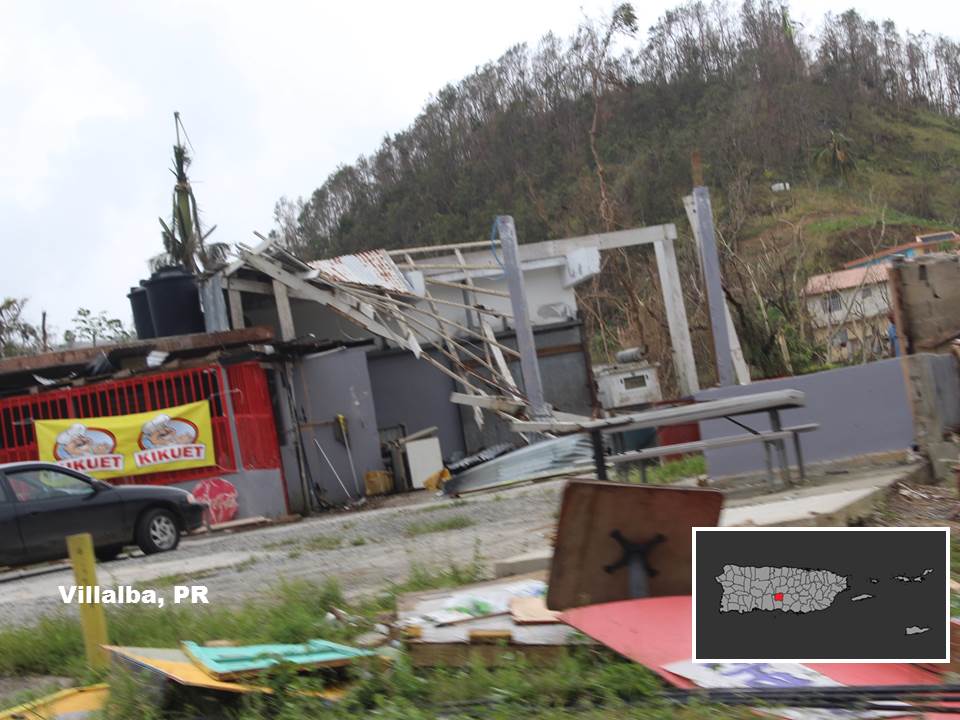
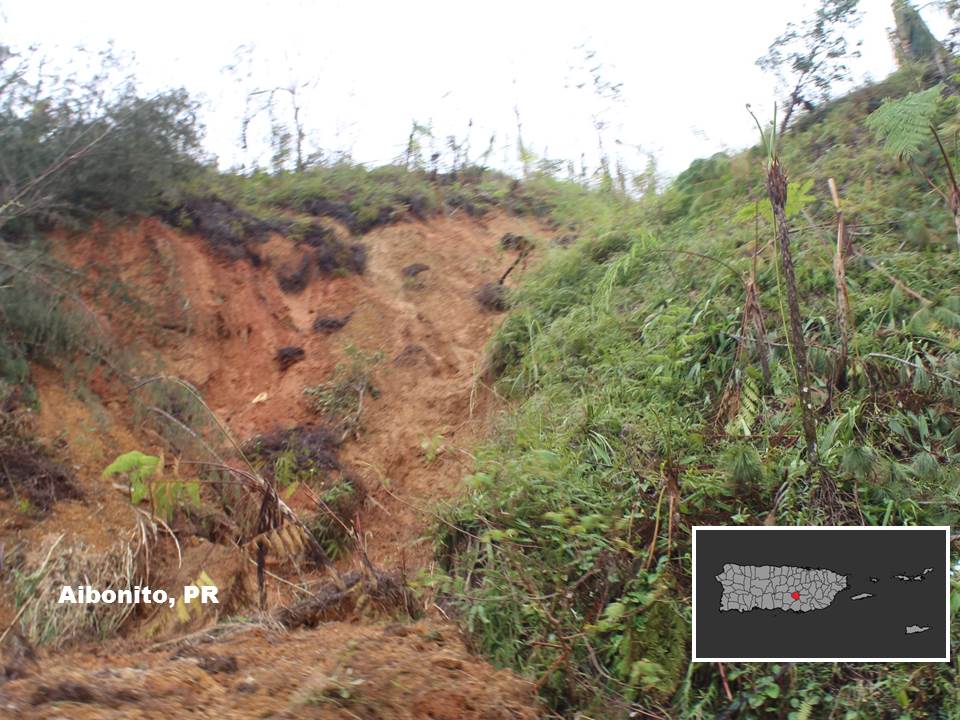
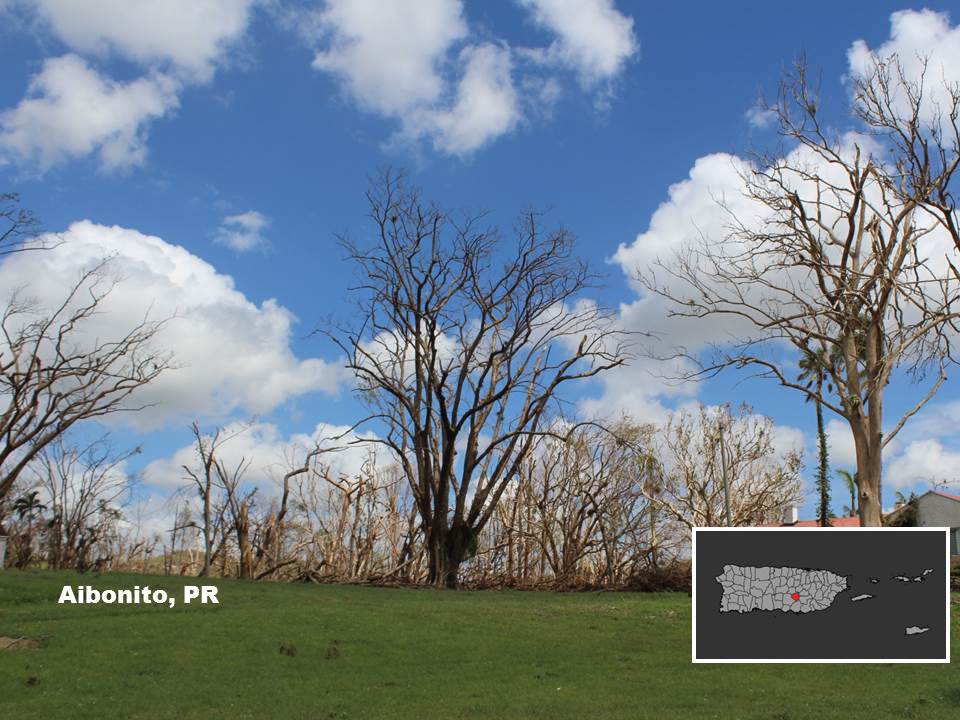
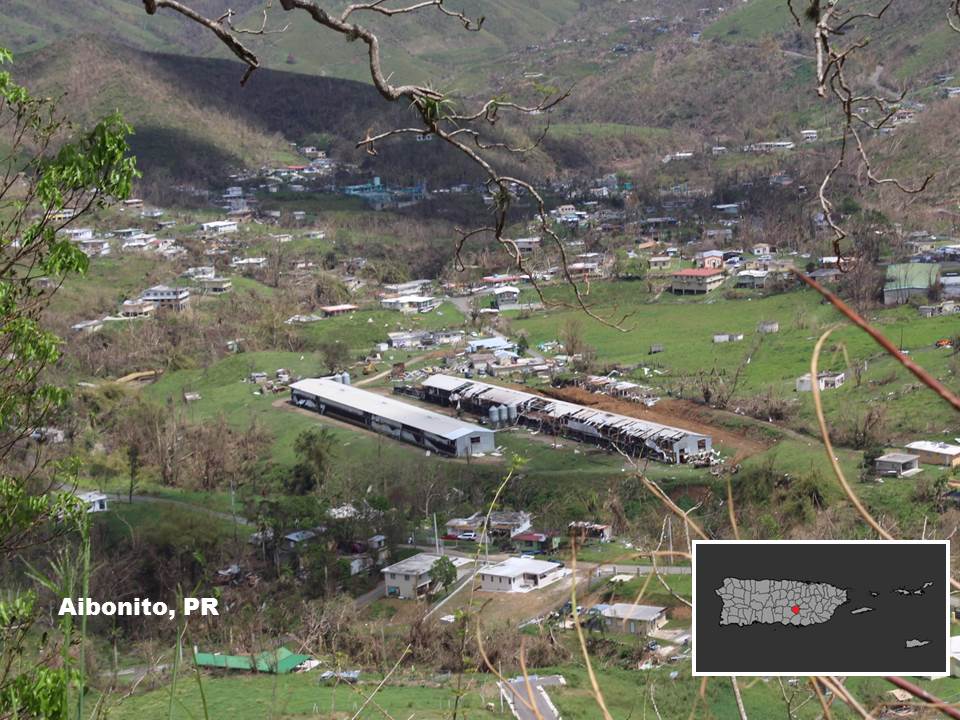
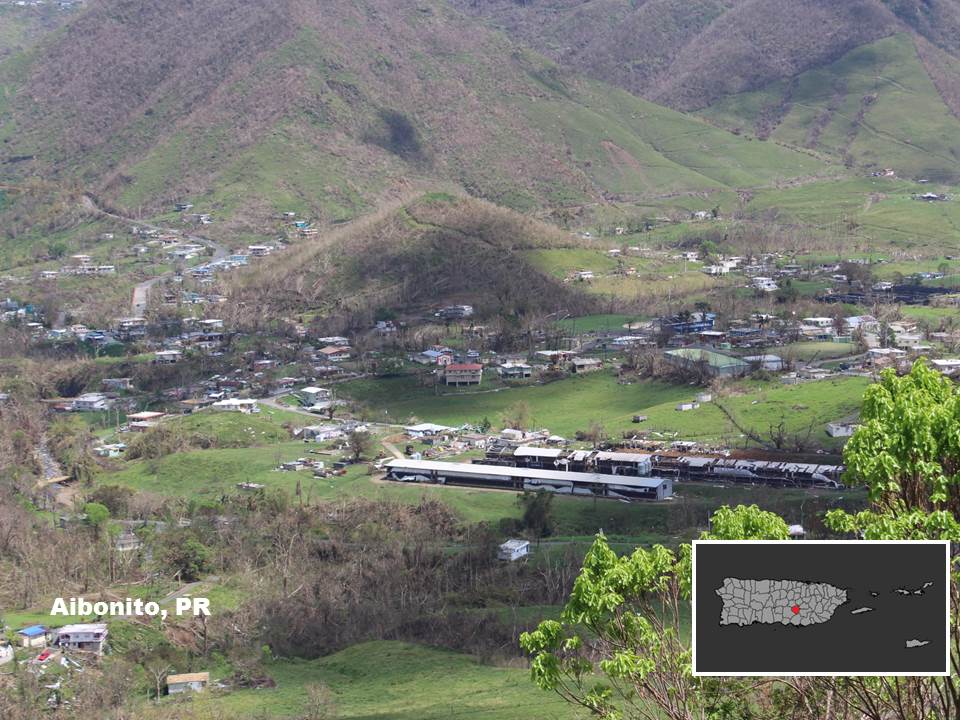
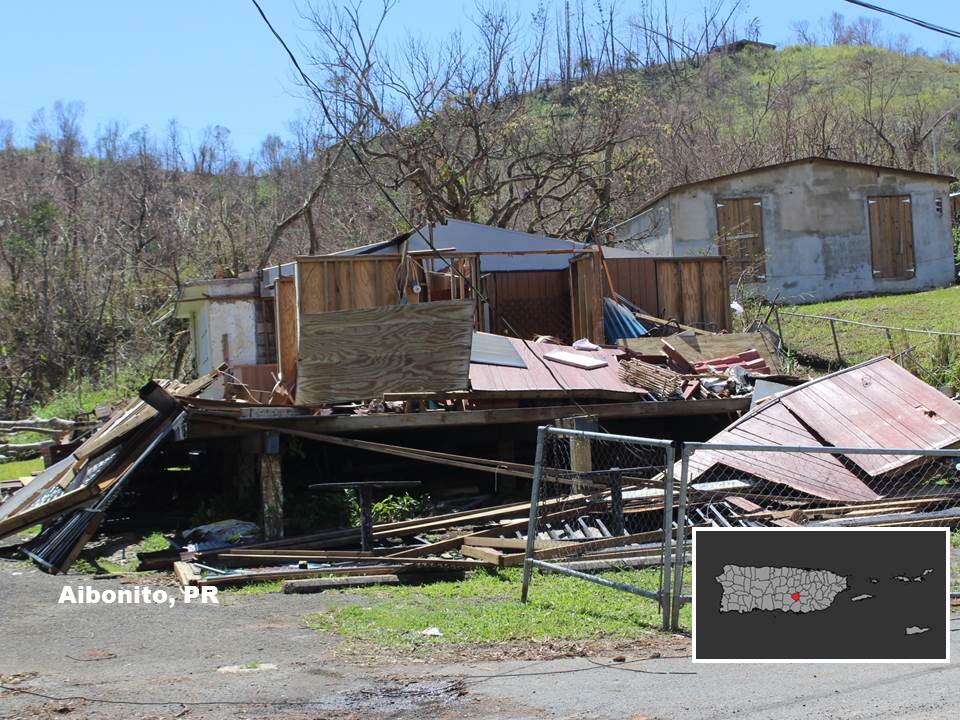
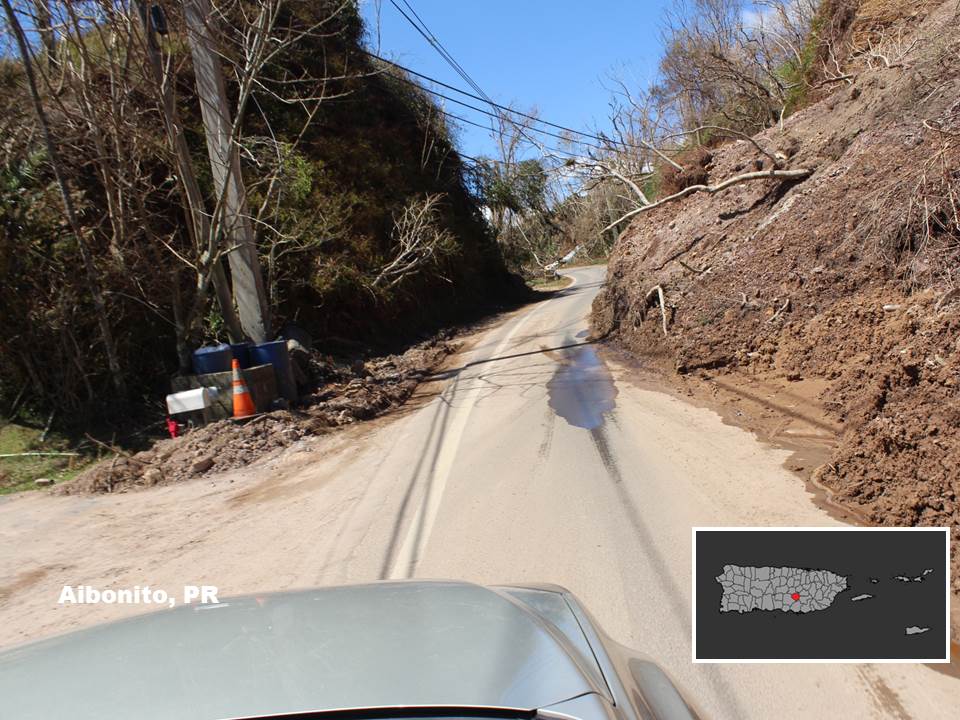
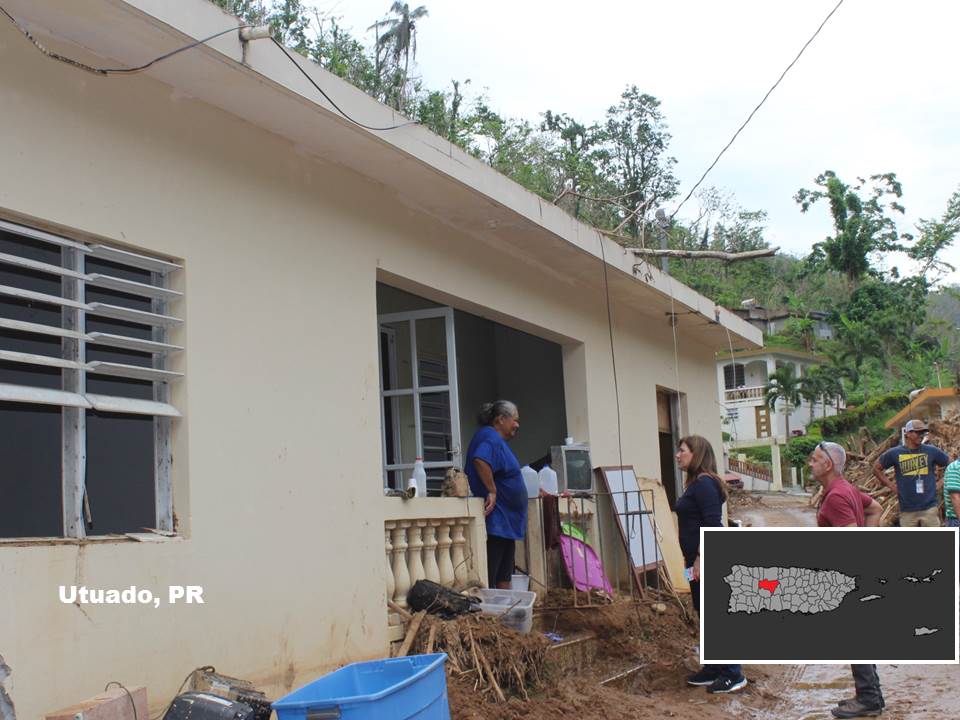
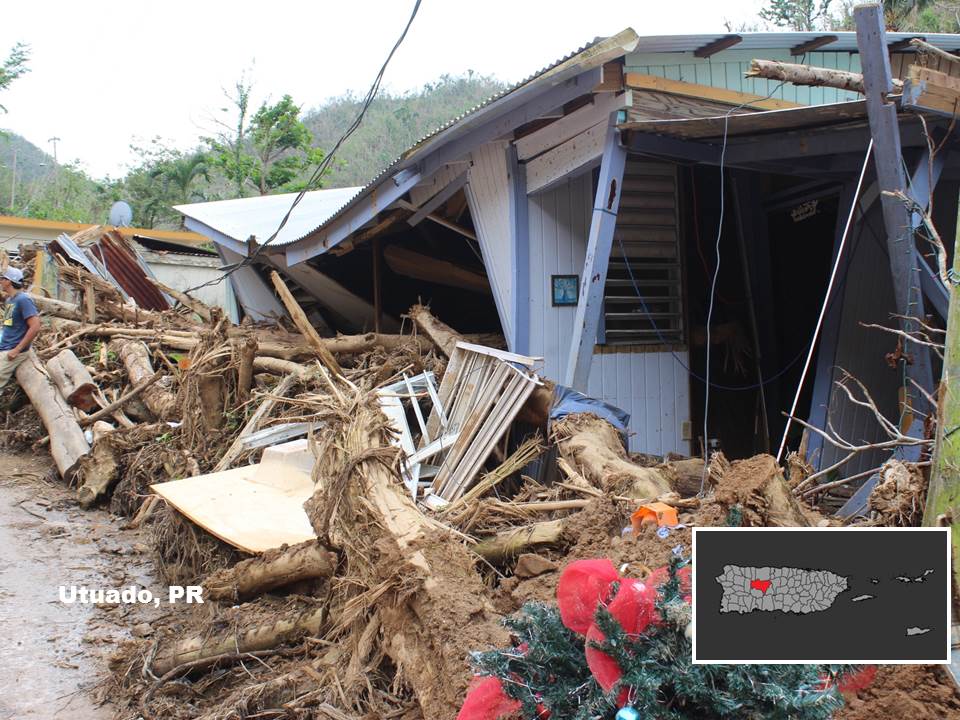
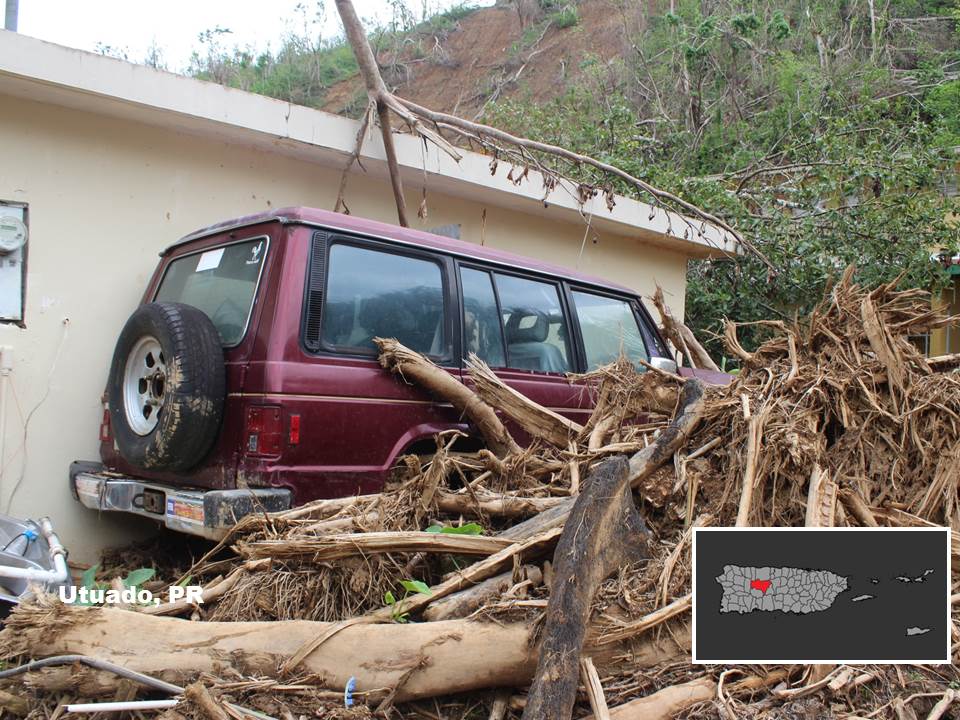
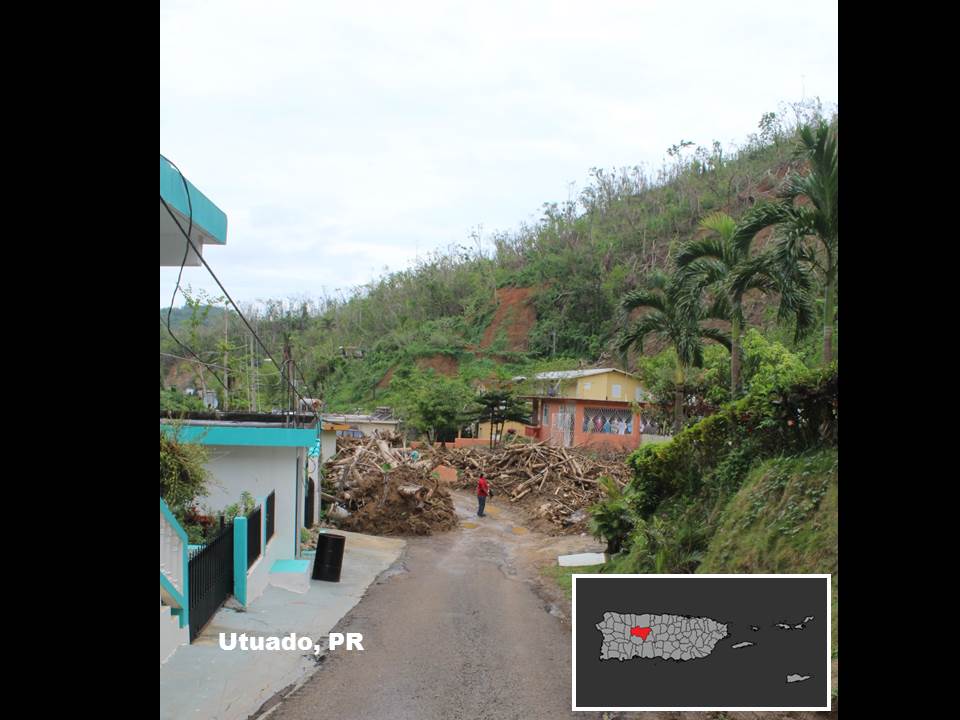
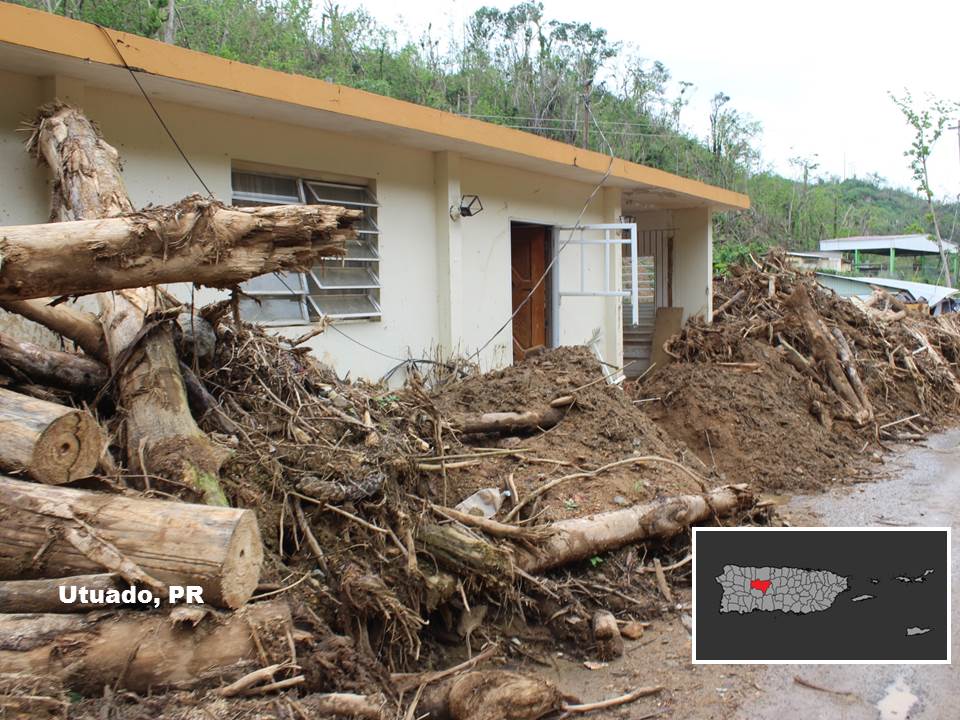
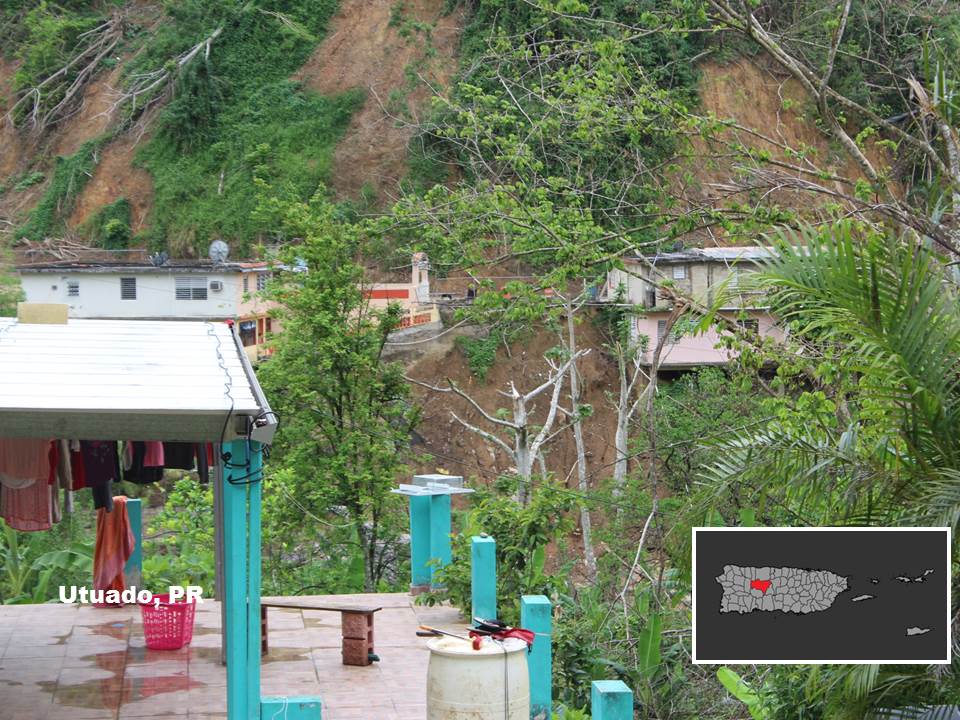
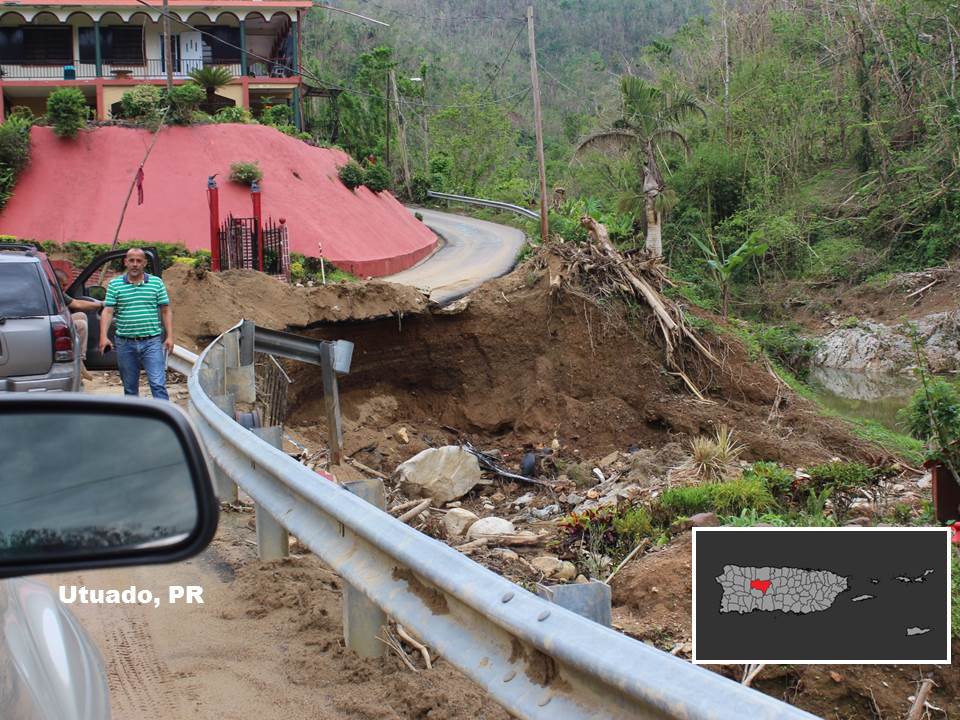
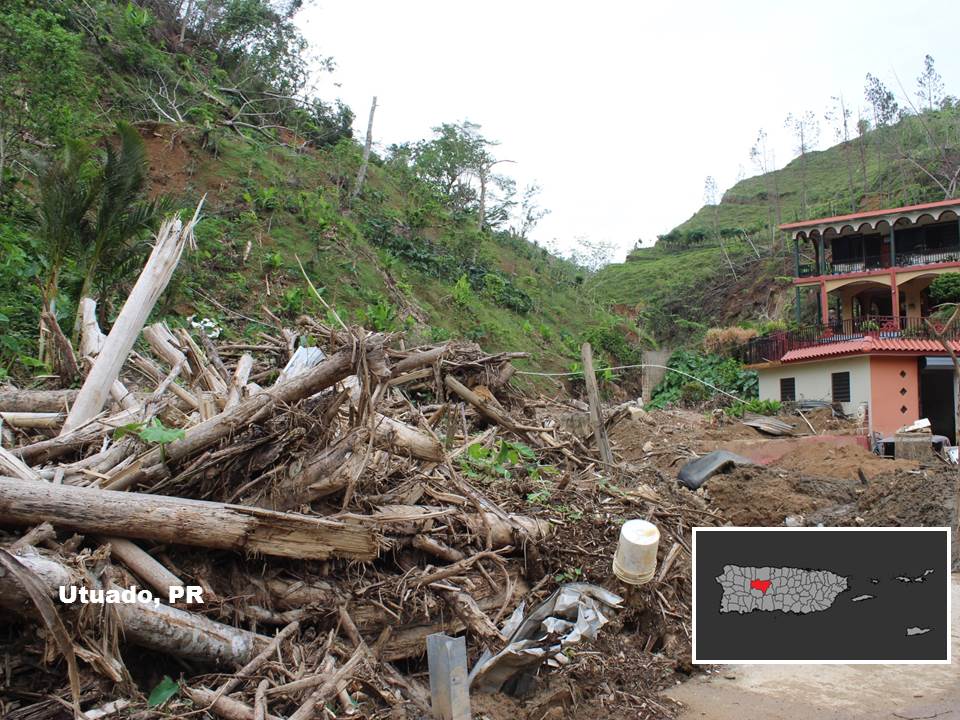
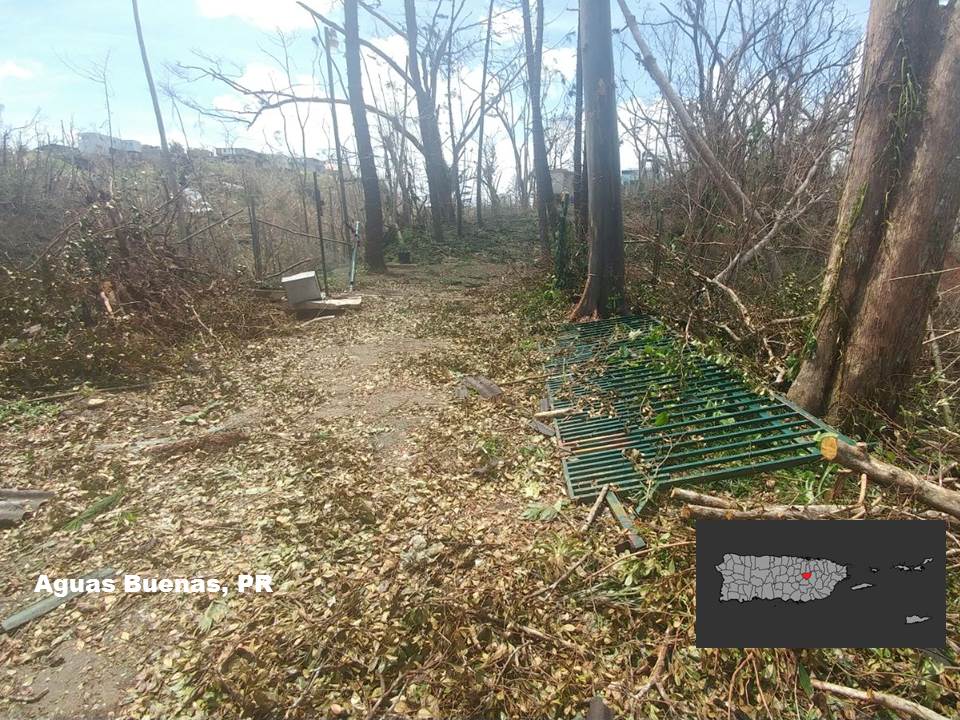
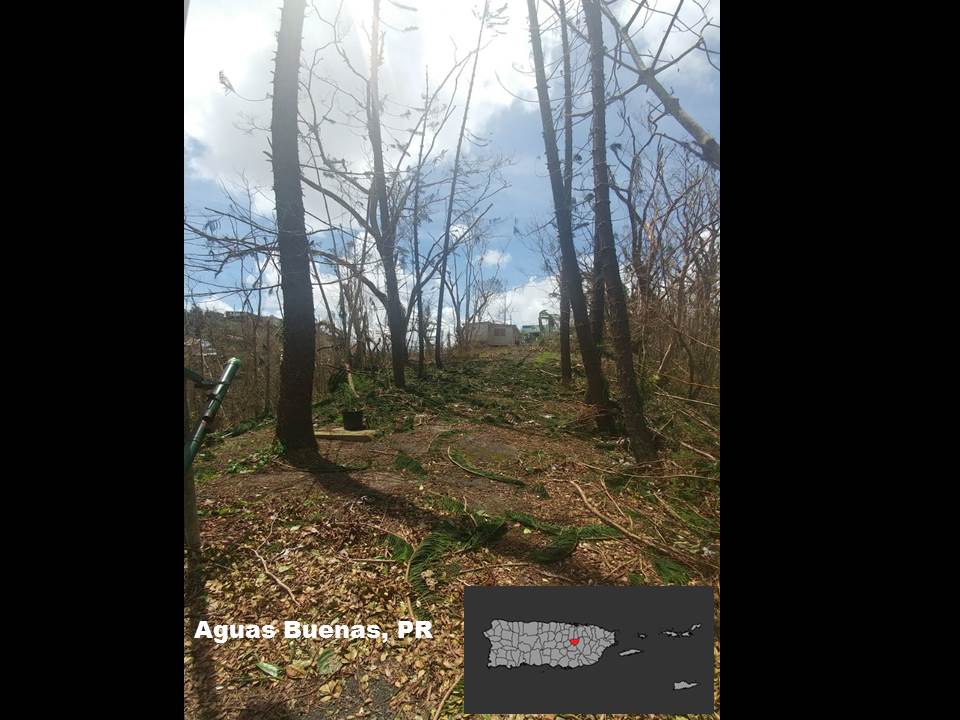
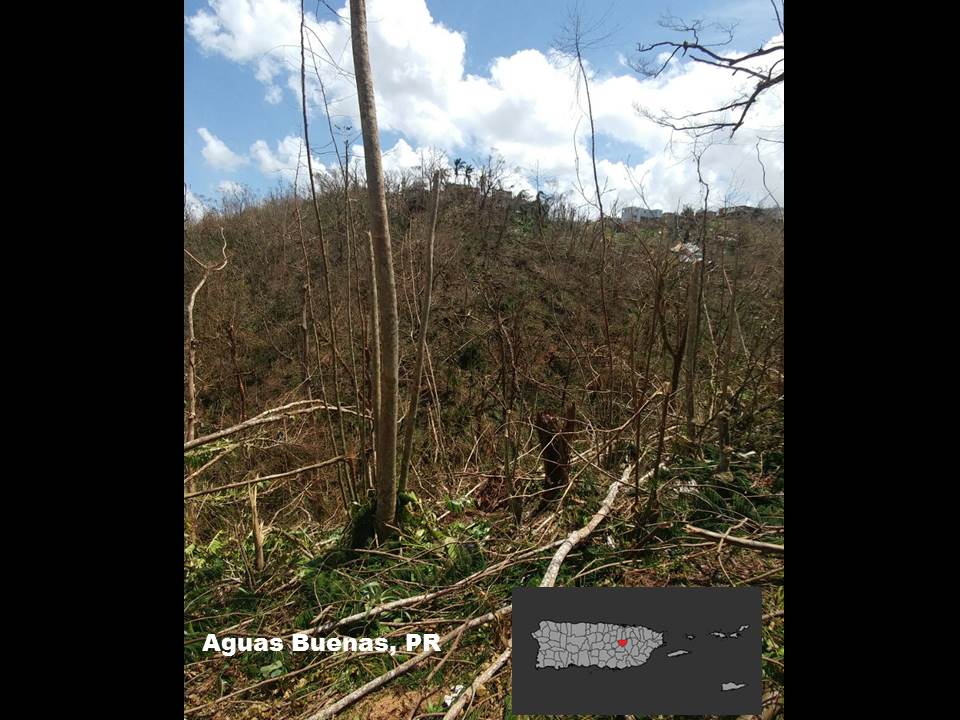
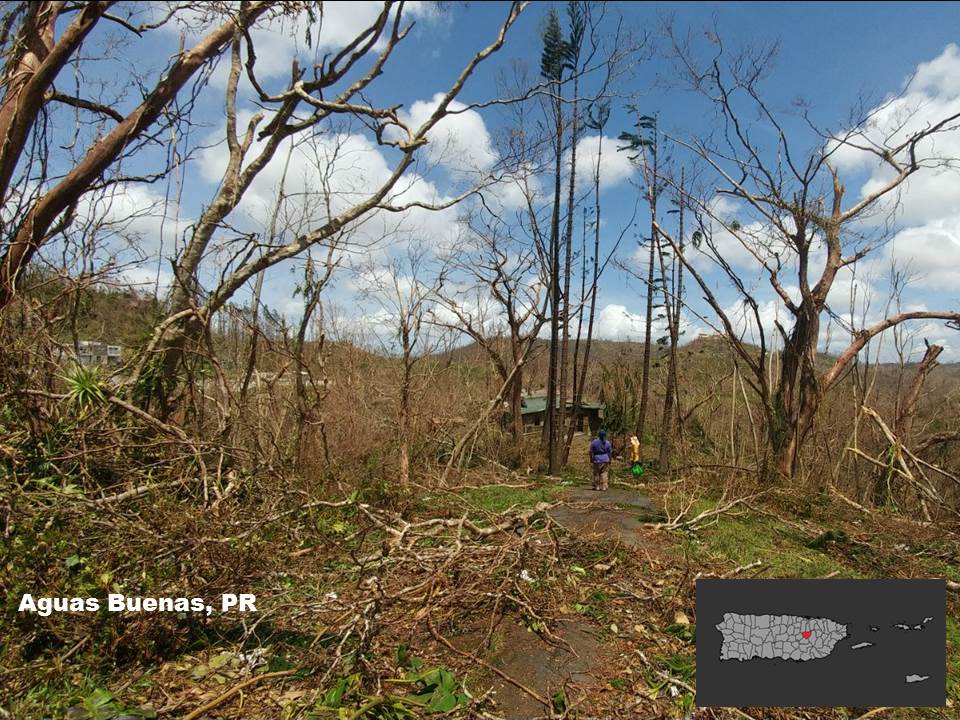
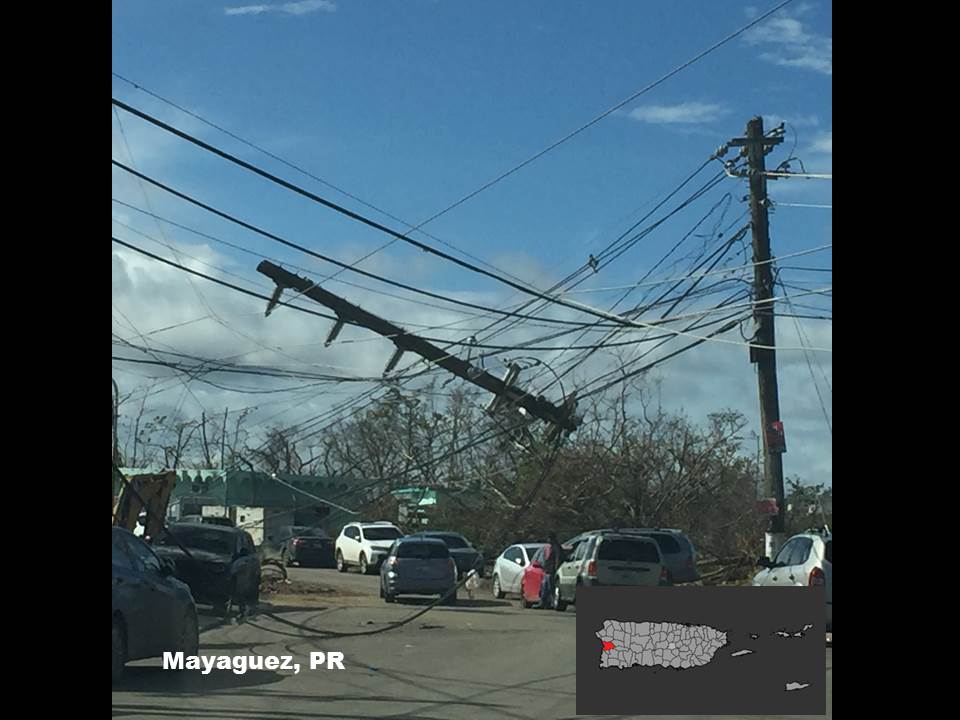
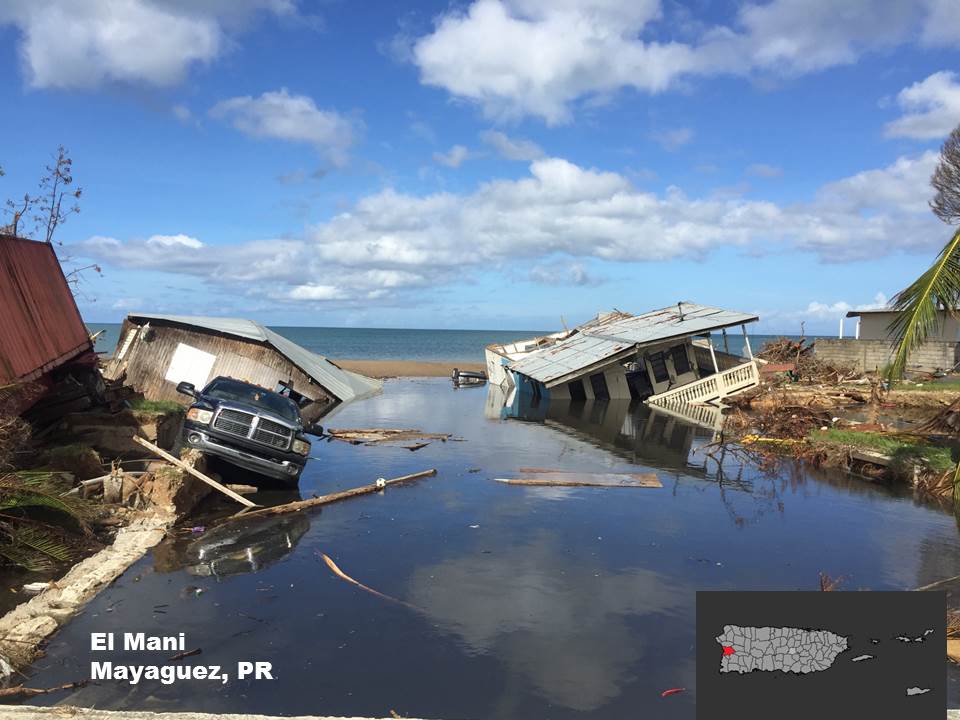
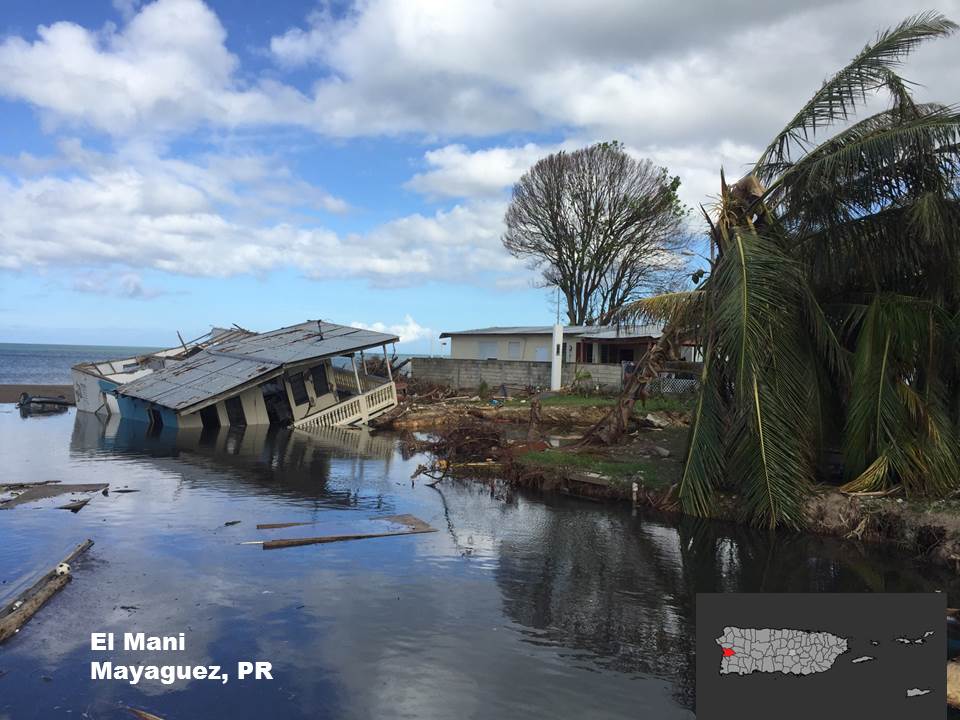
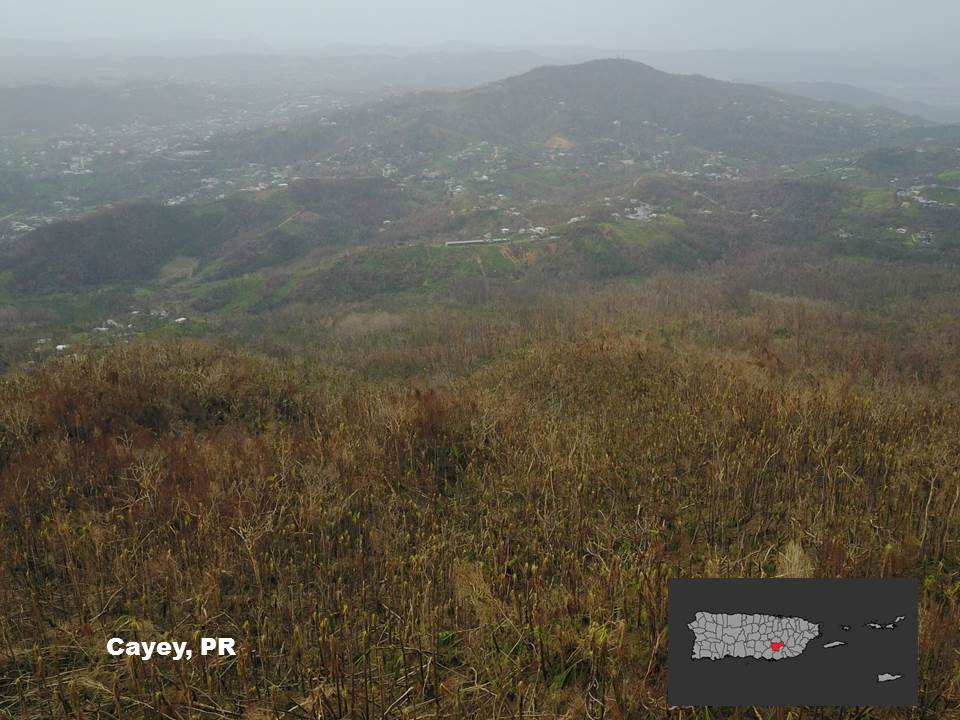
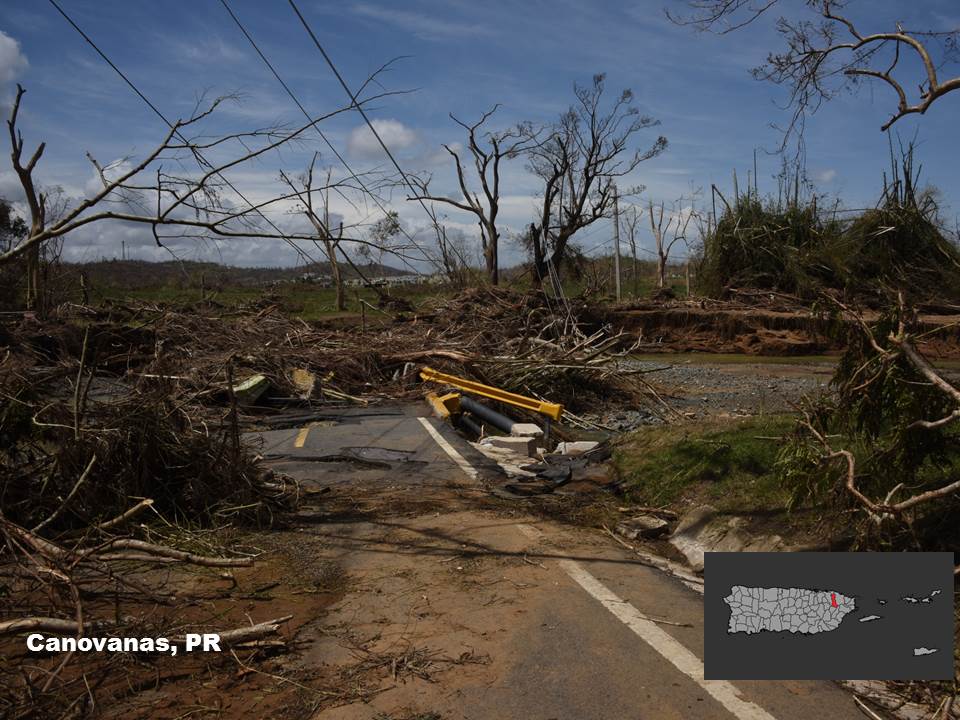
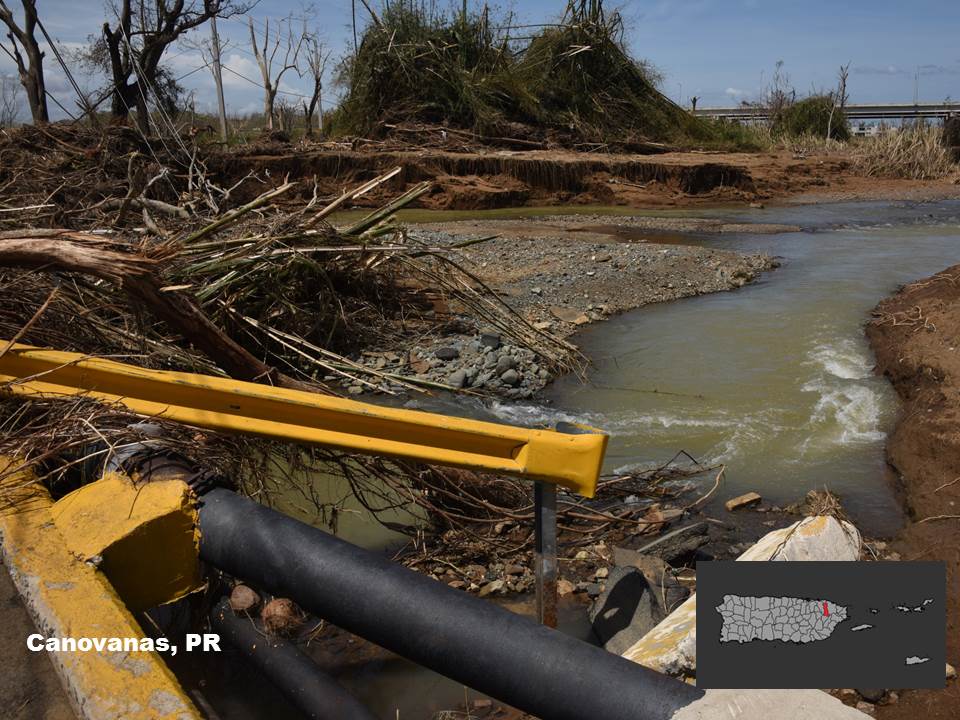
During a preliminary survey of areas along the path of Hurricane Maria’s center, it was evident that catastrophic damage had occurred. Maria’s strong winds spread large amounts of debris across the entire area. All full trees U.S. Virgin IslandsSt. Croix : Among all the U.S. Virgin Islands, St. Croix was the most affected by Maria. Maria’s center passed just south of the island, locating the island under the outer portion of the northern eyewall. Hurricane wind damage was evident across the entire island with many fallen trees, signs, roof damage and complete destruction of many wooden houses. Excessive rainfall generated significant flooding and landslides across the island of St. Croix. St. Thomas & St. John: A few weeks before Maria, the islands of St. Thomas and St. John were directly affected by the eyewall of Major Hurricane Irma. Surveys done before Maria showed most of the roofs, signs and trees had been already destroyed or damaged. Large amount of rainfall accumulations generated flooding and landslides across all the islands.
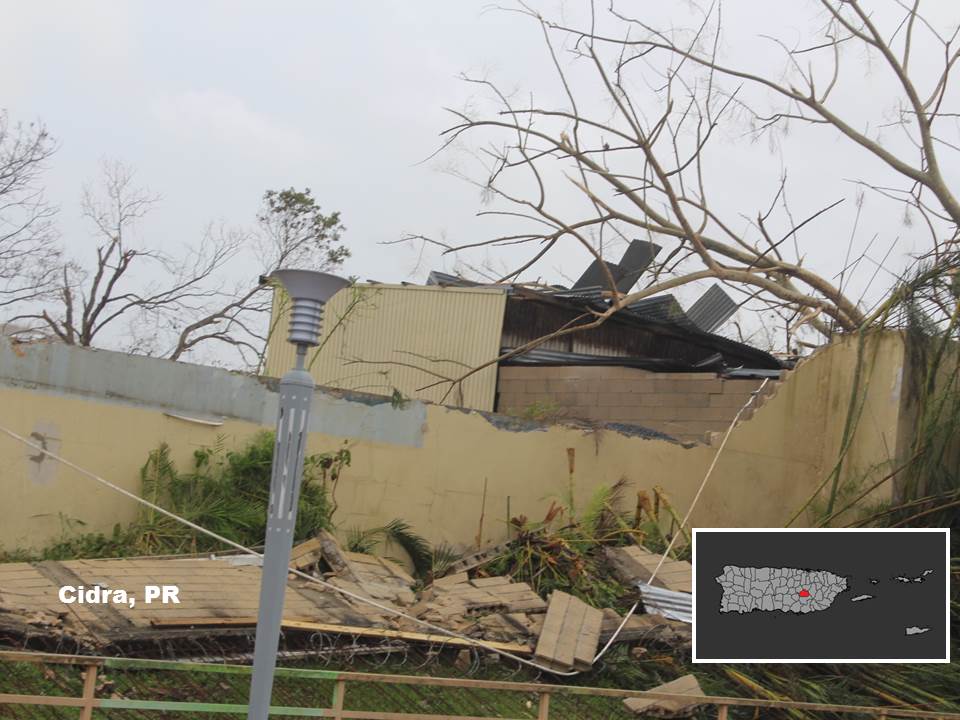
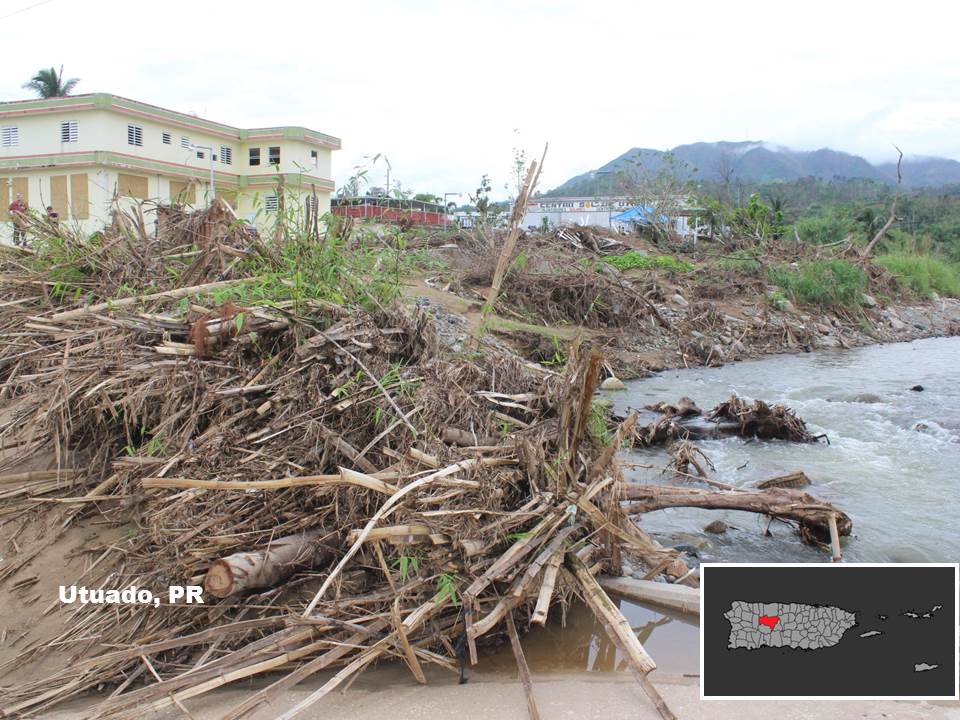
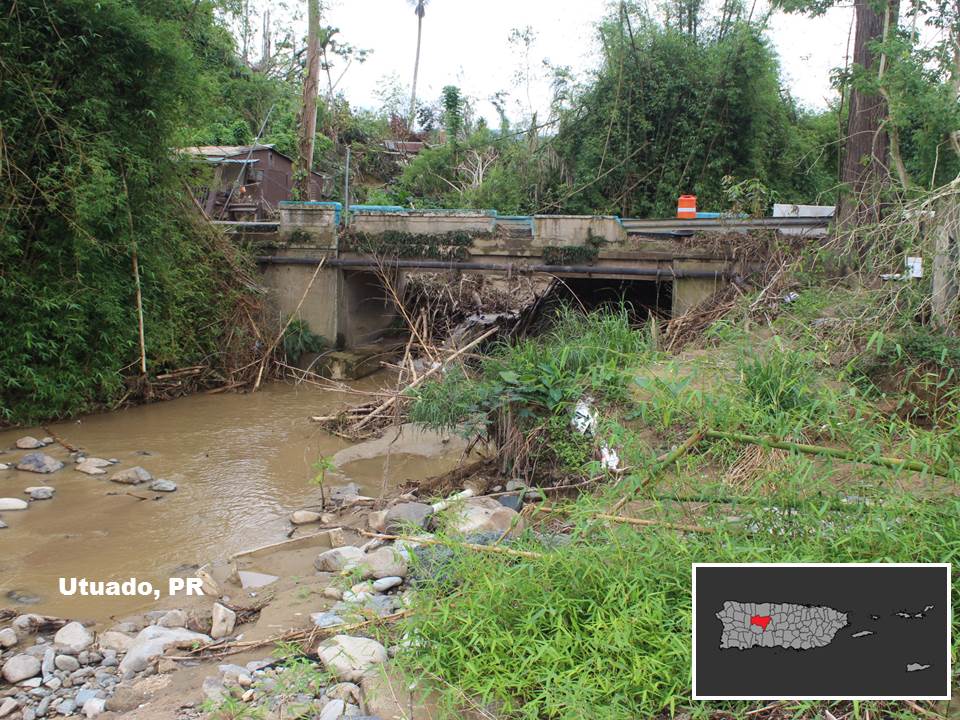
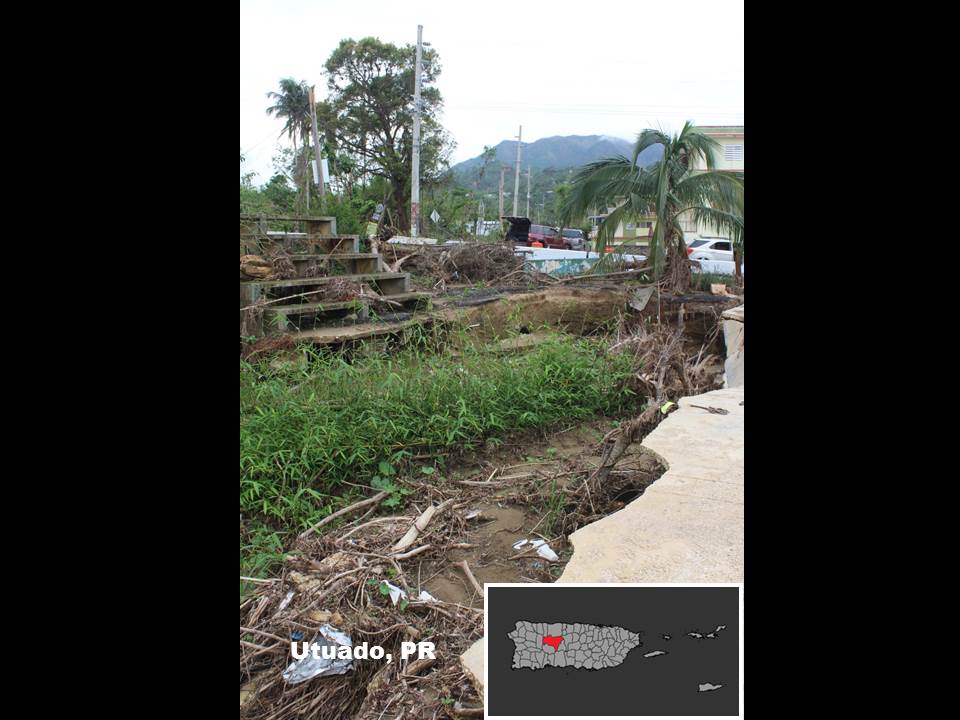
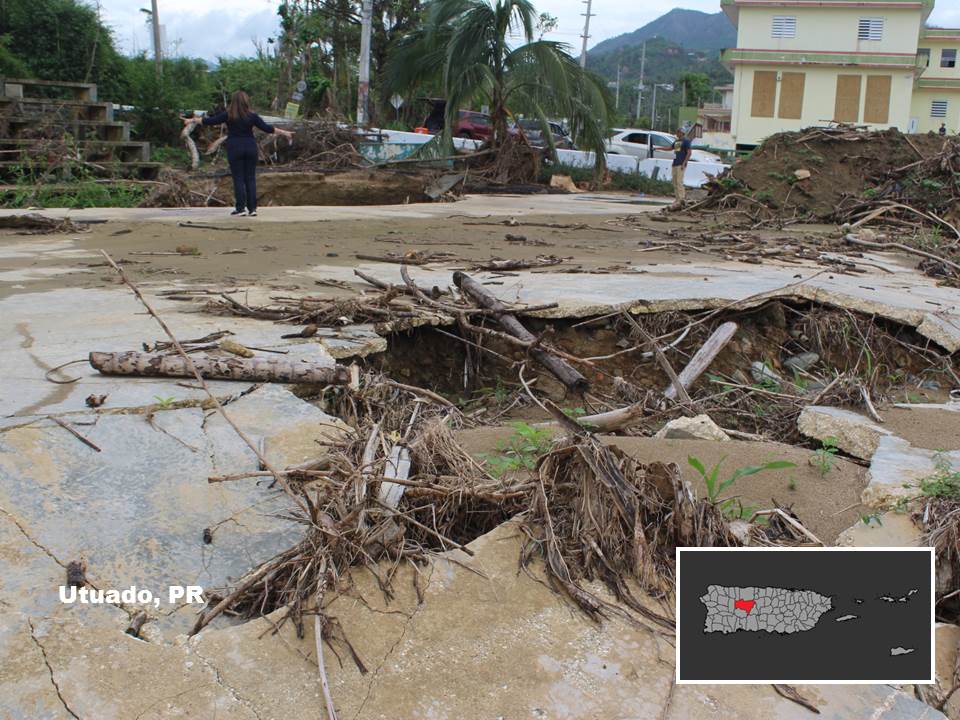
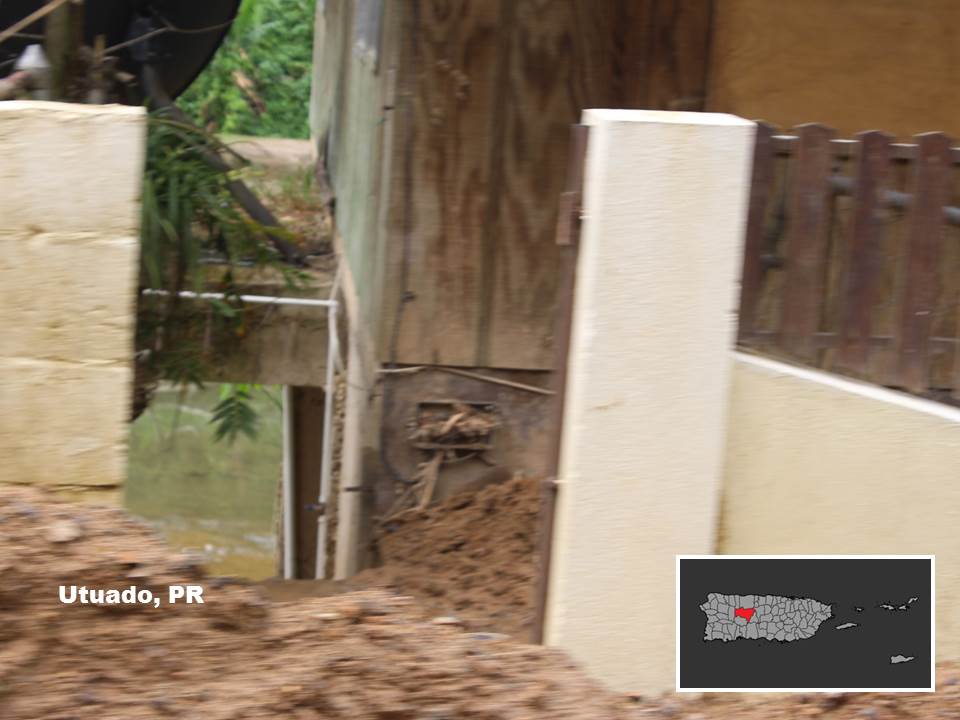
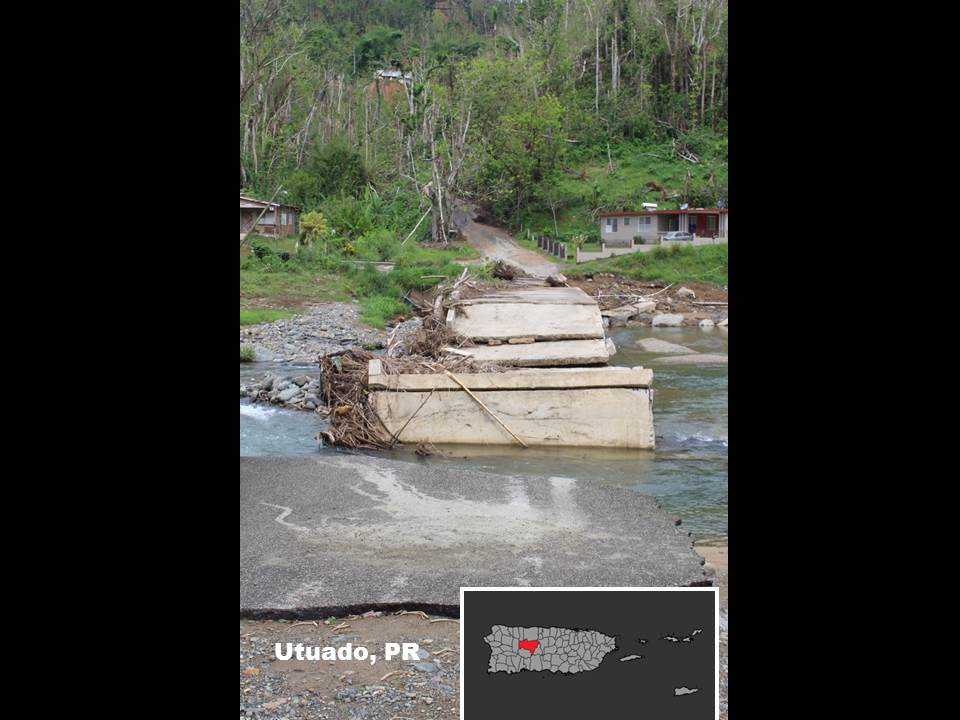
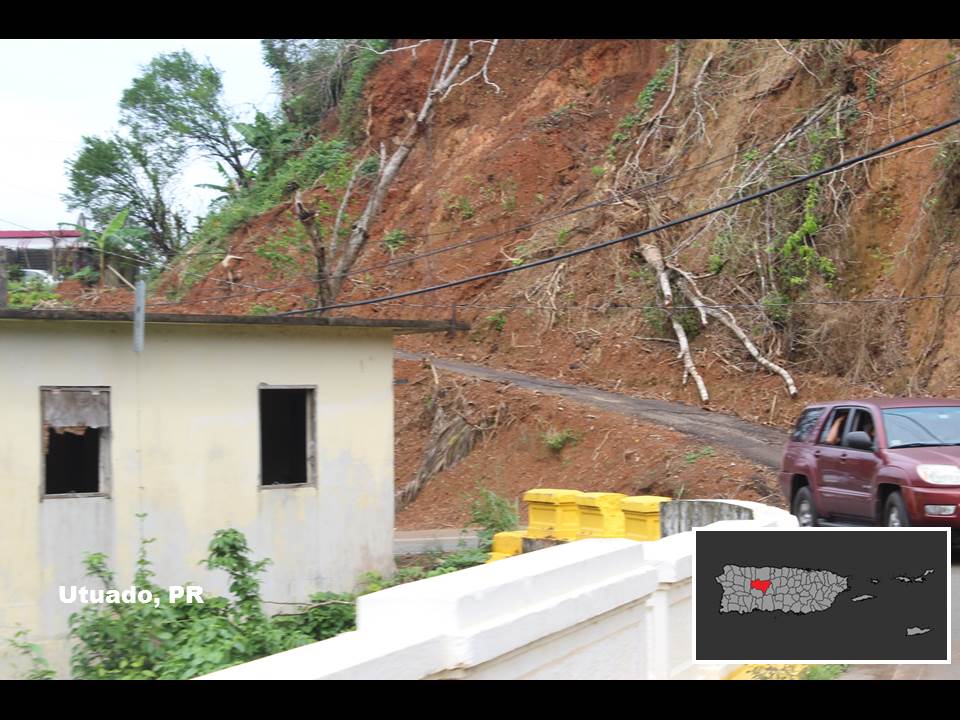
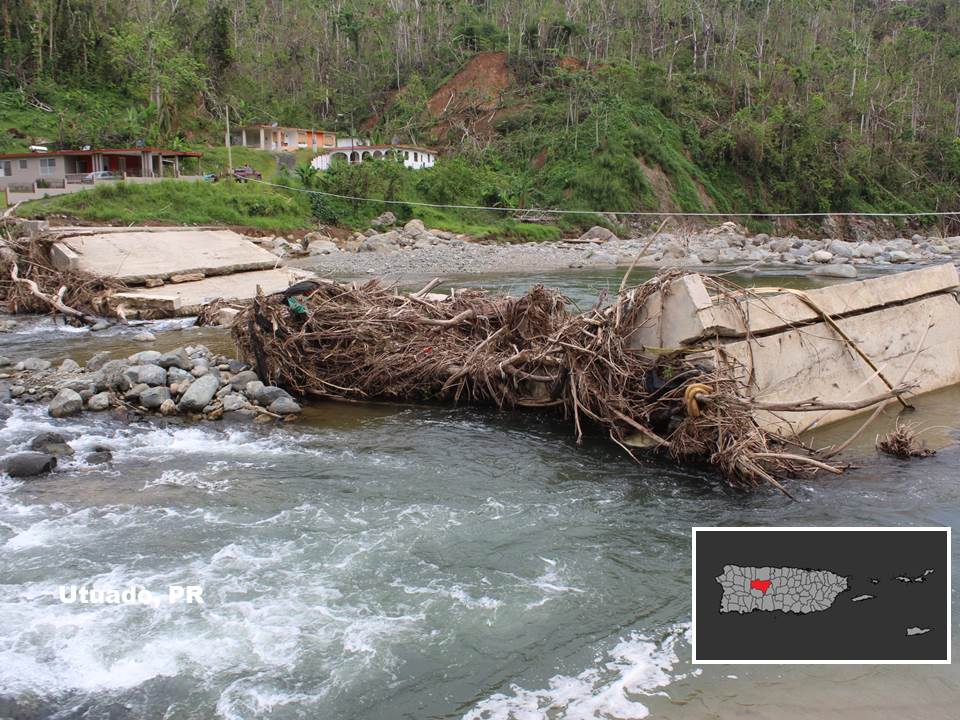
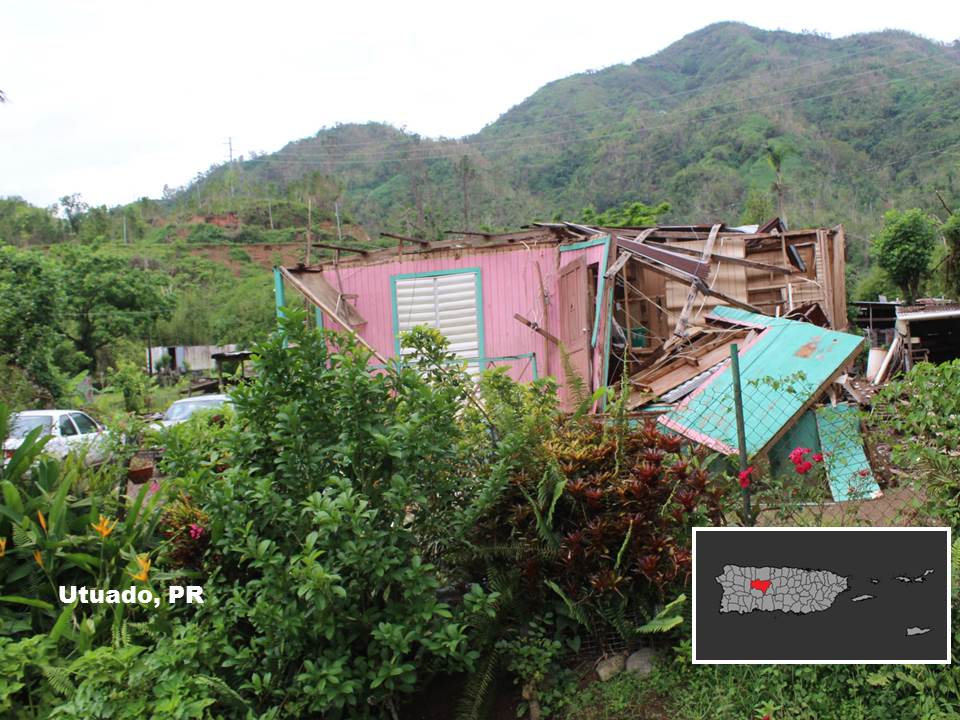
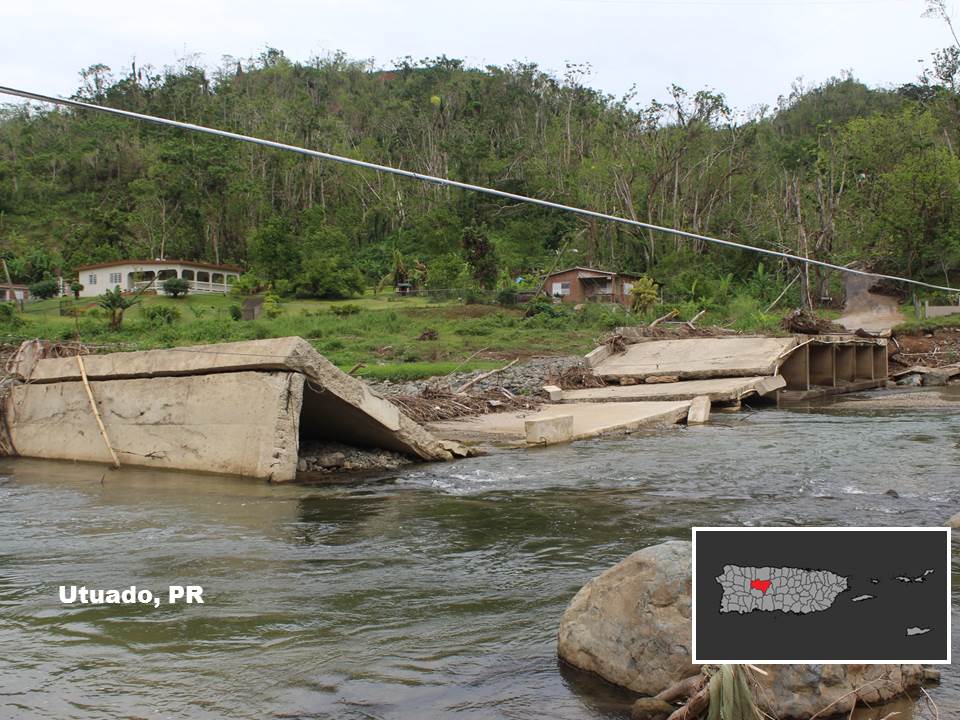
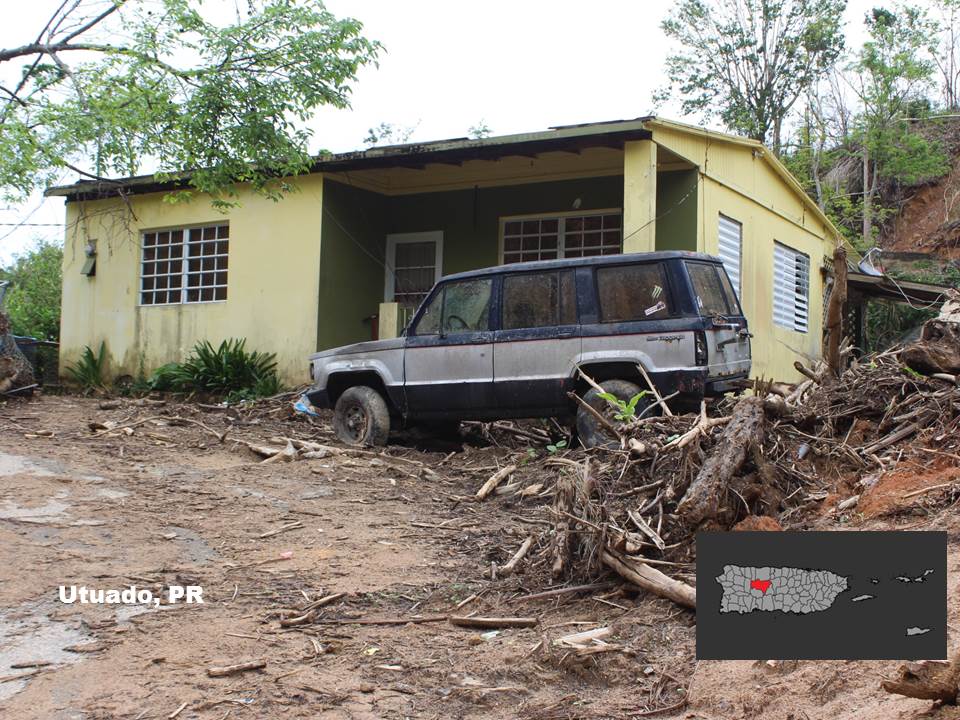
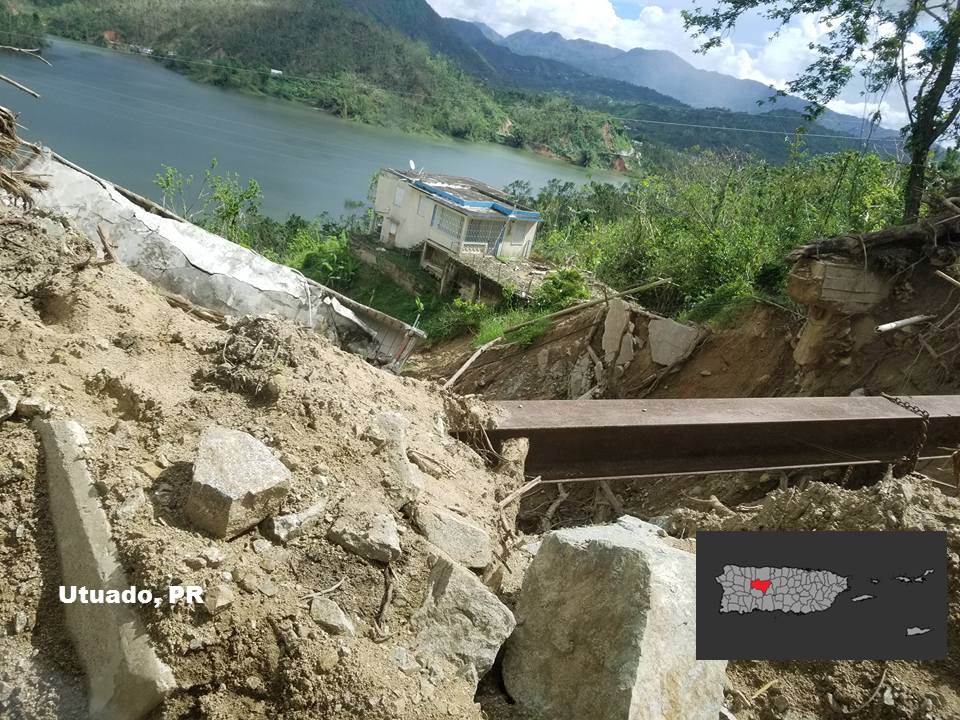
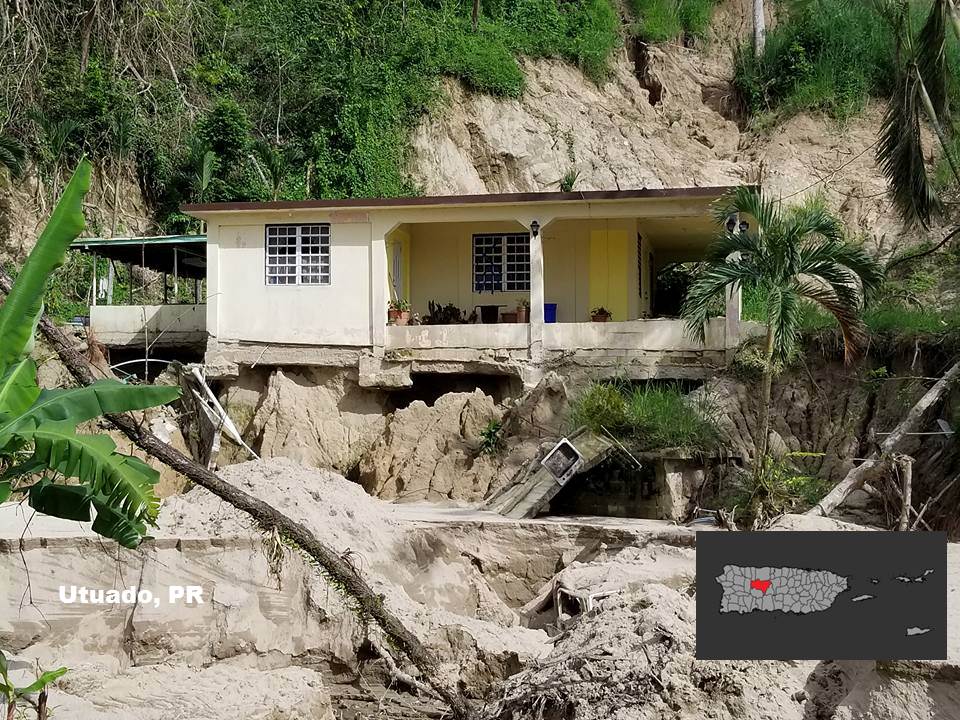
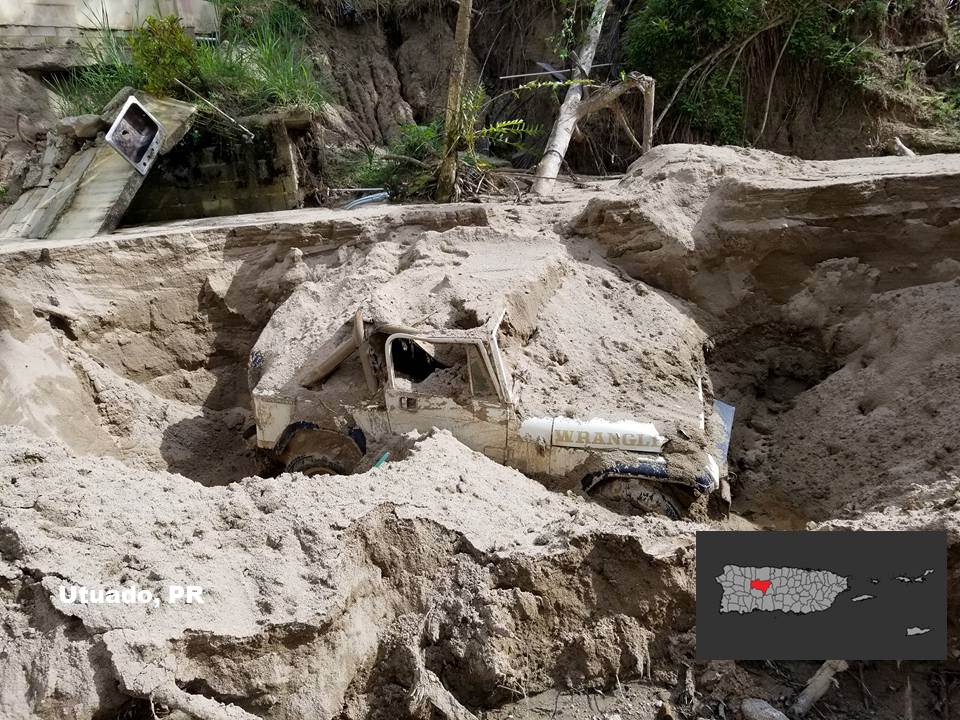
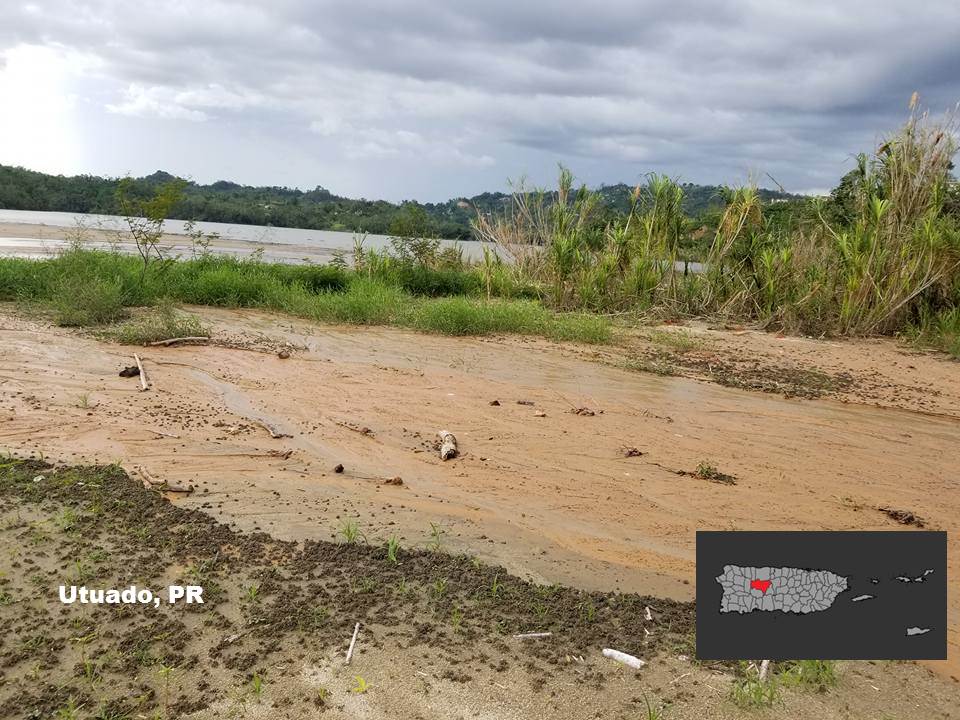
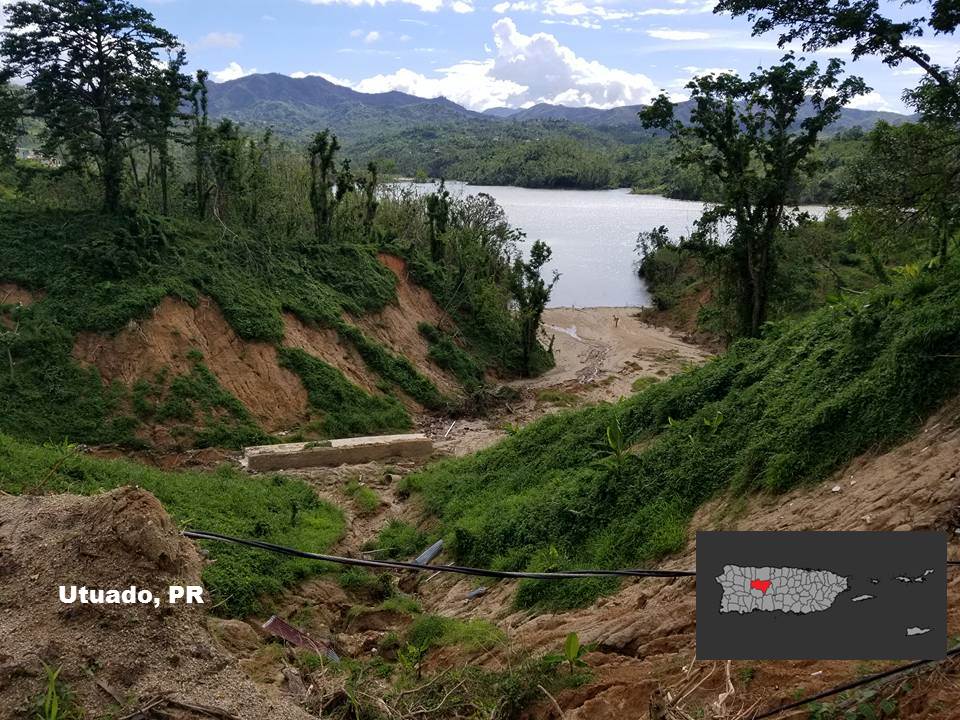
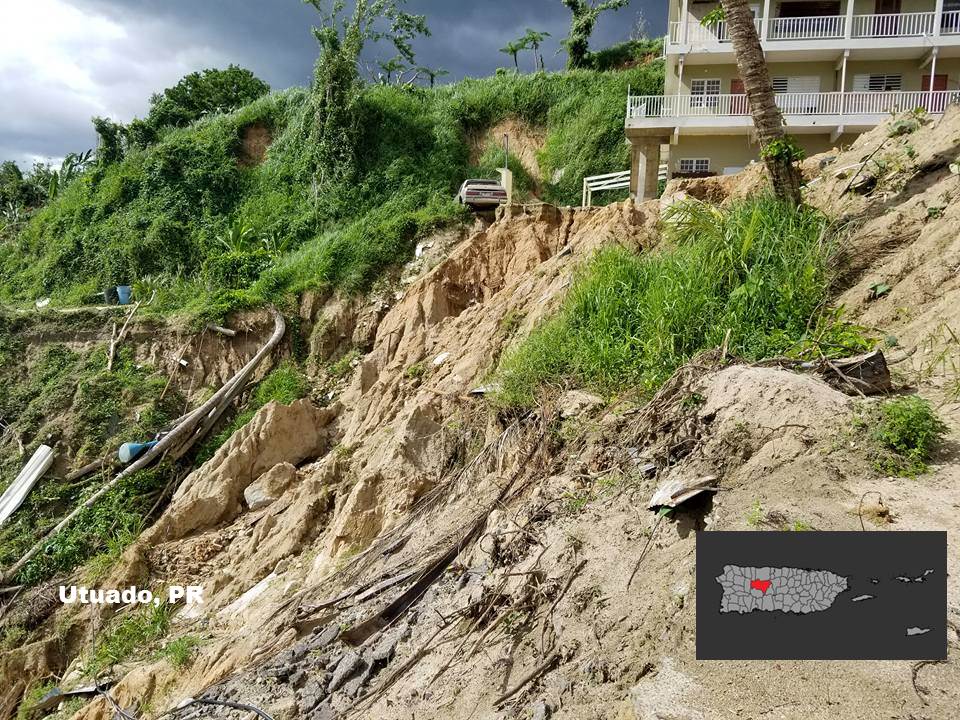
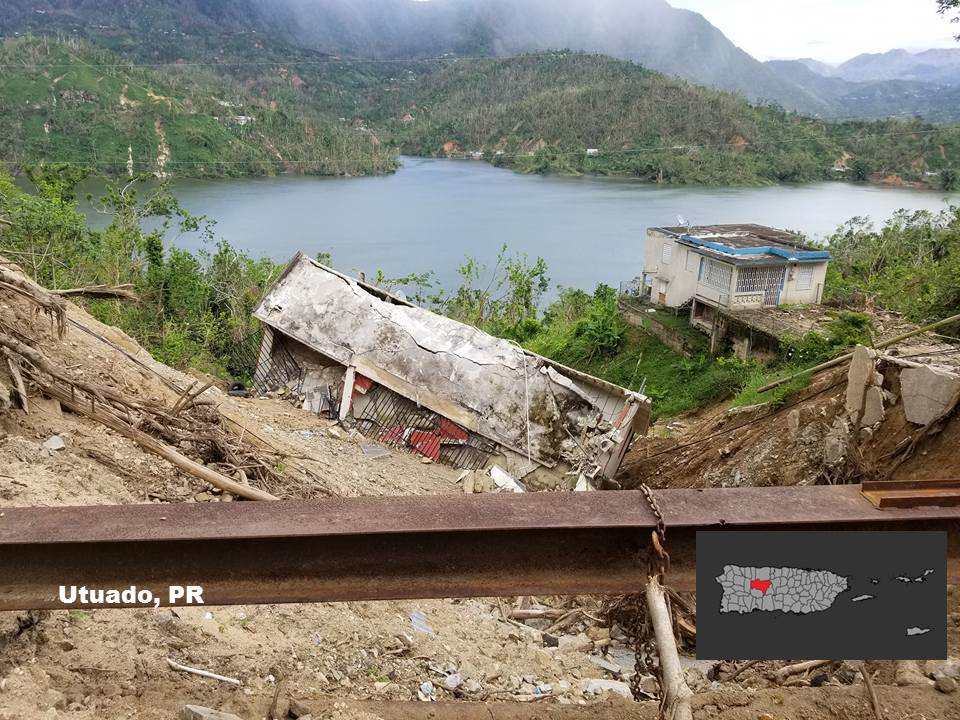
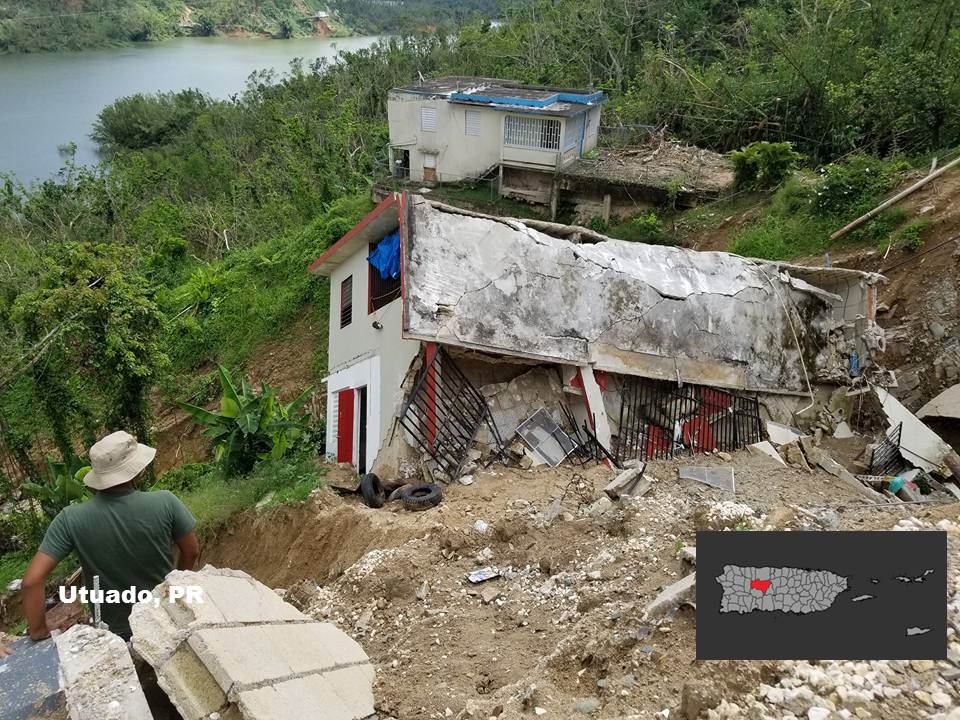
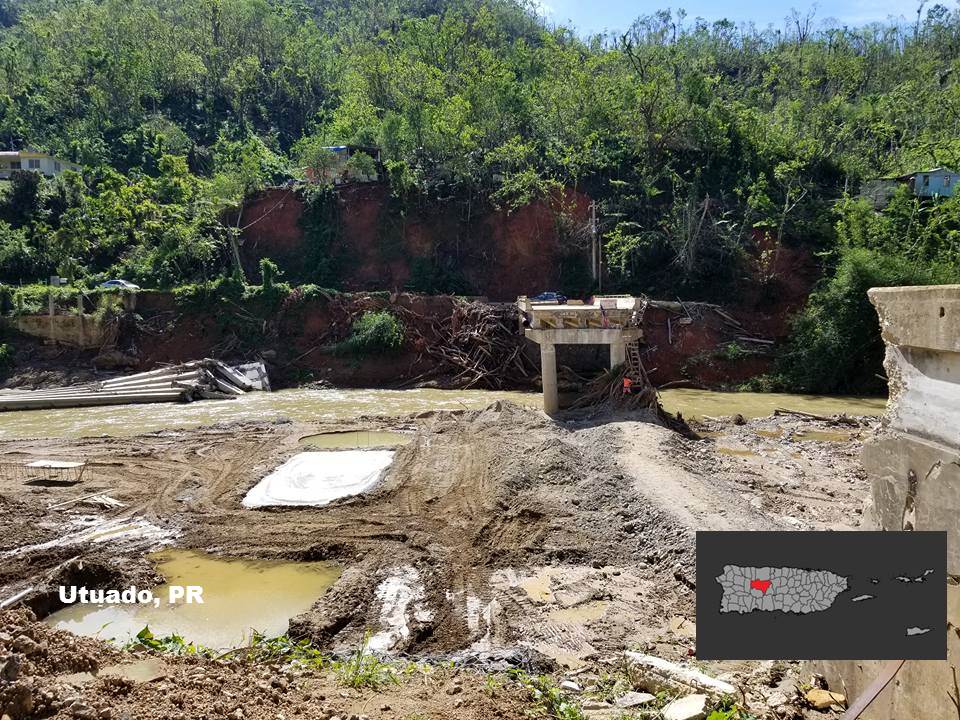
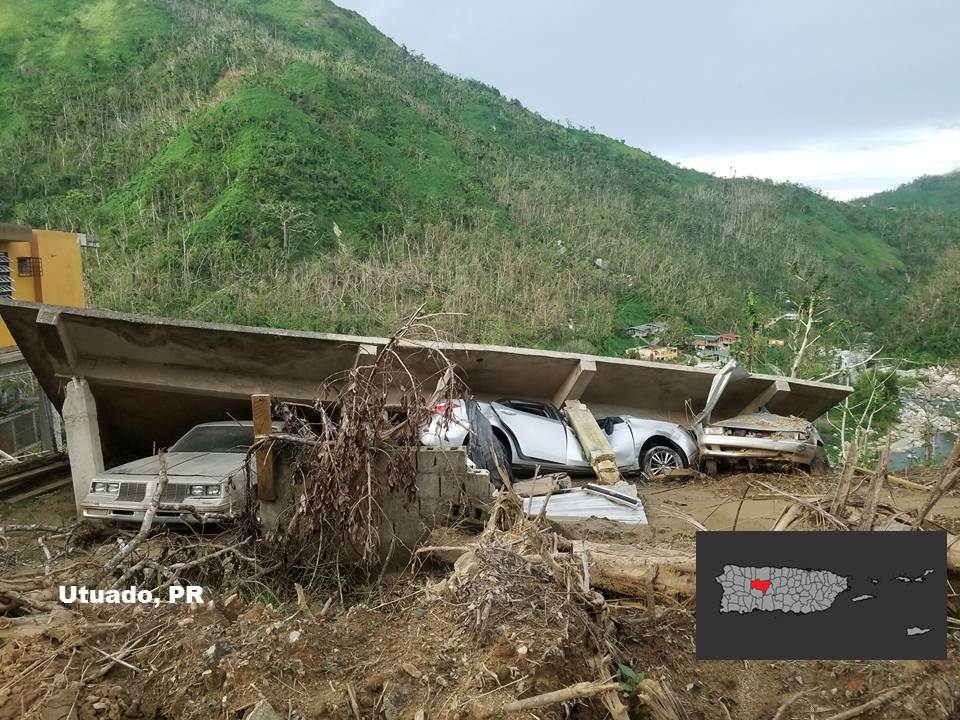
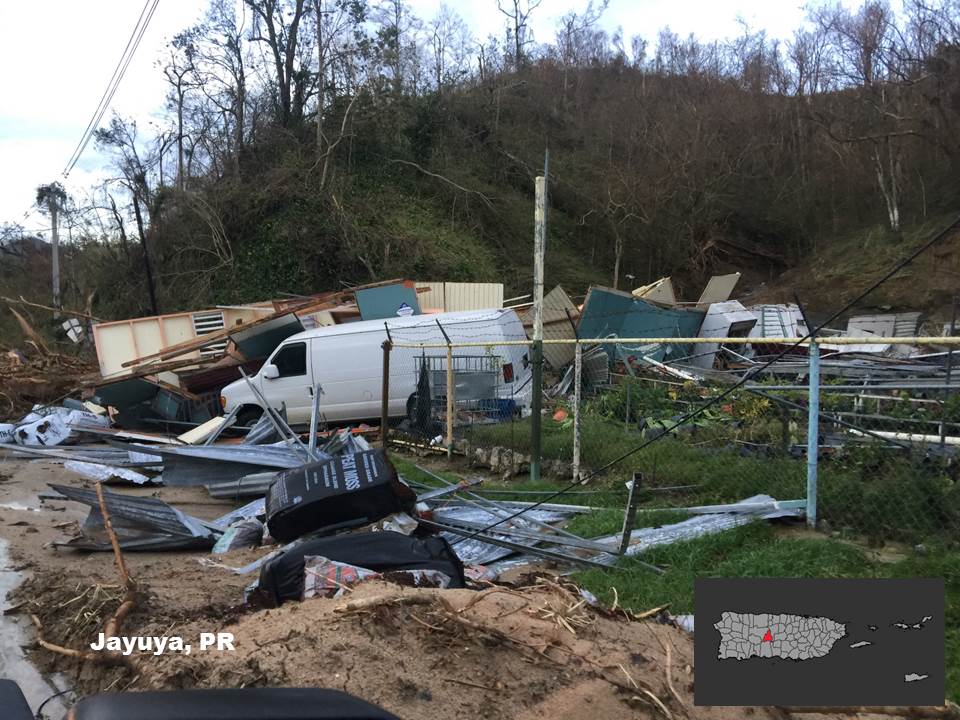
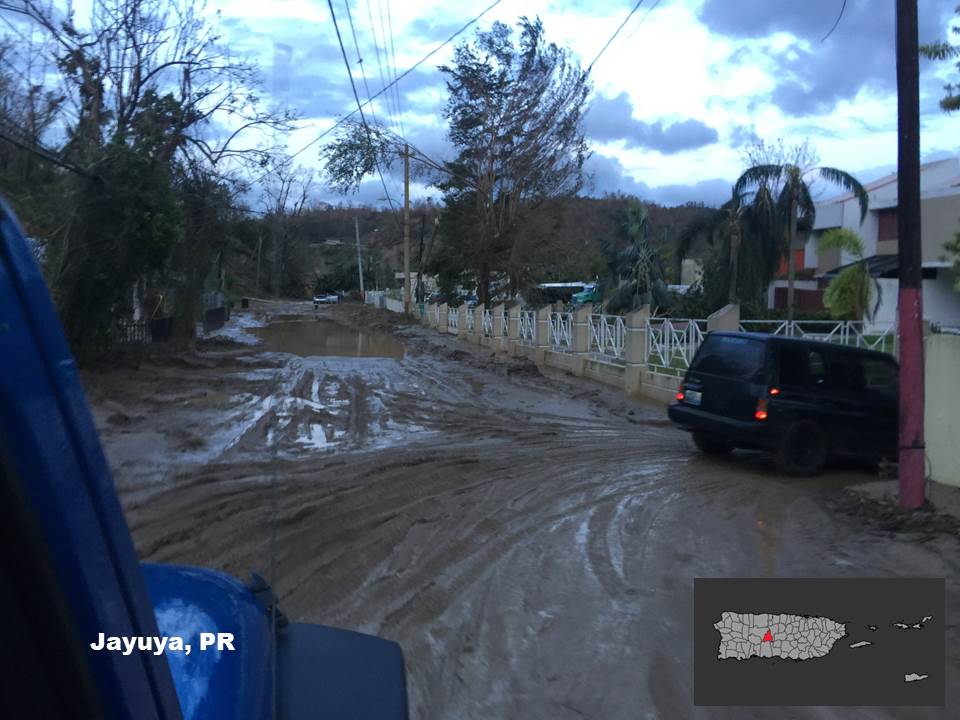
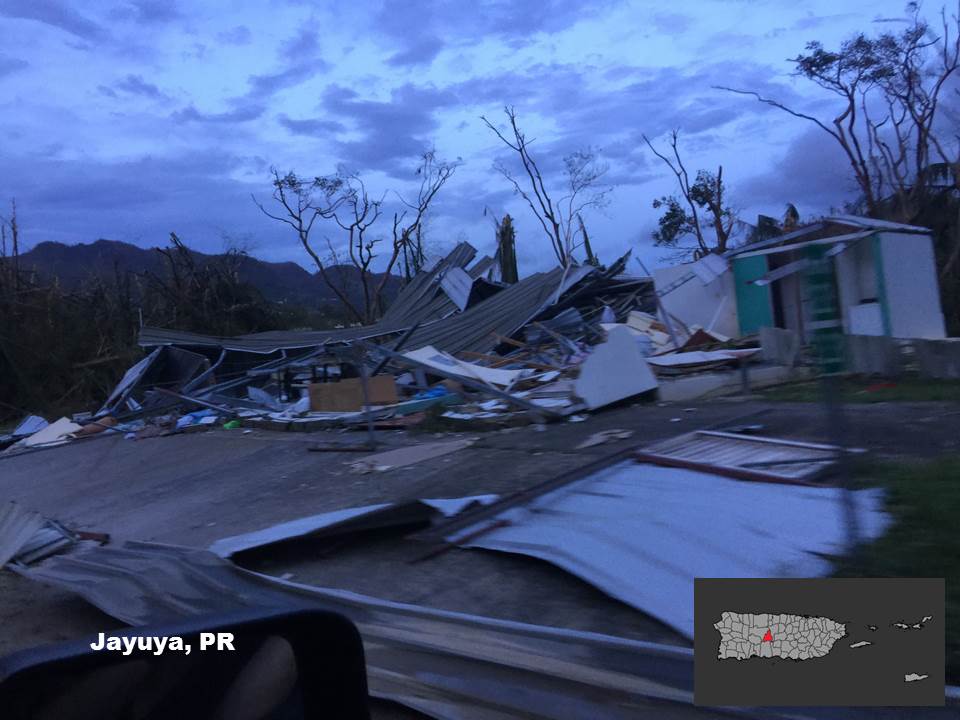
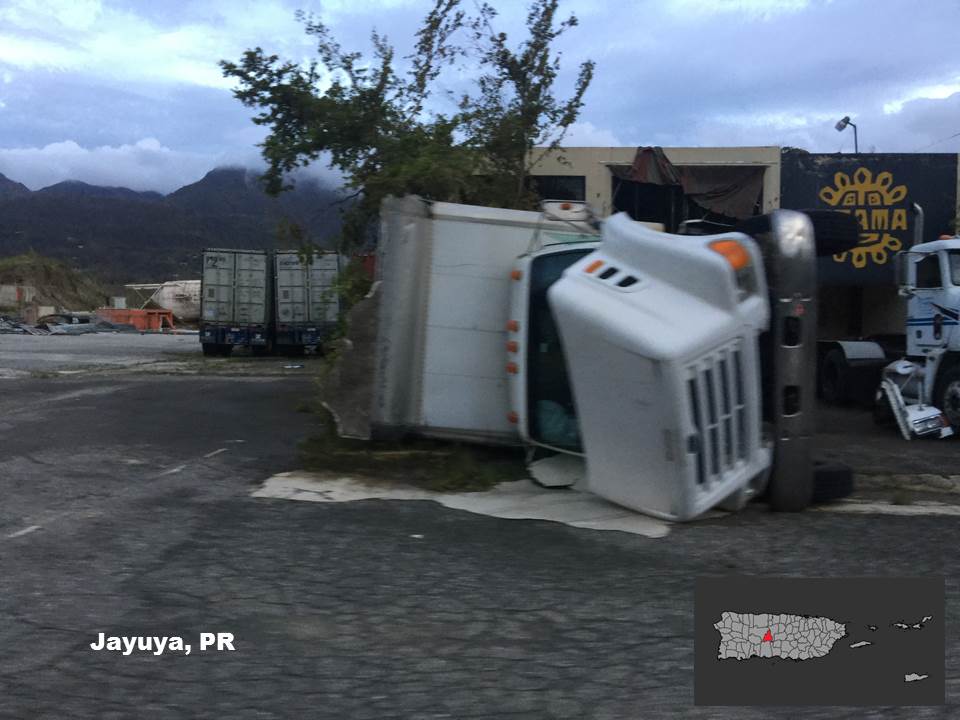
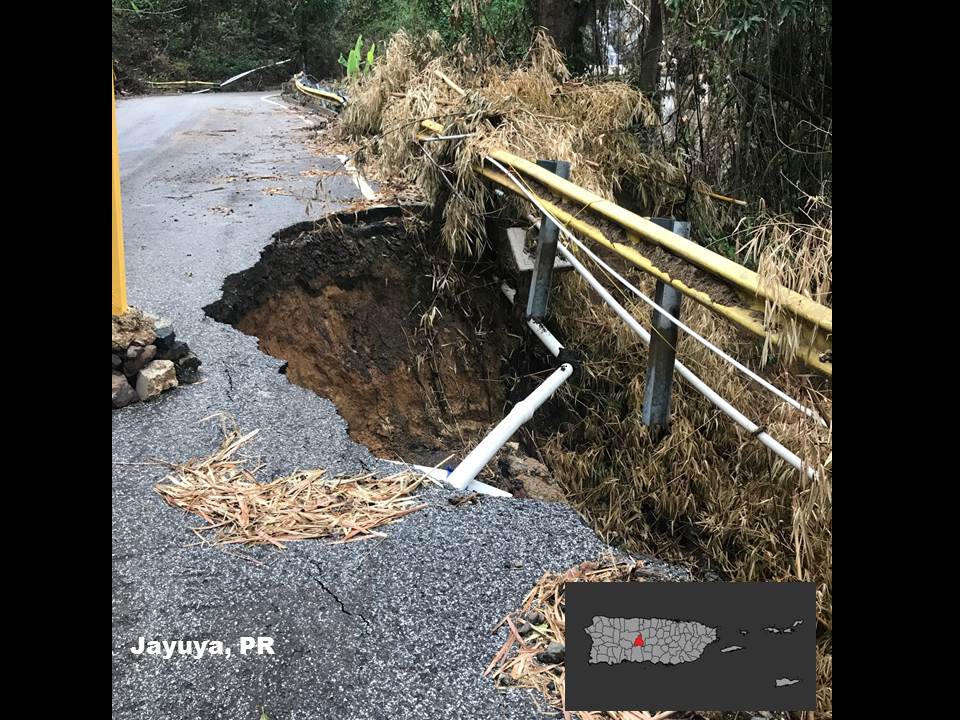
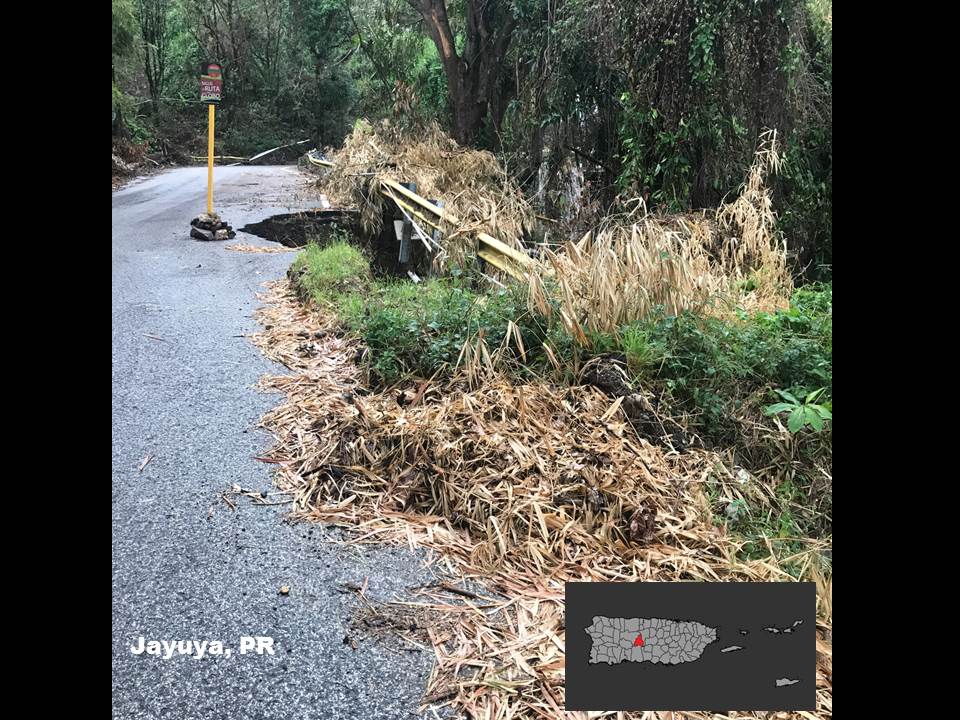
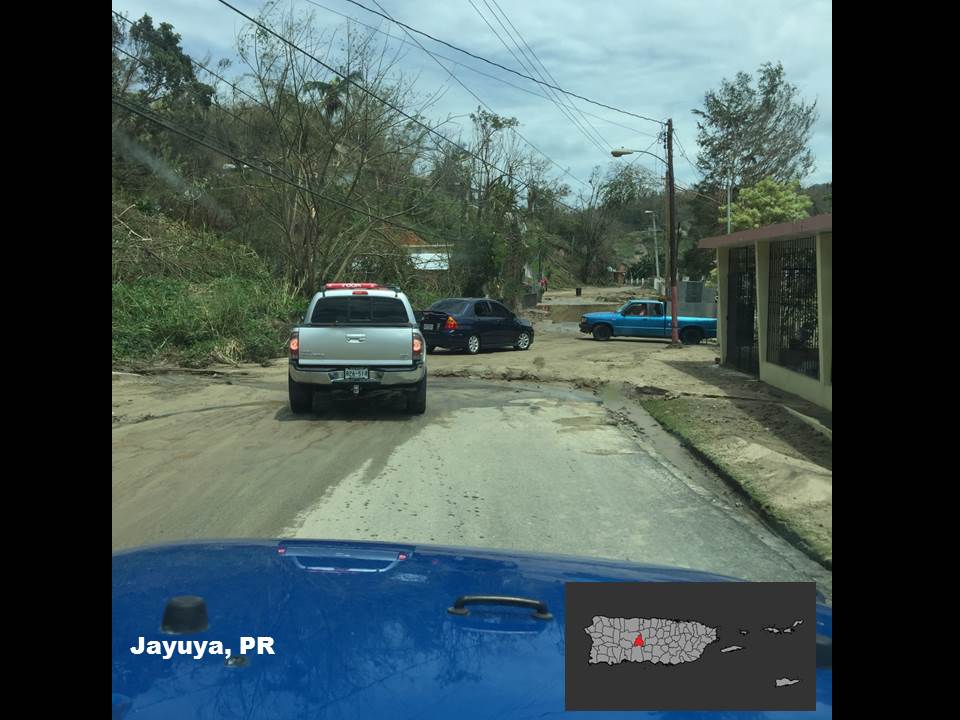
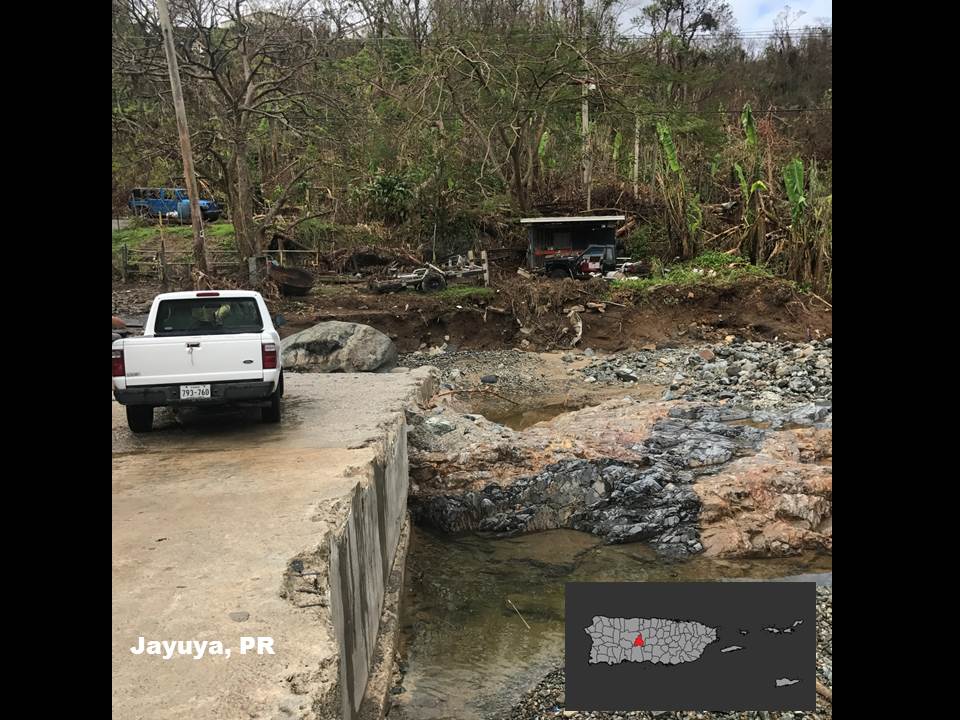
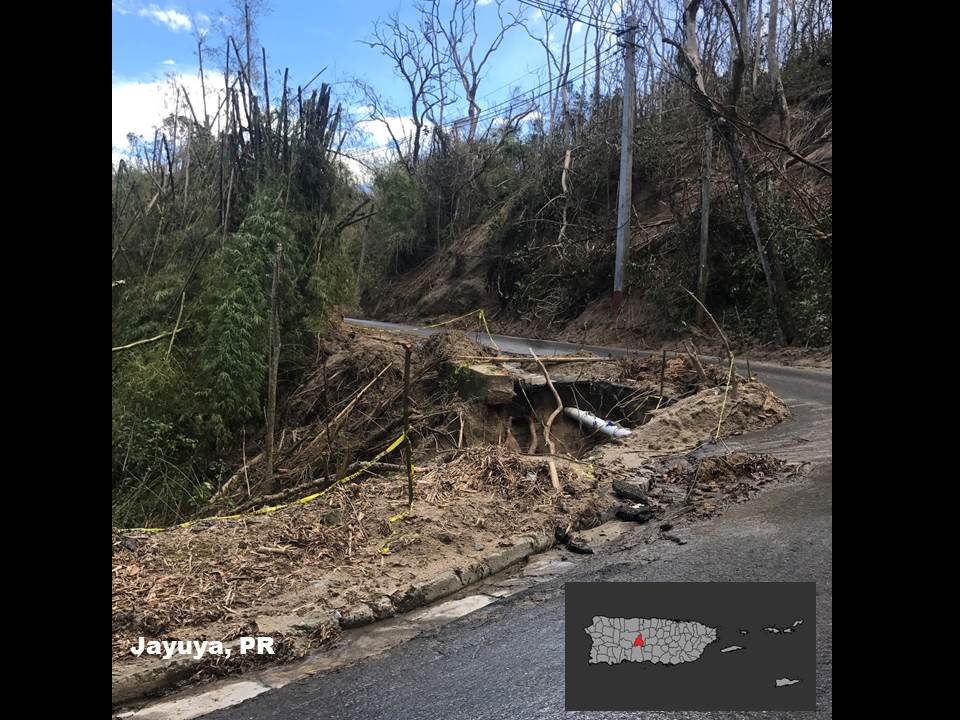
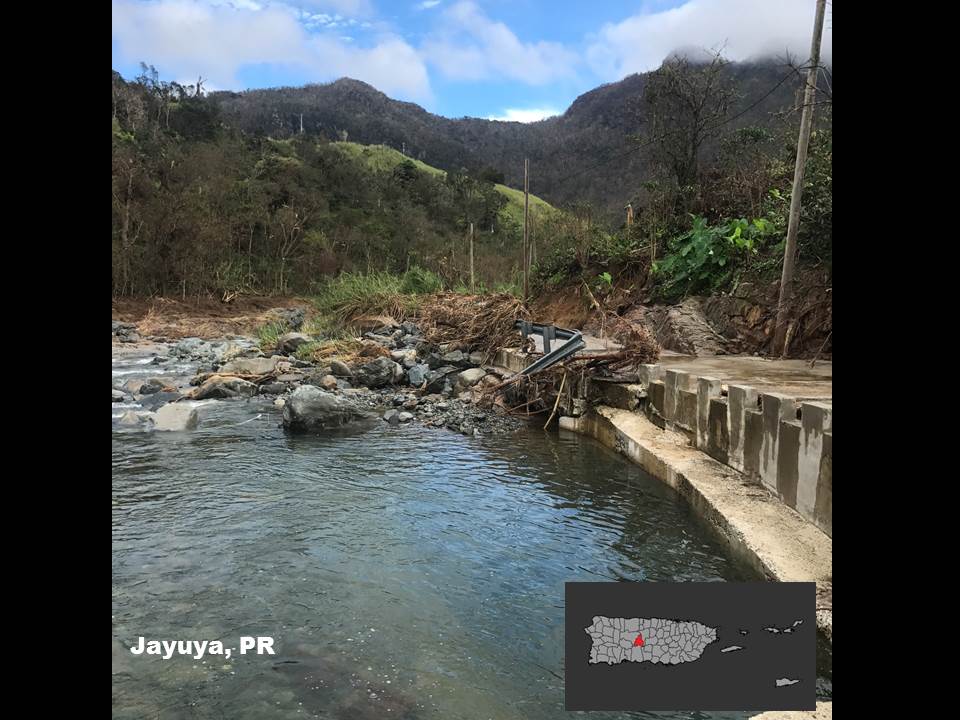
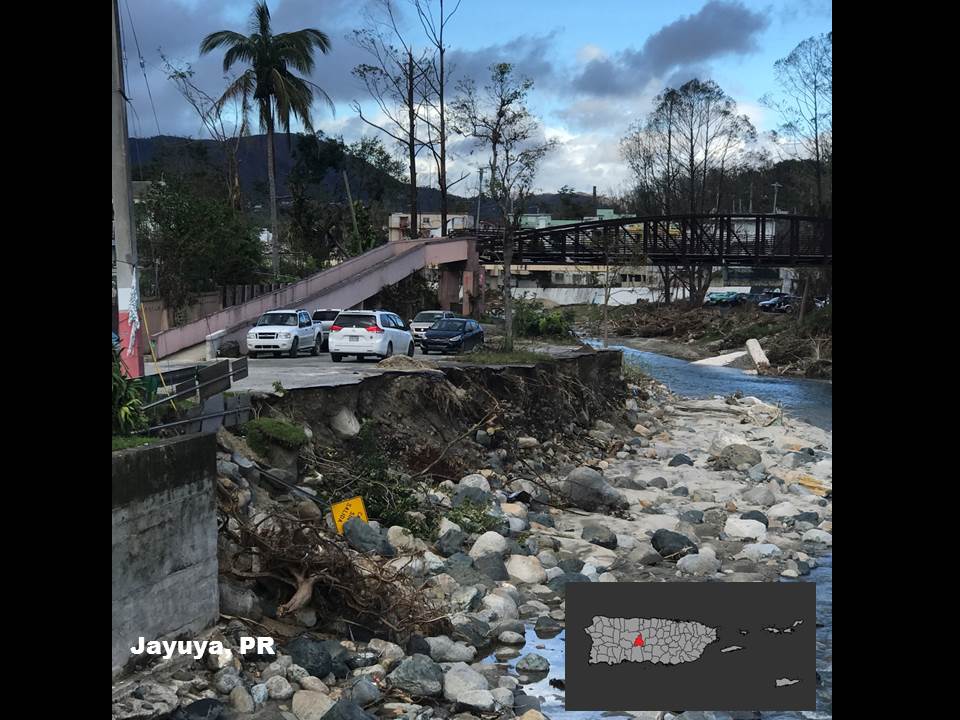
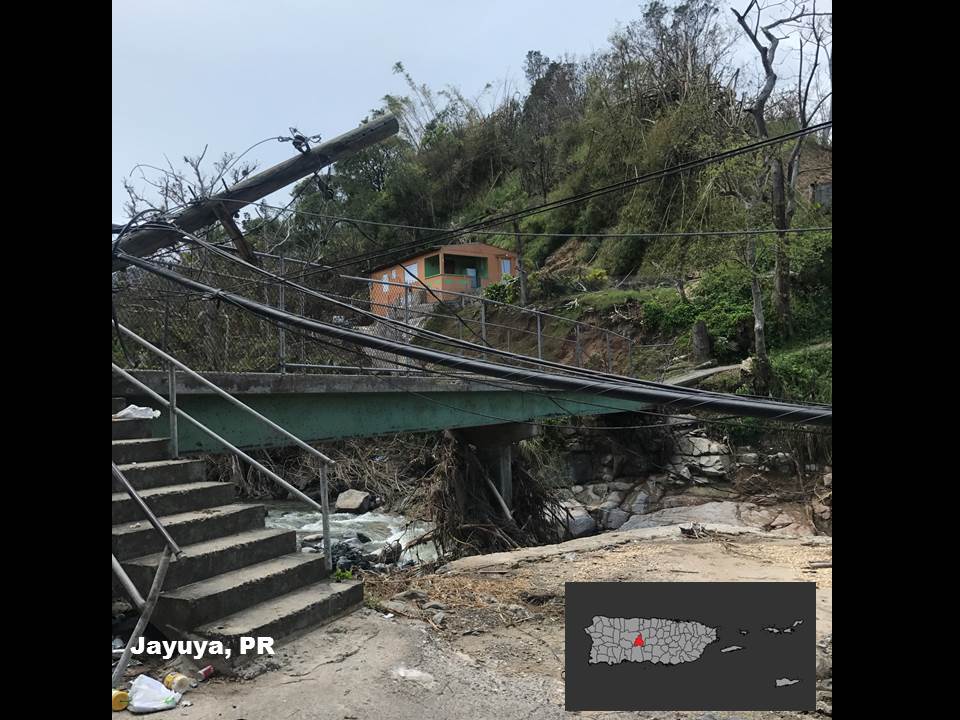
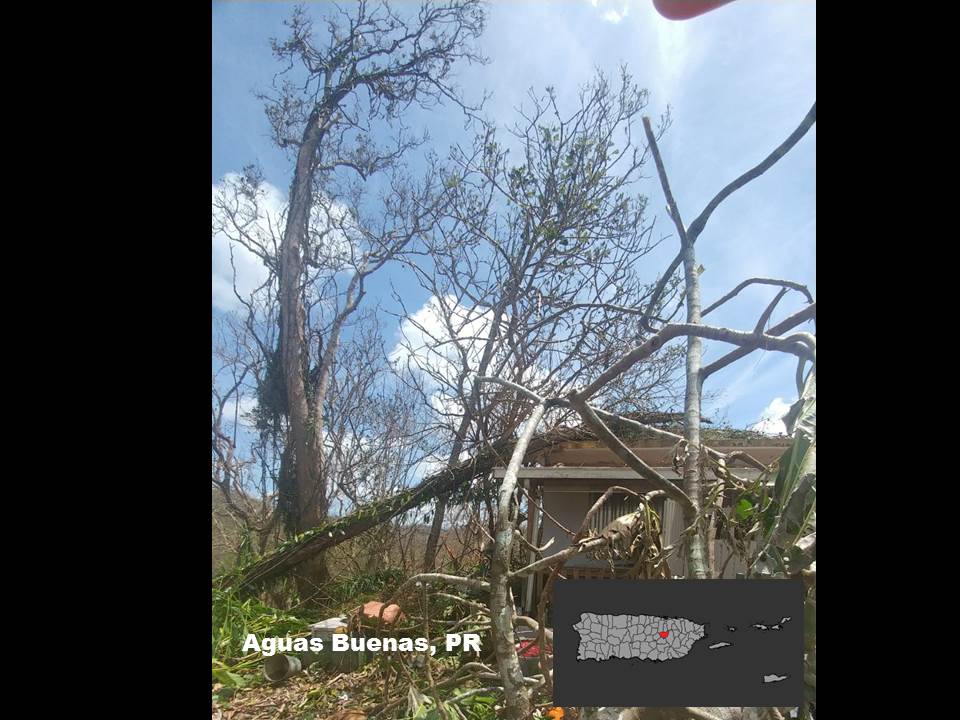
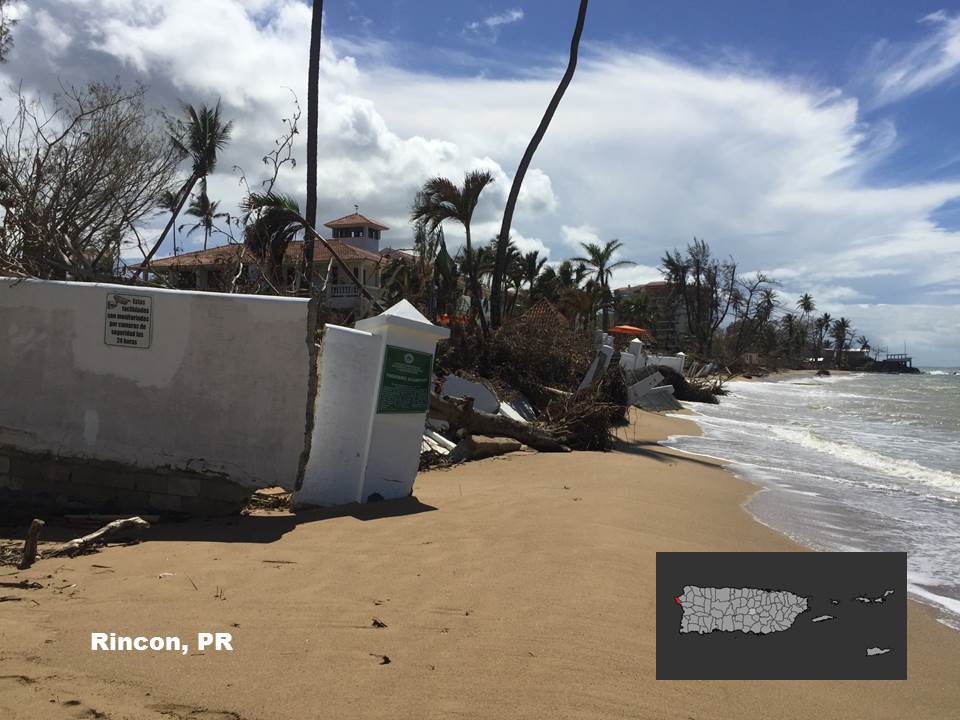
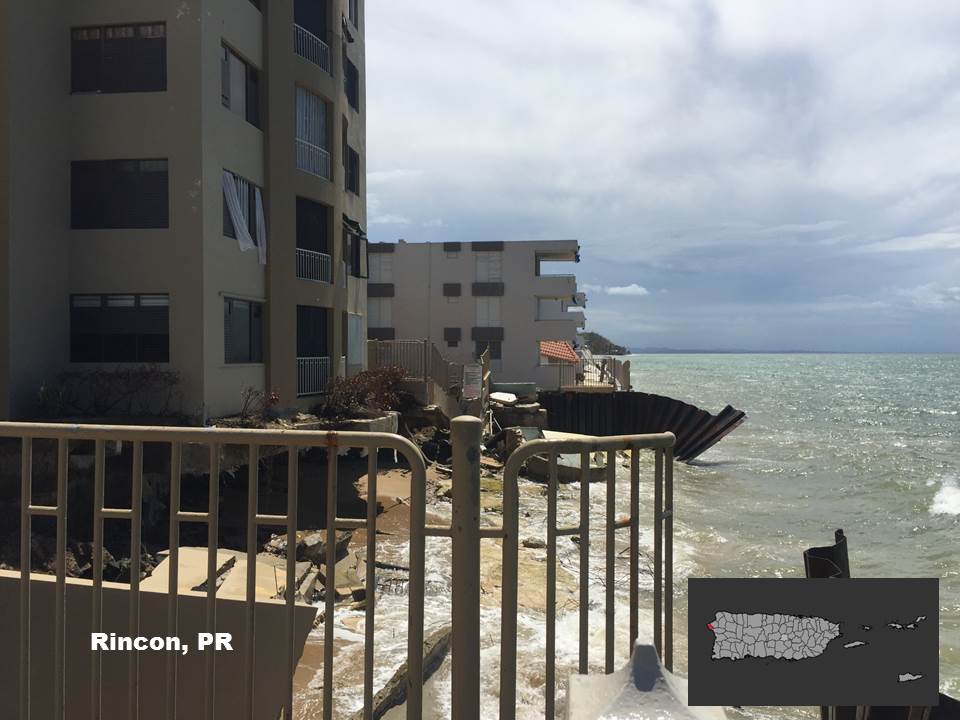
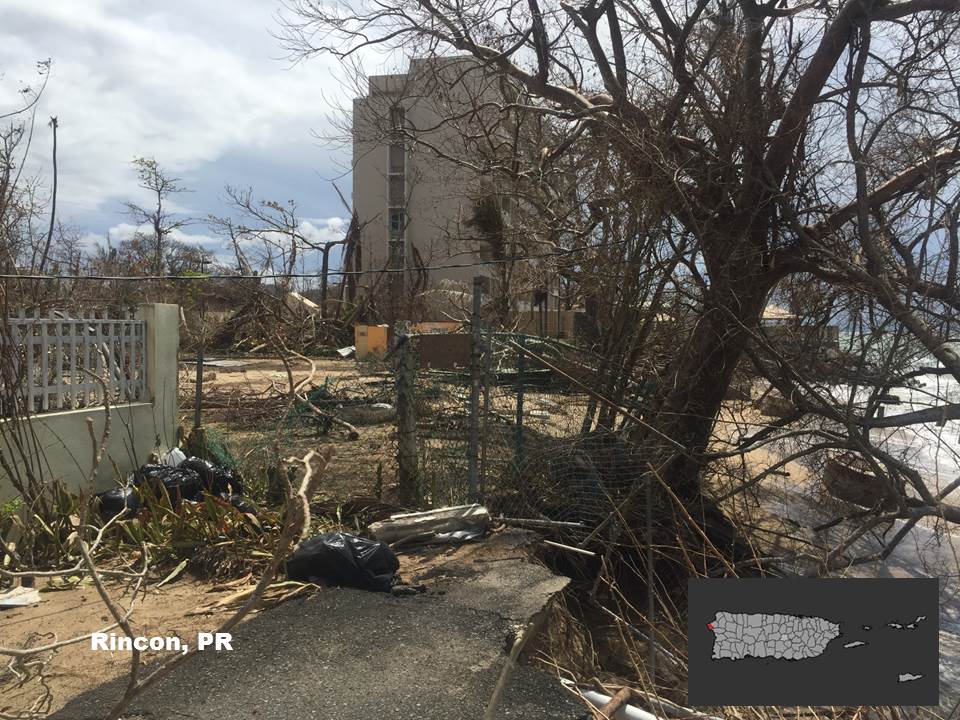
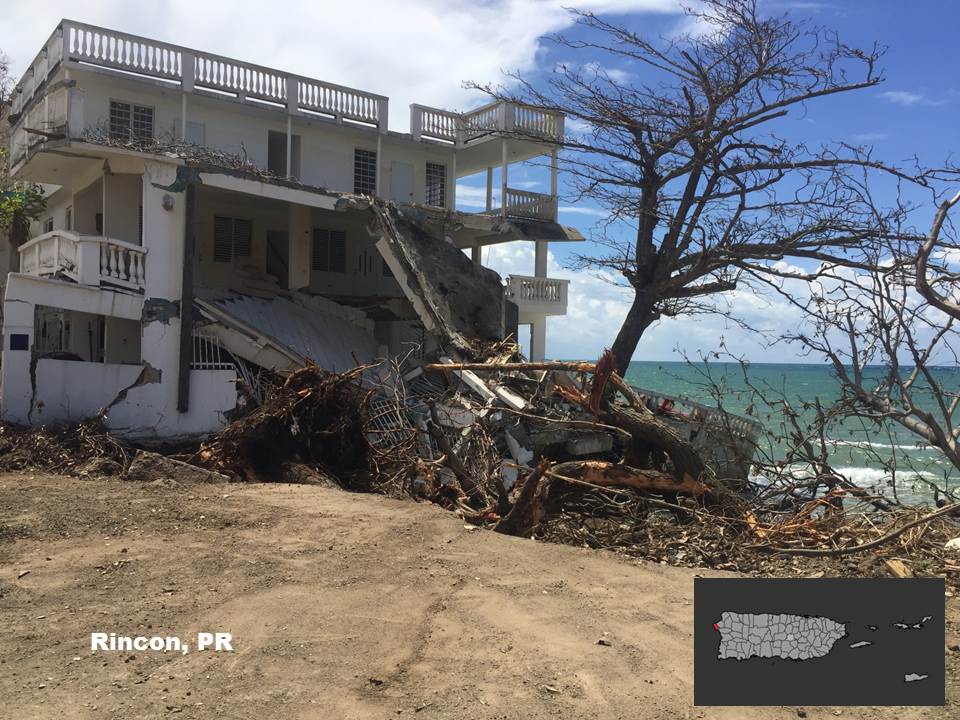
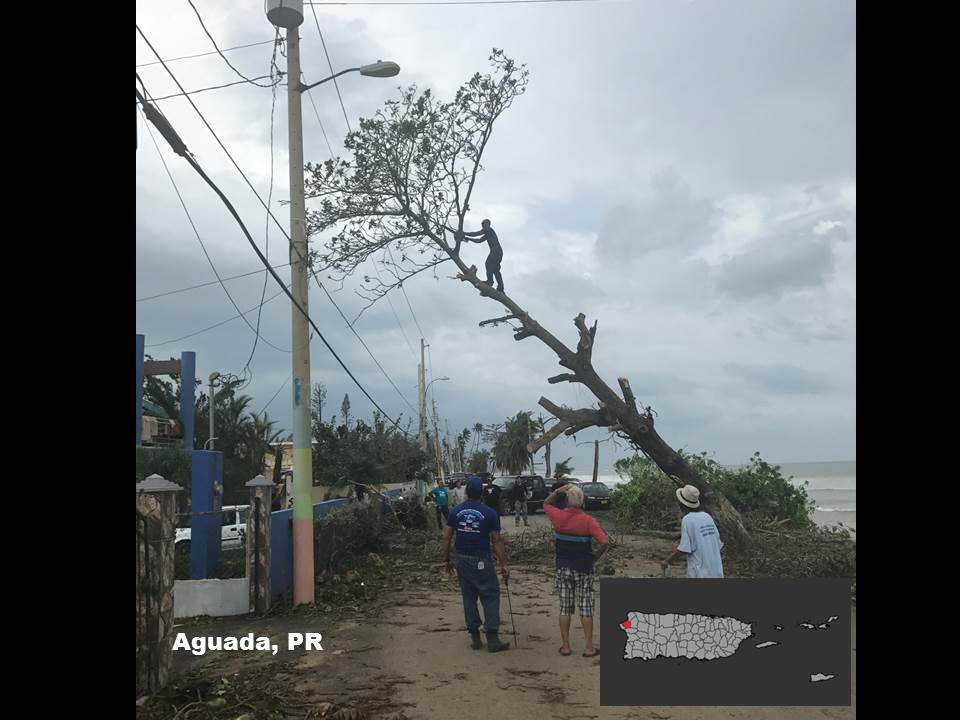
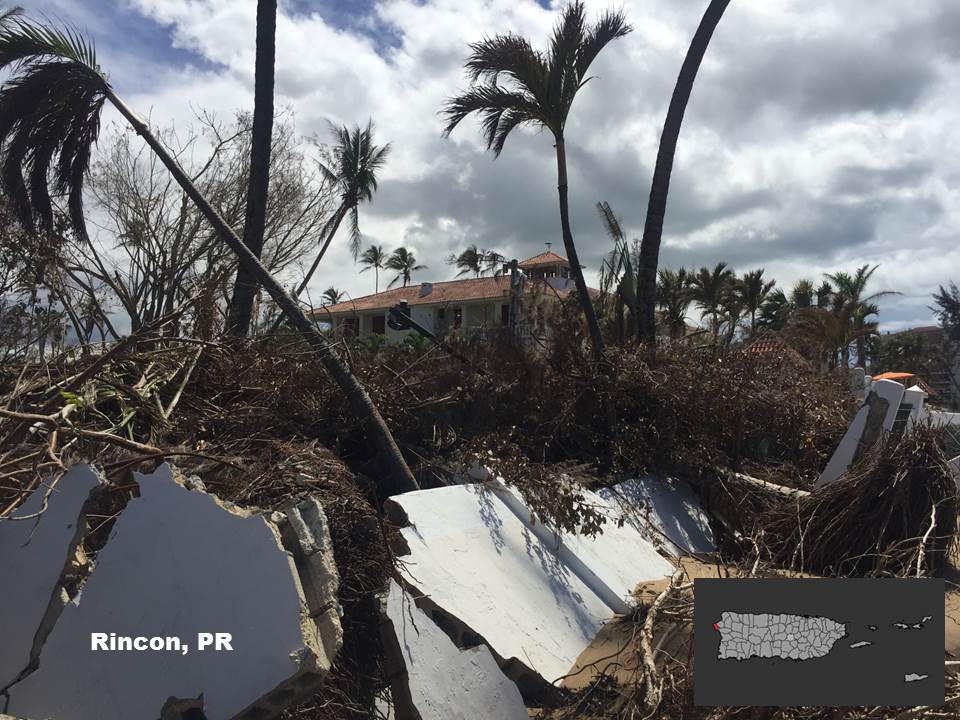
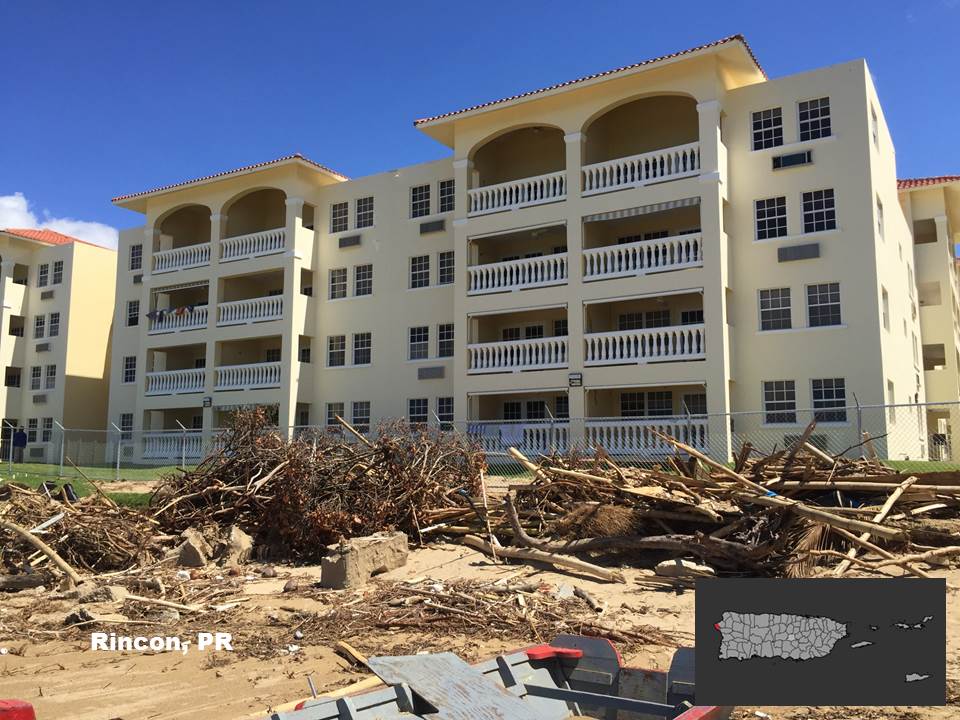
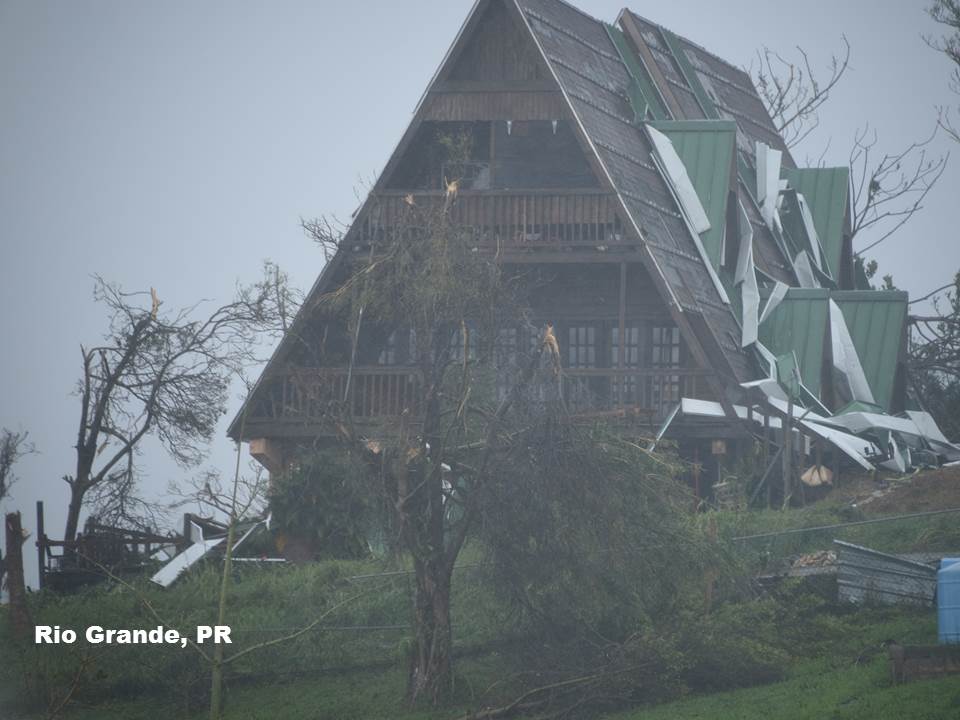
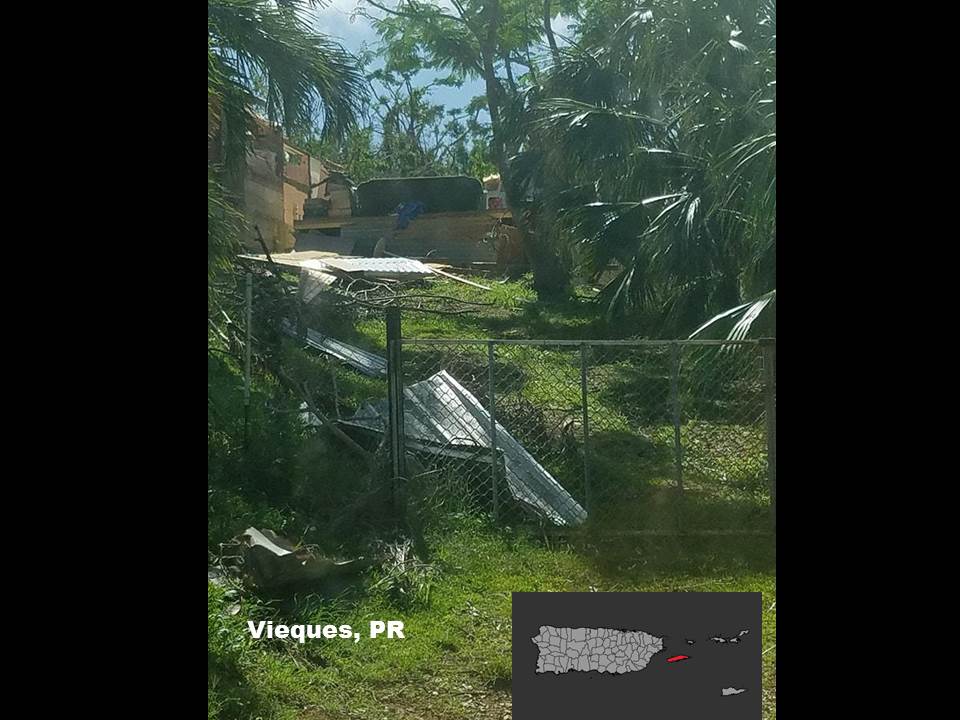
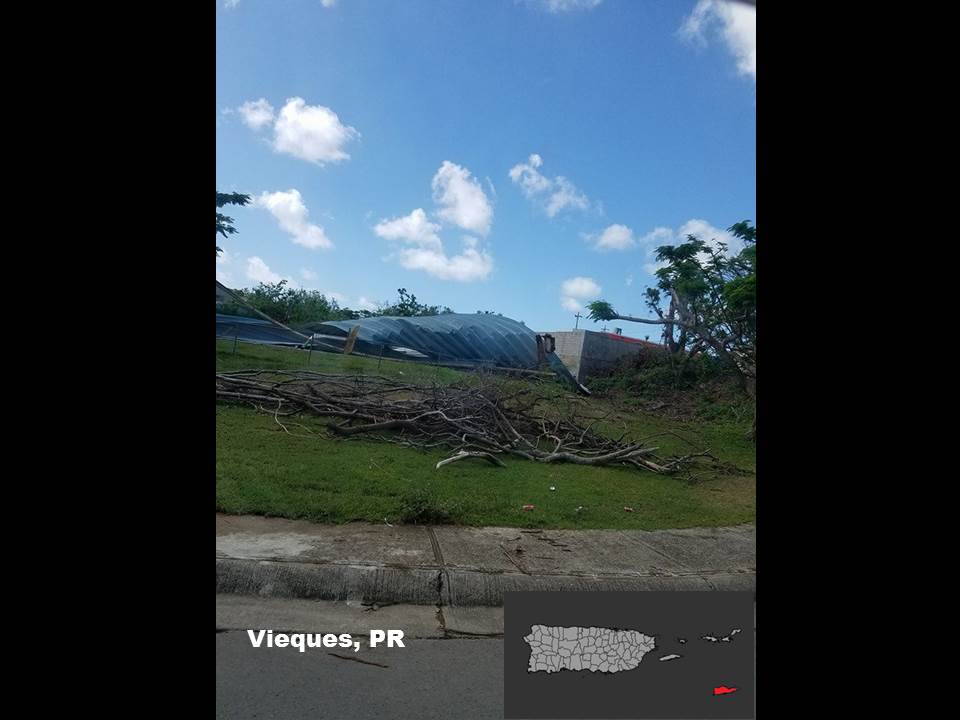
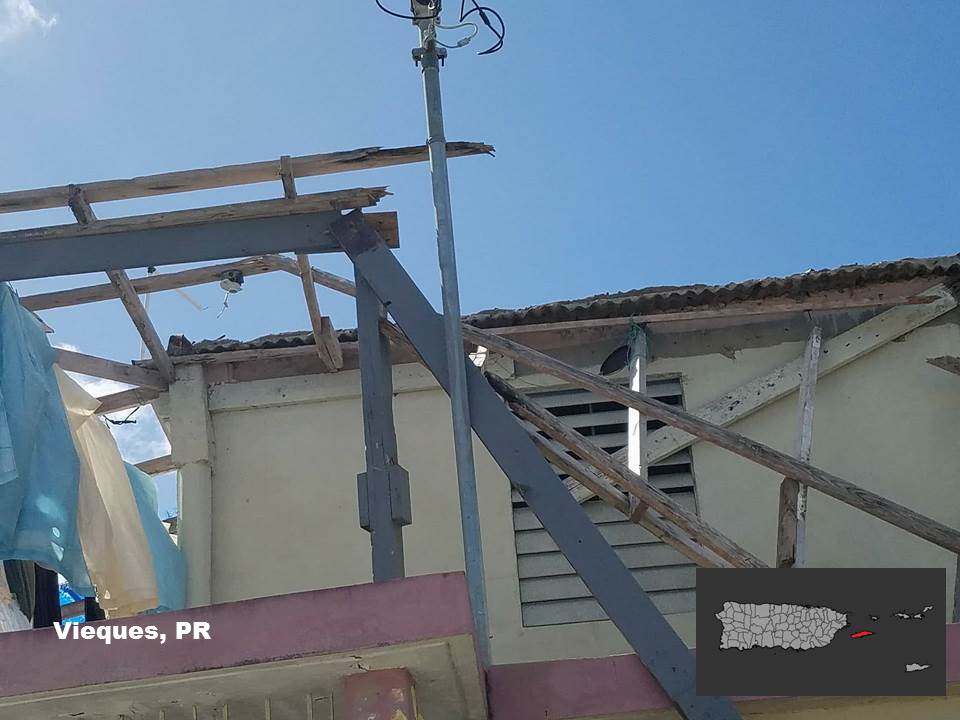
Vieques: All structures made of wood were either damaged or destroyed, wood cabins in a campground were almost completely swept away. Damages associated to beach erosion and coastal flooding due to storm surge were clearly evident along the southern coast of Vieques. Concrete pillars in the Malecon were toppled and tossed. Culebra: A few weeks before Maria affected Culebra, Major Hurricane Irma moved north of the island generating significant damage to the infrastructure. Structures were extremely vulnerable to hurricane winds generated by Maria. Reports of damage over the island included the total destruction of many wooden homes, blown off roofs and sunken boats. As citizens said, there wasn’t much to be damaged after Irma. Puerto RicoSoutheast (including the municipalities of Arroyo, Guayama, Maunabo, Patillas, Salinas and Yabucoa): The eye of Hurricane Maria made landfall across this region on the morning of September 20th, within the municipality of Yabucoa. After a local survey, extreme structural and vegetative damage were evident with multiple buildings partially to fully destroyed, as well as thousands of trees and palm trees shattered in half. Trails of coastal flooding due to storm surge along the southeast coast of Puerto Rico were also observed, which affected roads, homes, marinas and other buildings located along the coast. As examples of significant infrastructure damage, the Maunabo wind farm had several windmills blades completely destroyed, whereas a photovoltaic plant in Humacao had vast amounts of panels ruined or missing. In addition, there were several reports of overturned cars, trucks and trailers across this region. Eastern Interior (including the municipalities of Aguas Buenas, Caguas, Cayey, Cidra, Comerio, Gurabo, Juncos, Las Piedras and San Lorenzo): Damages along the southern side of this area were mainly due to strong winds. Large and mature trees had medium to large branches snapped. Small to medium size landslides were reported along secondary roads. The dome of FAA NEXRAD located at Guavate was completely destroyed. Concrete houses had structural damage. Several wooden houses were destroyed. Trees were completely defoliated. Across the northern portion of this area the damages observed were not only by hurricane force winds, but also by flooding and landslides. Most of the poultry farms in the town of Aibonito had significant damage. The coverage and the magnitude of the damages began to increase as you reached the towns of Barranquitas, Corozal, and Naranjito. Many towns and communities across the area were isolated by landslides that affected primary and secondary roads. North: Once again, widespread wind damage was evident with most structures showing some type of damage including, billboards roofs, concrete walls, and large number of trees. All major rivers along the northern half of the island flooded to near or above record crest. La Plata River flooded the entire alluvial valley including the municipality of Toa Baja where hundreds of families needed to be rescued from their roof tops in Bo.Ingenio and Levittown. Water levels reached areas where flooding had never been reported before. One hospital in Arecibo lost its roof, and many sectors and neighborhoods were flooded by Rio Grande de Arecibo. Guajataca Dam suffered damage due to the large amount runoff moving across the dirt dam at the Guajataca Lake. East: Most of the local rivers overflowed their banks flooding the towns of Luquillo and Fajardo. Marinas like Sea Lovers and Isleta Marina were heavily damaged by Maria. Over 300 boats were sunk due to the force of the winds, wave action and storm surge. Most of the wooden houses had significant structural damage. Many of the local transmitter towers had damage especially at the top of the El Yunque National Forest. Western Interior: Maricao was affected by strong winds and heavy rain. Rio Grande de Arecibo and its tributaries in Jayuya went out of their banks and flooded downtown Jayuya including the urbanizations of Monserrate, La Vega Linda, Zamas, Caricaboa and Los Alvarez. Hundreds of homes were damaged by the hurricane winds and flooding waters. Historical damage was reported in the municipality of Utuado, as Rio Grande de Arecibo and Rio Vivi and other tributaries flooded downtown. Also several bridges were destroyed by rivers with several sectors and neighborhoods across Utuado becoming isolated. Lake Caonillas flooded several homes at the sector of Caonillas Arriba. West: On the west coast, the most significant damages were associated with beach erosion and coastal flooding as Hurricane Maria moved into the Atlantic coastal waters and winds blew onshore. This type of damage was evident in the municipality of Cabo Rojo, Joyuda sector where dozens of houses along the coast were destroyed. Also along the Corcega beach at Rincon, large apartment complexes were destroyed due to beach erosion. Concrete structures were also damaged at the Crash Boat public beach in Aguadilla. There was evidence of hurricane force winds over this area as many trees fell and structural damage was reported or seen across this region. |
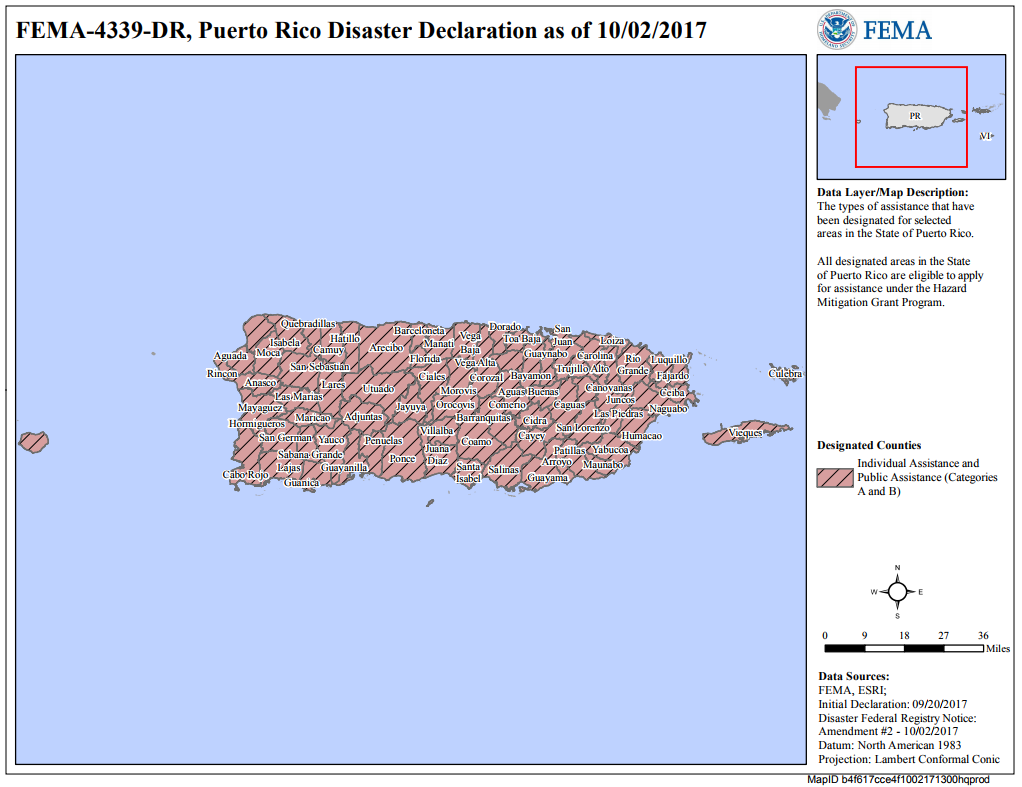
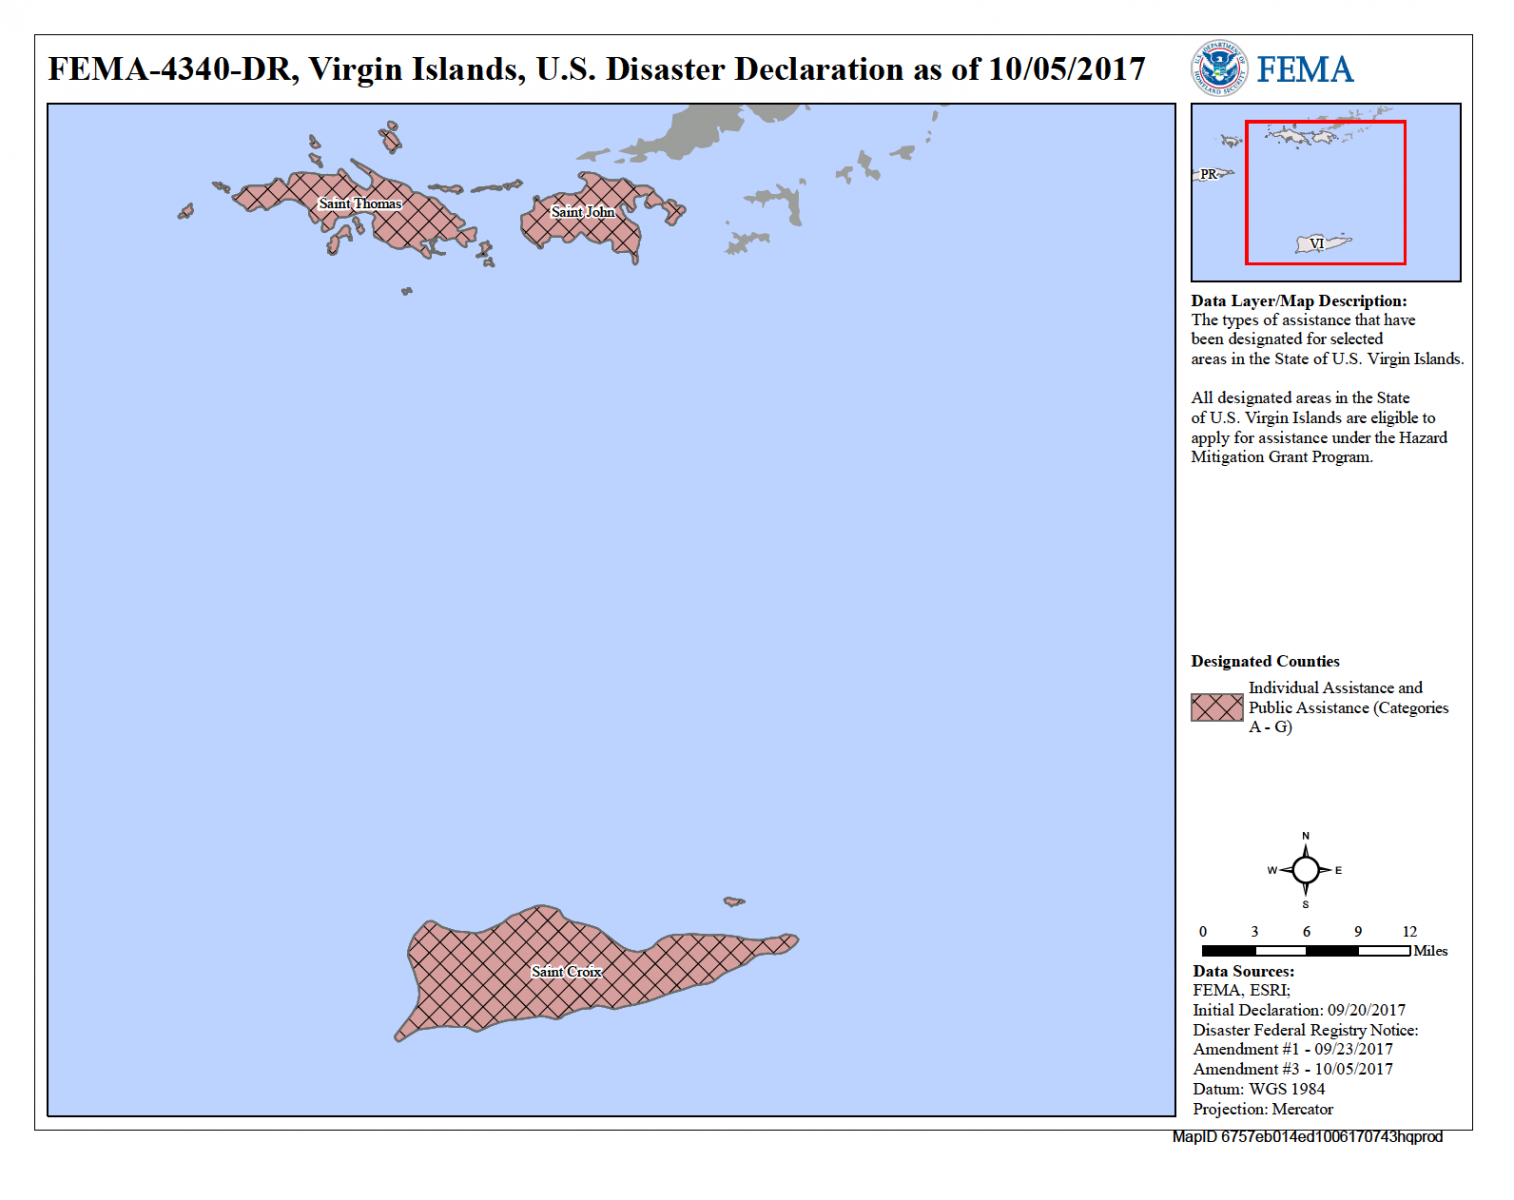
Figure 2: All Puerto Rico islands were declared as disaster area by FEMA on October 2, 2017.
|
Videos
|
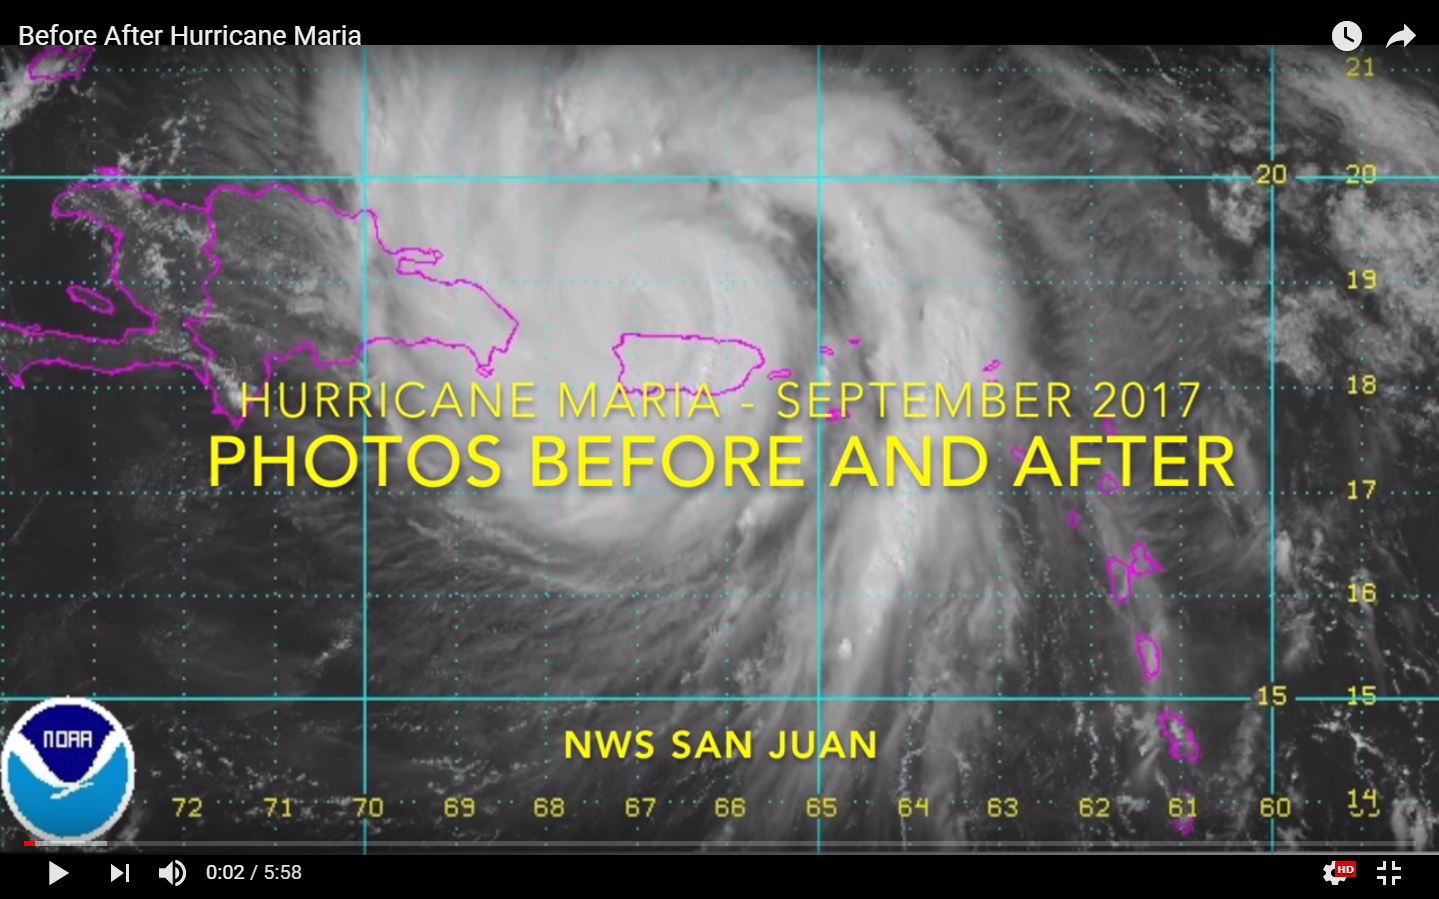
|
Photos
|


|
Impact Decision Support Services (IDSS)
|
|
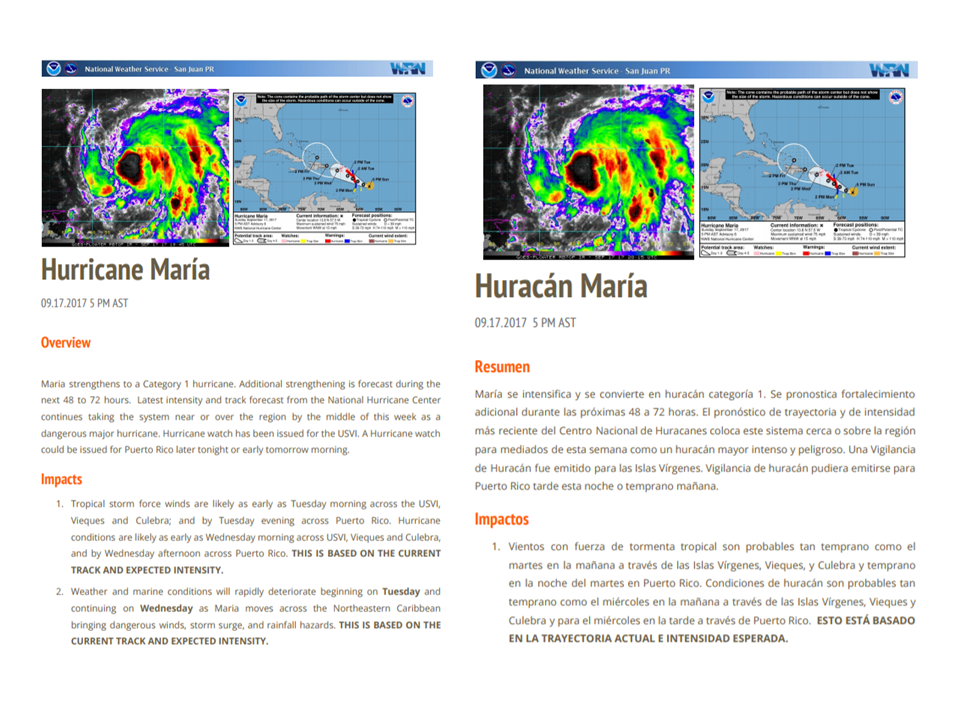
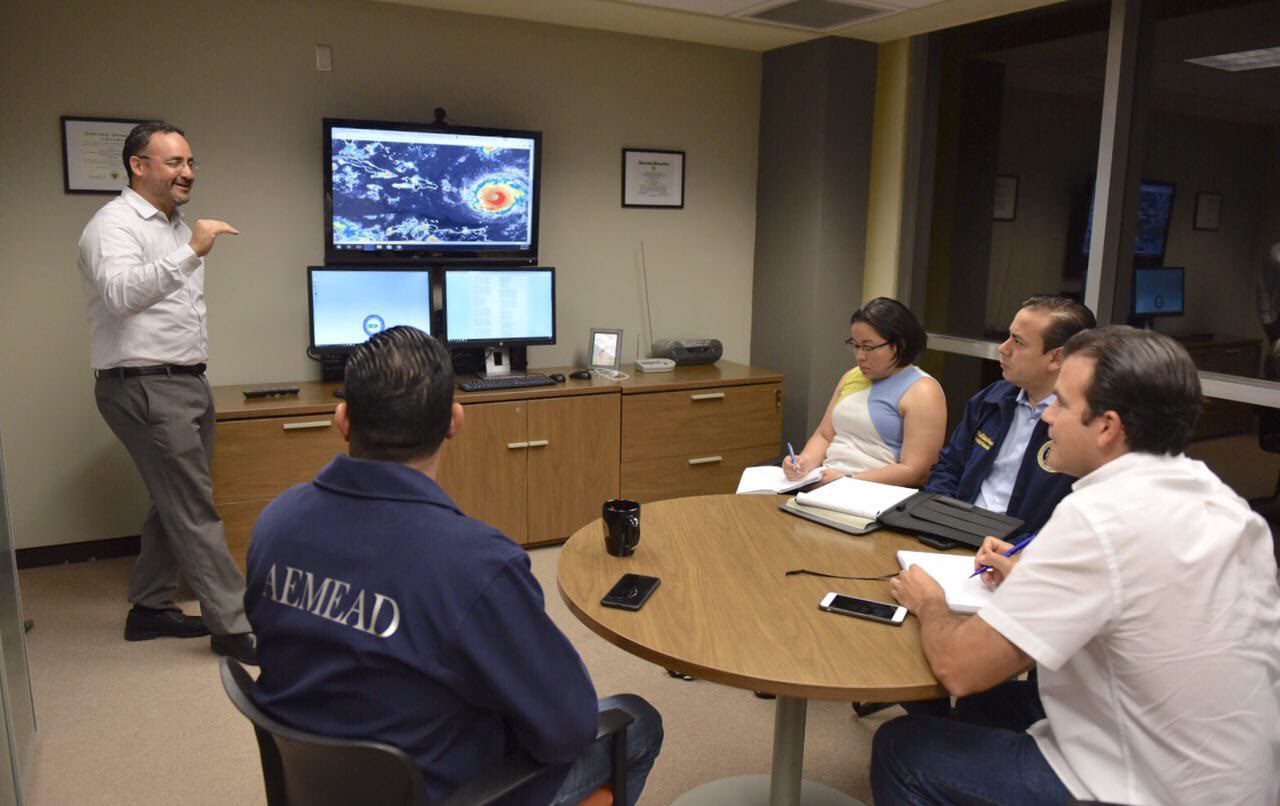
In an effort to build a resilient community, a few of the WFO-San Juan staff were deployed to assist the local government, state, and federal partners at the Emergency Operations Center (EOC) of Puerto Rico Emergency Management Agency (PREMA) during Maria. In addition, we kept a close communication with the U.S. Virgin Islands Territorial Emergency Management Agency (VITEMA) EOC prior and during the event. The Science and Operations Officer (SOO) and the Warning Coordination (WCM) were in constant communication with the Governor of the U.S. Virgin Islands and VITEMA Director. During both situations our staff provided first-hand information about the latest information provided by the National Hurricane Center and the possible impacts based on Marias’s latest forecast advisory. However, prior to the activation of VITEMA and PREMA EOCs, our office provided continuous updates with overviews and possible impacts based on the latest NHC’s Maria’s forecast advisory (Fig 1.)
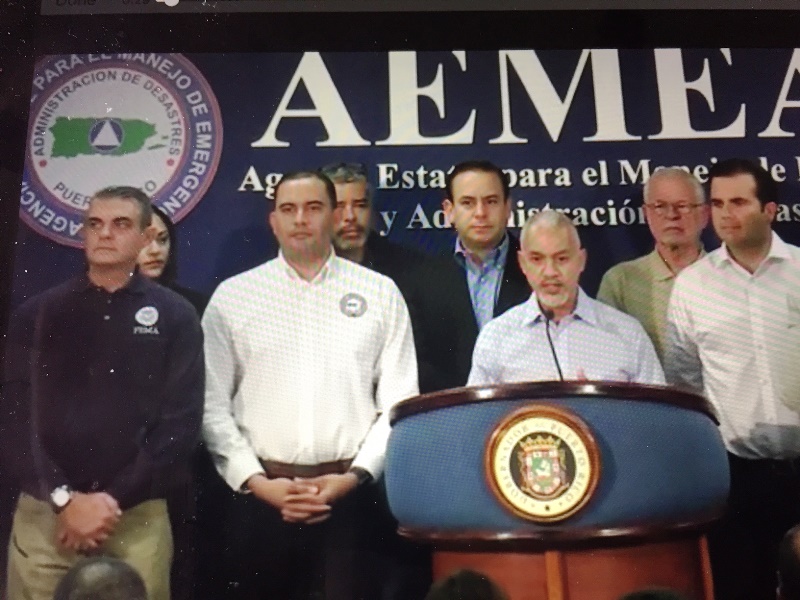
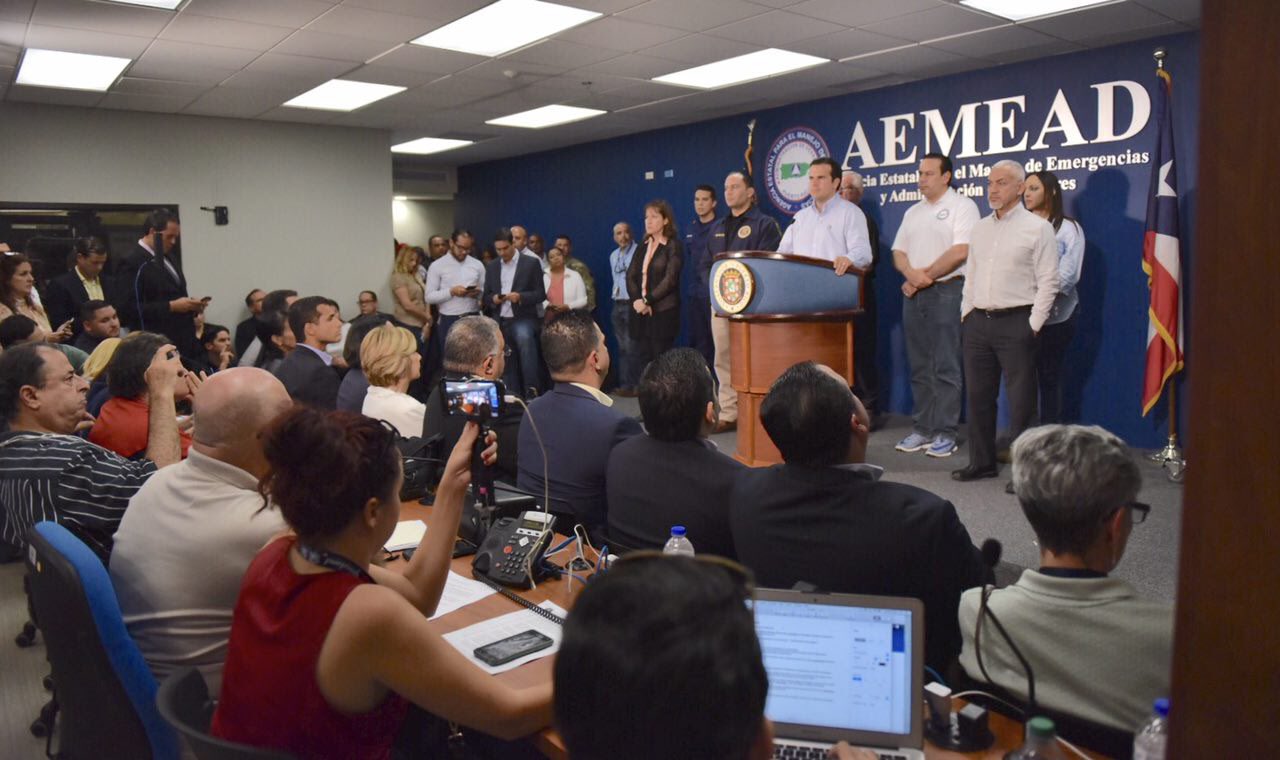
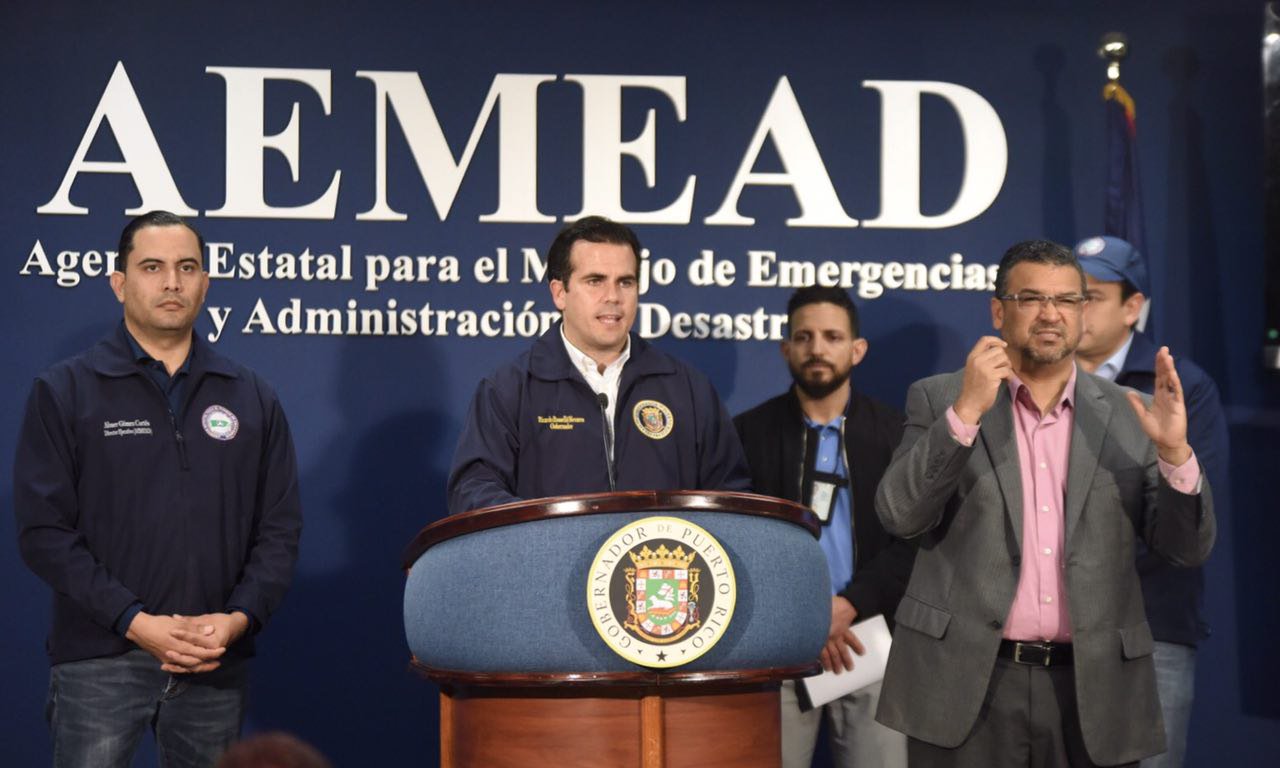
Figure 1. Weather briefing providing updates on the latest NHC advisory about Maria. This document was shared with our Emergency managers, state and federal partners' email-list. During Hurricane Maria, the staff of the NWS Forecast Office-San Juan had the opportunity to assist the state and federal agencies at the EOC. Throughout the events, we were able to positively and effectively interact with the Puerto Rican community and our core partners. At the EOC we had the opportunity to conduct numerous of radio and TV stations interviews which included: Telemundo, Univision, Radio Isla, Wapa Radio, Noti Uno, Wapa TV, Fidelity, Sal Soul, Hot 1020, WKAQ, El Nuevo Día, Metro, Noticel, TV-Caracol among others. Also, we provided specific briefings to the Governor of Puerto Rico, Hon. Ricardo A. Rosselló-Nevares, the Puerto Rico Emergency Management Agency (PREMA) Director, Abner Gomez, among other public servers, which served for the planning and decision making before, during and after María (Fig 2). In addition, this opportunity also helped to build and strengthen the relationship between our office, the government of Puerto Rico and the Federal government. At the Command Post at the Puerto Rico Convention Center we had the opportunity to provide specific weather briefings to the PR Search and Rescue Team, FEMA, USCG, ARMY, NAVY, Marines, ARMY Corp of Engineers, PREMA Director among others, which helped them to plan accordingly the expected recovery missions conducted during the post María’s operations. |


 Graphical Hazardous Weather Outlook
 Tropical Analysis
 Tropical Weather
 Regional Satellite
  Puerto Rico and U.S. Virgin Islands
 Local Radar