|
|
|
North American Multi-Model Ensemble Teleconference Predictability of the sudden stratospheric warming in the NMME phase-2 models July 12, 2018 “Since skillful subseasonal predictions of Northern Hemisphere cold season extratropical weather and extreme events are linked to the Arctic Oscillation/Northern Annular Mode (AO/NAM), it is desirable to predict the state of the stratospheric polar vortex, and thus potentially the surface temperature and storm track patterns out 20-40+ days into the future.” Prof. Jason Furtado of the School of Meteorology, University of Oklahoma gave a presentation on quantifying fundamental characteristics of AO/NAM and related predictability in the NMME Phase-2 models, and identifying models biases in the development and subsequent impact of major sudden stratospheric warmings (SSW). His research, using the three NMME Phase-II models with sufficient stratospheric data (CanCM3, CanCM4, and NCAR-CCSM4) showed that: 1) modeled surface AO signature includes a much stronger Pacific loading center than in observations, 2) models underestimate the frequency of positive AO after approximately 7 days, 3) an observed significantly higher frequency of negative AO enduring through days 10-16 is not represented by the models, and 4) the models underestimate Northern Hemisphere polar vortex variability. Flaws were also found in wave forcings and resulting patterns. The composite of post-SSW impacts on 500 hPa geopotential height showed the North Atlantic Oscillation signature was present, but slightly eastward biased, and models show little agreement with observations in the Pacific sector. It was discussed that stratosphere-troposphere coupling biases may be tied to incorrect wave-mean flow interactions in the troposphere following major SSWs. |
|
|
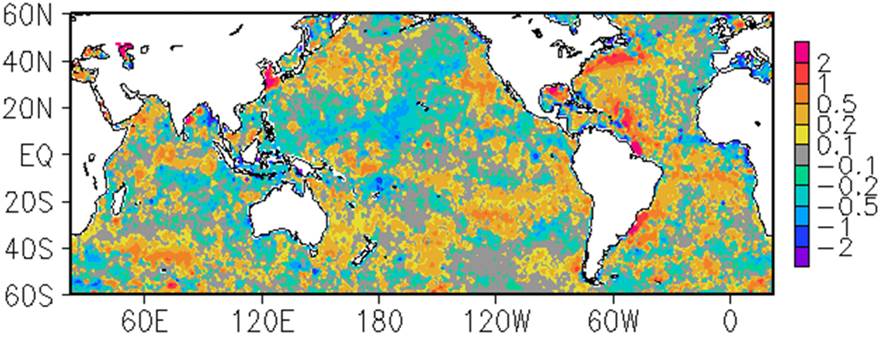
Climate Prediction Center Ocean Briefing Blended analysis of pentad sea surface salinity |
|
|
July 12, 2018 To support Ocean Briefing in real-time, Dr, Pingping Xie of Climate Prediction Center introduced a new monitoring product, Blended Analysis of Sea Surface Salinity (BASSS, Xie et al. 2014), which combined information of in situ measurements from NCEI and multiple satellite retrievals from NASA/SMAP, NASA/Aquarius and European Space Agency(ESA)/SMOS), using revised Optimum Interpolation (OI) based blending technique originally developed for monthly analysis to create pentad data of spatial resolution 1°x1° over global ocean that was daily updated with a delay of 2 days. |
Fig. 1 Global Sea Surface Salinity Anomaly for 6/30-7/04 of 2018. (Click on the figure to enlarge.) |
|
In accompany with sea surface salinity, oceanic evaporation (E), precipitation (P) and E-P were also composed. The evaporation was produced from CFSR evaporation data adjusted against Objectively Analyzed air-sea Fluxes (OAFlux), and the precipitation from bias corrected CMORPH satellite precipitation estimates. Validation with Tropical Atmosphere Ocean (TAO) buoy observations showed that BASSS captures the major structure quite well, though TAO was not an independent input. The author welcomes user feedbacks, especially on requirements of 1) time/space resolution, 2) additional variables, and 3) diagnostic fields/tools and attribution analysis. Dr. Pingping Xie can be reached at pingping.xie@noaa.gov. Reference Xie, P., T. Boyer, E. Bayler, Y. Xue, D. Byrne, J. Reagan, R. Locarnini, F. Sun, R. Joyce, and A. Kumar, 2014: An in situ-satellite blended analysis of global sea surface salinity. J. Geophys. Res. Oceans, 119, 6140–6160, doi:10.1002/2014JC010046. |
|