National Weather Service United States Department of Commerce

Thunderstorms Across the Southeast U.S.; Elevated to Locally Critical Fire Weather in Colorado

A few strong to marginally severe thunderstorms are possible across the Southeast U.S. Friday. A Marginal Risk (Level 1 of 5) outlook has been issued. Strong winds and hail will be the main threats. Elevated to locally critical fire weather conditions will persist across south-central Colorado today due to dry conditions and gusty winds. Read More >


  Las Vegas, Nevada

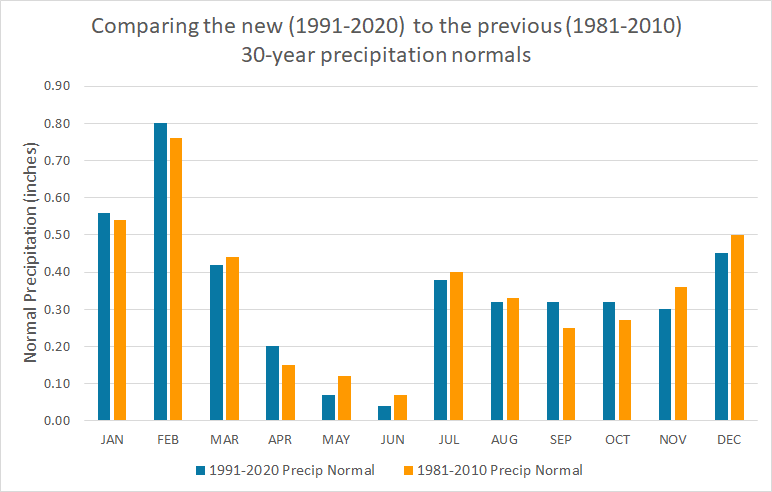
 1991-2020 Climate Normals

   The New 30-Year Climate Normals have been released!


Temperature Normals

New 1991-2020 Annual & Monthly Temperature Normals


[Above: A comparison table of the new 30-year temperature normals and how they’ve changed (+/-) from the previous 30-year 1981-2010 normals.]
 

[Above: A bar graph comparing the new (1991-2020) monthly temperature normals to the previous (1981-2010) 30-year normals.]

Comparing Temperature 1991-2020 Normals to 1981-2010 Normals

The new 30-year temperature normals for Las Vegas show one thing, it keeps getting warmer. Normal mean temperatures for each month were at least a half a degree warmer this 30-year cycle than the previous, with the mean temperature jumping from 69.3 to 70.1 degrees. The only month to have no change in mean temperatures was May. High temperatures also showed an increase for nearly every month, with most increasing between 0.3 and 0.9 degrees. Only May actually showed a decrease in mean high temperatures, dropping 0.4 degrees. Over the past 50 years, the maximum temperatures in Las Vegas have been slowly rising, going from a 10-year average in the 1970s of 79.7 degrees to 81.4 degrees in the 2010s, an increase of 1.7 degrees. As has been the case for many years, the low temperatures in Las Vegas have been increasing at a much faster rate. For 1981-2010 normals, the mean low temperature was 58.6 degrees rising to 59.7 degrees for the 1991-2020 normals, an increase of 1.1 degrees. What is more interesting, is the fact that the mean low temperature in the 1970s was 53.3 degrees rising to 60.3 degrees between 2010-2019, an increase of 7 degrees! A lot of this can be attributed to the explosive development Las Vegas has seen since the 1970s, resulting in significant influence from the urban heat island effect.  As a comparison, Pahrump, NV had a mean low temperature in the 1970s of 45.5 degrees which has increased to 47.3 degrees in the 2010s, only 1.8 degrees. As Las Vegas continues to grow over the next decade, it’s a safe bet that overall mean temperatures will continue to increase. 


Precipitation Normals

New 1991-2020 Annual & Monthly Precipitation Normals 


[Above: A comparison table of the new 30-year precipitation normals and how they’ve changed (+/-) from the previous 30-year 1981-2010 normals.]


[Above: A bar graph comparing the new (1991-2020) monthly precipitation normals to the previous (1981-2010) 30-year normals.]


Comparing Precipitation 1991-2020 Normals to 1981-2010 Normals


Surprisingly, there has been very little change in precipitation totals with the new 30-year normals. There was only a 0.01” decrease in precipitation normals for the 1991-2020 timeframe, decreasing from 4.19” to 4.18”. There weren’t any significant monthly changes with all months changing by just a few hundredths. Five months saw an overall increase, while seven months had a decrease. The biggest increase occurred in September going from 0.25” to 0.32” while the biggest drop occurred in November going from 0.36” to 0.30”. There was little change during our Monsoon months with September seeing the biggest gain while July and August dipped slightly. June has always been the driest month in Las Vegas and the rainfall normals dropped from 0.07” to 0.04” keeping this the driest month of the year once again. On an interesting note, during the period of 1991-2020 there were only 12 days of measurable precipitation in June and only once did Las Vegas record over 0.25”.


The Las Vegas Climate Book will be updated with the new normals by late summer 2021.


Did You Know?

  • National Centers of Environmental Information (NCEI) is the official source for Climate Normals for U.S. stations. 

  • Climate Normals are not simple 30-year averages of monthly or daily observations, but involve complex estimation and scaling to ensure proper data representation. 


Additional Questions? Email Chelsea Kryston ( chelsea.kryston@noaa.gov ) or Andy Gorelow ( andy.gorelow@noaa.gov )