Dangerous, record-breaking heat will intensify across most of the central and eastern U.S this week. Heat indices will likely exceed 100 degrees. Severe thunderstorms are forecast from parts of the central High Plains into the Upper Midwest, and across parts of the Northeast. Critical fire weather conditions will continue across portions of the Four Corners and Great Basin. Read More >

Above-normal temperatures seem to be the ‘new normal,’ especially across the Mojave Desert. So no surprise that the Mojave Desert + surrounding region has a +40% probability of seeing above-normal temperatures this winter. But, what’s ‘normal’ this time of year? Well, most valley locations have average normal temperatures between the mid-50s to upper 60s during the months of December, January, and February.

The 3-month precipitation outlook isn’t all that surprising either, especially considering we are currently in a La Niña phase (further details in the next section on this topic.) The entire Southwest has a 33-40% probability of seeing below-normal precipitation this winter. Precipitation typically varies considerably by location but in general, most valley locations normally see 2 to 2.5 inches during the months of December-February.
ENSO is one of the most important climate phenomena on Earth due to its ability to change the global atmospheric circulation, which in turn, influences temperature and precipitation across the globe.
El Niño: A warming of the ocean surface, or above-average sea surface temperatures (SST), in the central and eastern tropical Pacific Ocean. Over Indonesia, rainfall tends to become reduced, while rainfall increases over the tropical Pacific Ocean. The low-level surface winds, which normally blow from east to west along the equator (“easterly winds”), instead weaken or, in some cases, start blowing the other direction (from west to east or “westerly winds”).
La Niña: A cooling of the ocean surface, or below-average sea surface temperatures (SST), in the central and eastern tropical Pacific Ocean. Over Indonesia, rainfall tends to increase while rainfall decreases over the central tropical Pacific Ocean. The normal easterly winds along the equator become even stronger.
Neutral: Neither El Niño or La Niña. Often tropical Pacific SSTs are generally close to average. However, there are some instances when the ocean can look like it is in an El Niño or La Niña state, but the atmosphere is not playing along (or vice versa).
We are currently experiencing La Niña conditions, which are likely to remain through Winter 21-22.
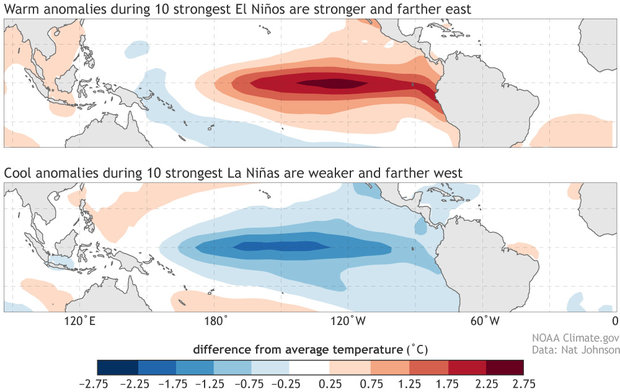
The above map illustrates sea surface temperature anomaly in the Pacific Ocean during the strongest El Niño (top) and La Niña (bottom). Credit: NOAA Climate.gov.
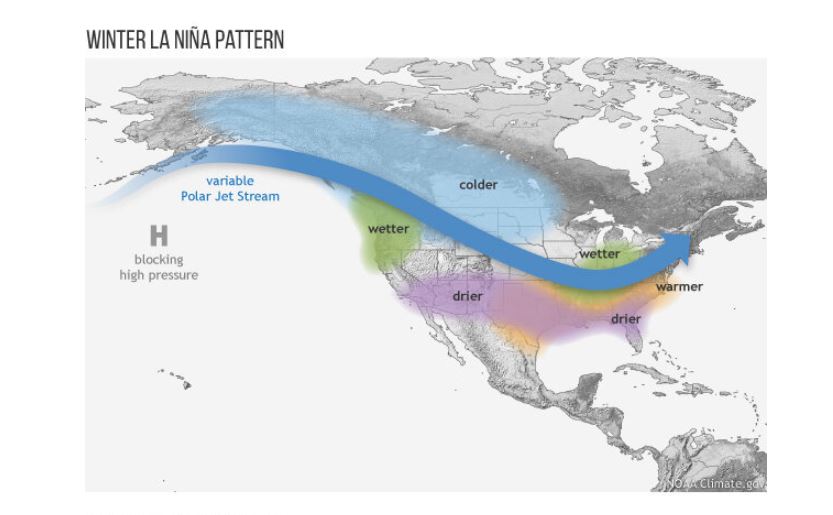
The above map illustrates the typical impacts of La Niña on U.S. winter weather. 'Typical' means "common," but not guaranteed because each event is unique. Credit: NOAA Climate.gov drawings, adapted from originals by the Climate Prediction Center.
La Niña is here to stay through the winter. So what does that mean for us? The atmosphere responds to La Niña’s cooler-than-average ocean surface, impacting our weather patterns. “How?” - you might ask - well, La Niña conditions create a strengthened Walker Circulation and it’s what we have: air rising vigorously over the very warm western Pacific, traveling eastward high up in the atmosphere, sinking over the cooler central-eastern Pacific, and traveling back westward near the surface. This circulation contributes to the ridge of high pressure that dominates the weather pattern across the eastern Pacific and off the western CONUS coast, leading to a more progressive weather pattern across the north-central CONUS and little precipitation across the southern CONUS.
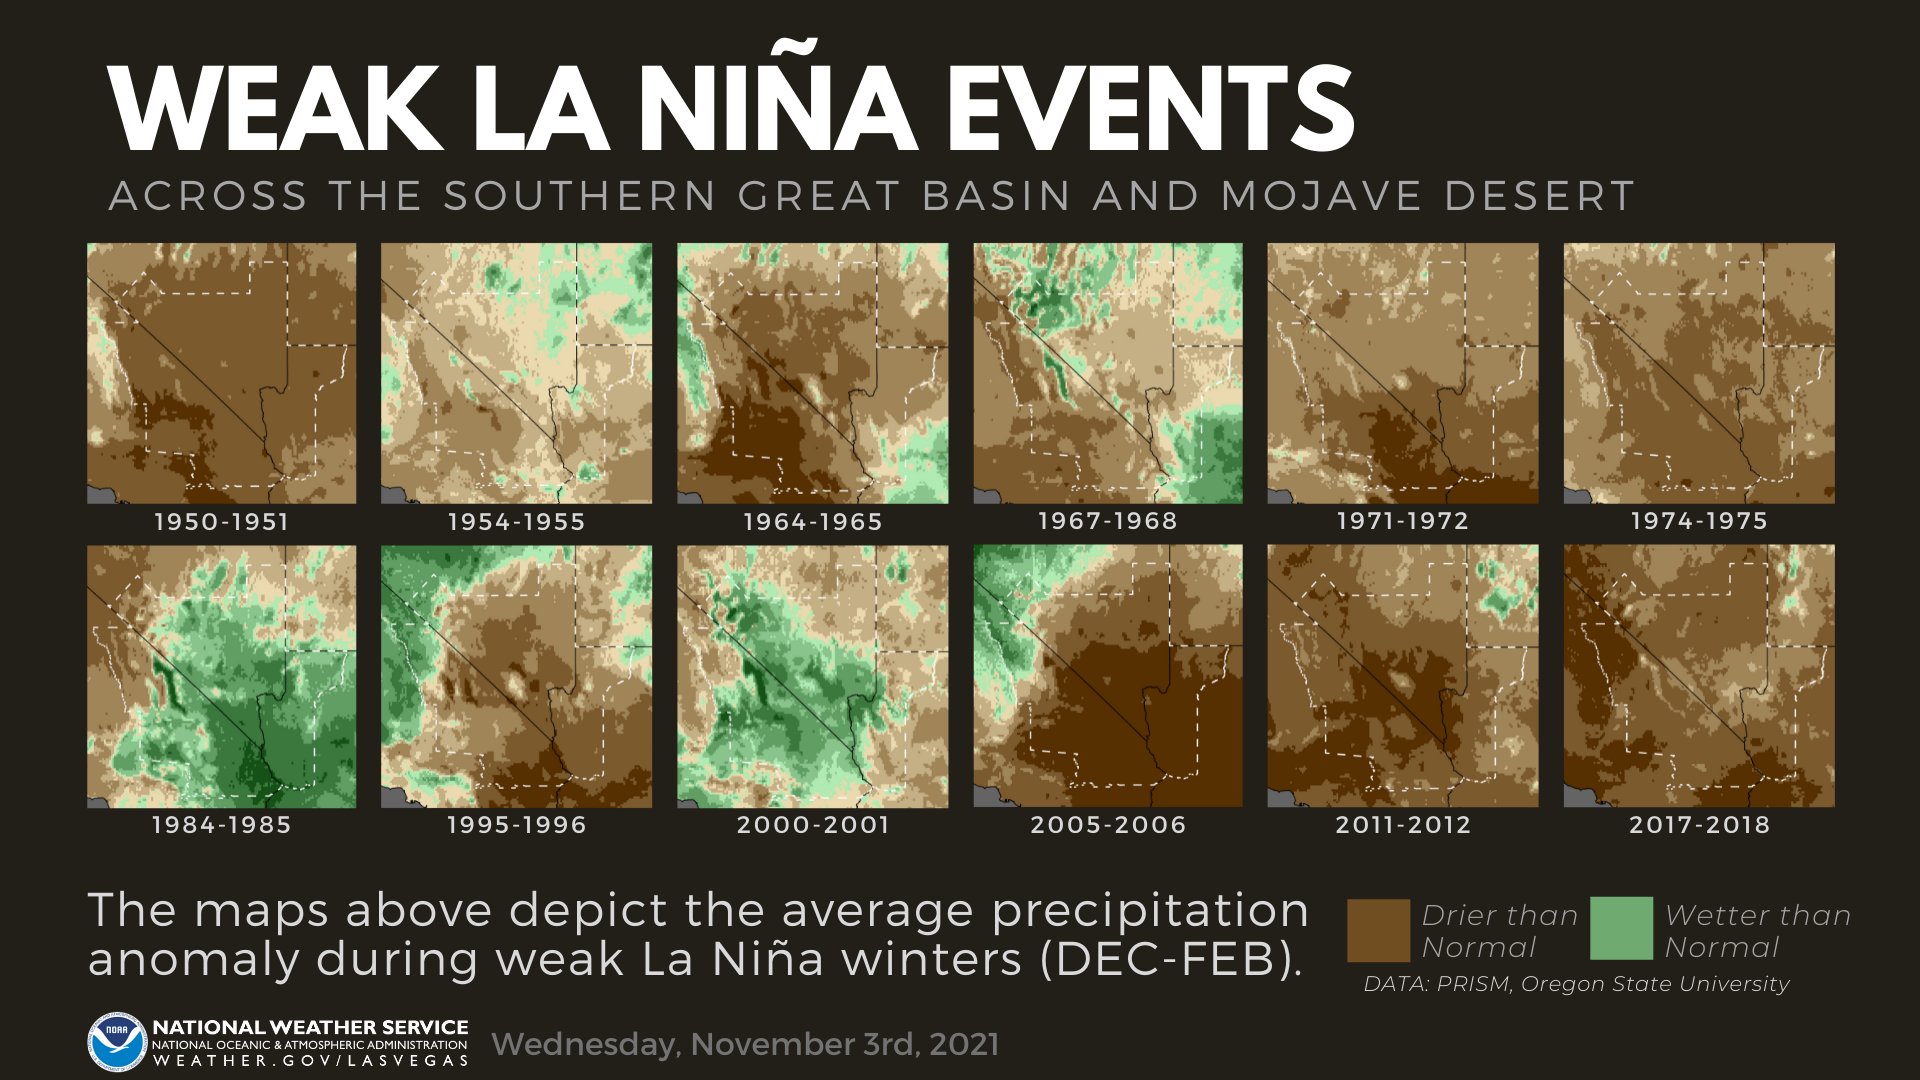
Data used to create the maps in the above image: PRISM, Oregon State University.
Based on years past, the typical La Niña pattern has resulted in drier conditions across the Desert Southwest, but that is not always the case. The image above depicts the 12 most recent weak La Niña winters (DEC-FEB) and highlights how significantly drier or wetter from normal those winters were. As you can see, not all La Niña winters have resulted in below-normal precipitation across the region. It only takes a few precipitation events to achieve near or above-normal precipitation. Even so, there is a clear dry bias during La Niña winters. Even with a fairly limited dataset with only 22 La Niña events, about 60-80% of the time a La Niña winter results in drier than normal precipitation. Considering the strong statistical significance with La Niña events and below-normal precipitation, the 2021-2022 Winter Outlook is highly influenced by the current and predicted ENSO state.

Widespread severe to exceptional drought continues to dominate the western half of the continental United States. Much of the drought depicted across the region is long-term drought remaining from the dry year of 2020. The snow deficit from the winter of 2020-2021 further added to the drought conditions. Monsoon 2021 did provide above-normal precipitation across much of the Southwest, but the precipitation that fell was largely heavy, localized rainfall which provided only marginal drought relief to portions of the region, especially those in AZ.
With La Niña conditions expected to remain through the winter season and possibly into the spring, drought conditions are forecast to persist or worsen across the Southwest.
Questions about the above information? Contact Chelsea Peters at chelsea.peters@noaa.gov.