Some of the greatest benefits from the dual polarization upgrade come when using multiple dual-pol products together or using dual-pol products with pre-existing WSR-88D products. This page provides some examples of some of the new things we will be able to see thanks to the dual-pol upgrade.
Tornadic Debris Detection
Thanks to our new capability to be able to detect radar echoes with greatly-varying particle size and shape, we will now at times be able to confirm the presence of a tornado when enough debris are lofted into the air to be detected by the radar. This new signature, known as the Tornadic Debris Signature (TDS), will be a powerful tool, particularly in very rural areas where we might not otherwise receive confirmation that a tornado is doing damage for several hours. The presence of a TDS will give National Weather Service meteorologists an opportunity to enhance and fine-tune information in our warnings for residents farther downstream of the storm. However, it should be noted that the TDS is not a prediction tool. Once a TDS appears, a tornado is already doing damage; therefore, this will not replace conventional methods of determining when to issue a Tornado Warning. This will just be a new tool in our arsenal.
How it works: By definition, a TDS exists when there is an area of high reflectivity coinciding with a tight rotational signature, a localized area of lower correlation coefficient (typically below 0.8), and usually differential reflectivity near 0. It is very important for each of these things to be almost exactly co-located. If, for instance, all of these criteria are met except for the high reflectivity, it is unlikely to be a Tornadic Debris Signature.
Typically the CC product will be the biggest give away when there is a TDS. Because the TDS signature in the CC product is usually be surrounded by higher CC values, it tends to stand out better than on other radar products. However, it is important not the rely on CC alone. Often times there may be an area of lower CC coinciding with an area of strong circulation. This is not a tornadic debris signature.
Real-life example: There have actually been numerous examples of TDSs in the Southeastern United States over the past year, but here is one example from our neighbors to the east in Alabama. On March 2, 2012, a potent storm system caused an outbreak of tornadoes from the Ohio Valley southward to near the Gulf coast. One of those tornadoes tracked east of the Verbena community in Chilton County. We will start by looking at our traditional radar products. Below we see base reflectivity on the left and storm-relative velocity on the right. In the circled areas, we see reflectivity values in the 45-57 dBZ range, and the velocity image indicates around 100 knots of gate-to-gate shear - very strong and tight rotation. Using this information alone, a meteorologist would already be able to determine that a Tornado Warning should be in effect.

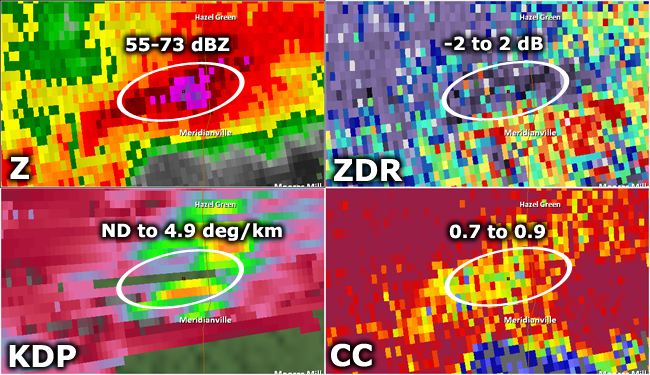
However, thanks to dual-pol, there were some more products that could be considered during this storm. The image below again shows base reflectivity on the left and storm-relative velocity on the right at the same time as the image above. Below that, we'll add two dual-pol products: differential reflectivity (ZDR) on the left and correlation coefficient (CC) on the right. We will again focus on the area inside of the circle. We are already aware that there is high reflectivity and strong, tight rotation at the location. Now we can also note the ZDR product indicates values near and slightly below zero, and the CC product shows values between 0.45 and 0.7 common in this area. Given all of these factors we can conclude that the radar is sampling tornadic debris that are being lofted into the air.

Indeed there was a tornado ongoing at the time of this radar image. National Weather Service storm survey teams rated the tornado EF-2.
Here is a quick video from NOAA Weather Partners about the TDS.
Hail Detection
One of the greatest benefits from dual pol is the capability to detect areas of mixed precipitation type. This provides obvious benefits during the colder months, when wintry precipitation may become an issue. But it also has implications during the warmer months when severe weather, and specifically hail, is more of a concern. Though we cannot determine exact hail sizes using dual-pol, we will be able to generally differentiate between smaller and larger hail sizes. We will also be able to detect rain/hail mixtures and melting hail.
How it works: There are several radar variables we must consider when attempting to detect hail. First of all, we can begin with a product that we've always had available - reflectivity. While reflectivity will not necessarily allow us to differentiate between large raindrops and hail stones, we would expect to see high reflectivity (typically greater than 55 dBZ, but possibly as low as 45 dBZ in rare instances) in an area where hail is occurring. Beyond reflectivity, there are multiple dual-pol variables to consider. Recall that differential reflectivity (ZDR) can tell us about the shape of radar echoes. Hail can come in many shapes, but because it tumbles as it falls, it appears spherical to the radar. This means that hail would likely cause the ZDR to be close 0 dB. (Exception: Small melting hail can cause significantly higher ZDR values, because it becomes shaped similar to a large raindrop as it falls.) As we discussed in the TDS example above, correlation coefficient (CC) decreases as particle shapes become mixed. Typically hail will be mixed with rain, and the sizes of the actual hail stones will be variable, thus leading to a lower CC. CC values between 0.7 and 0.95 are typical for hail, with values on the lower end (less than 0.85) often indicative of "giant hail" (greater than 2" in diameter). Specific Differential Phase (KDP) values vary significantly depending on the type of hail being detected by the radar. If the hail is melting and coated in water, KDP values can be above 1.5 deg/km. On the other hand, drier hail that is not coated in water can result in KDP values near 0. However, it is important to keep in mind that KDP is not computed in areas of low CC, which means there may not even be KDP values in an area where large hail is occurring.
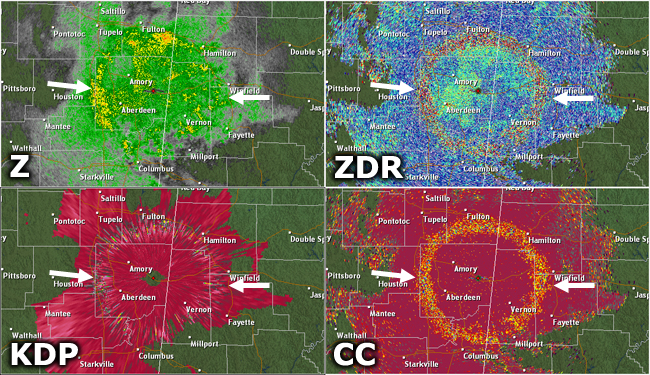
Real-life example: This is another example from the severe weather outbreak on March 2, 2012. This particular storm tracked to the north of Huntsville, AL, and golf ball size hail was reported in this particular location. The base reflectivity data shows the possibility for very heavy rain, hail, or some combination of both, with values as high as 73 dBZ! Taking a look at the dual-pol variables, we this high reflectivity is collocated with ZDR values generally around 0, meaning there is probably hail, and it does not appear to be significantly melting. In contrast, there are higher ZDR values elsewhere in the storm, indicative of rain. The CC product indicates several range bins below 0.9, and as low as 0.7, which indicates some of the hail could be large. And in fact, the CC is low enough at some point that there are areas of no data in the KDP product.
Melting Layer
Knowledge of the location of the melting layer is crucial in many near-term forecasting applications. During severe weather, the height of this layer has large implications on the probability that a particular storm will produce hail. During winter weather the height of the melting layer has impacts on precipitation type at the surface. Fortunately dual pol products can help us to find this layer more easily.
How it works: The radar's Melting Layer Detection Algorithm (MLDA) creates a derived product, which we can consult to quickly determine the radar's best guess at the location of the melting layer. However, we can also consult the actual dual pol products to find the melting layer ourselves.
Traditionally, the melting layer could at times be detected in reflectivity data. "Bright-banding" is a radar reflectivity phenomenon in which precipitation appears to be heavier in a localized area (which, using most radar color tables, causes brighter colors to appear on the radar display), when in reality the radar is detecting melting snowflakes. Because the snowflakes are melting, liquid water begins to surround the flakes making them appear similarly in the reflectivity product to an area of large raindrops. This is why the radar appears to be detecting heavier precipitation. Often times a "bright band" will appear in a ring-like shape encircling the radar, which means liquid precipitation is occurring at the surface, but as the radar beam goes higher (as it moves farther away from the radar site), it is passing through a layer of melting precipitation. It is usually easiest to see this signature on higher tilts of the radar.
The melting layer isn't always easy to find in the reflectivity product. Fortunately, the melting layer exhibits a similar ring shaped feature around the radar site in multiple dual-pol products. In the differential reflectivity (ZDR) product, we should see a concentrated area of noisy data consisting of mainly positive values. In the same area, the correlation coefficient (CC) product should indicate a band of lower values (recall, CC is an indicator of echo consistency, so if there are mixed precipitation types values are lower). Finally, the Specific Differential Phase (KDP) product will likely be noisy in the melting layer. As is the case with reflectivity, it is also usually easier to see these signatures when looking at higher tilts of the radar.
It is important to note that the melting layer is easiest to detect when there is sufficient coverage of actual radar echoes. If there is no data at the location of the melting layer, we cannot use radar to detect it. Also, if temperatures are below freezing throughout the entire lower atmosphere, there will be no melting layer.
Real-life example: This example is from the evening of November 11, 2012 in the Golden Triangle area. An approaching cold front was bringing a band of showers with embedded thunderstorms across northern Mississippi. Surface temperatures were in the middle 60s across the area, so there was a melting layer present above the surface. The example below is from the Columbus Air Force Base WSR-88D in Monroe County. In this case, we'll look at the 4.5 degree elevation angle scan for each product. Note that some bright-banding can be seen in the base reflectivity product, but it may be difficult to delineate between bright-banding due to melting and areas of legitimately heavy rainfall closer to the radar. On the other hand, it is much easier to see a ring around the radar on both the ZDR and CC products. While the melting layer is a bit more difficult to see in the KDP product, you can still detect a ring of somewhat noisier data. At the location of these signatures, the radar beam height was between 9,000 ft and 11,000 ft. Those heights indicate the approximate top and bottom of the melting layer.
Interestingly around the same time, the derived melting layer product appeared to be having a difficult time determining the correct melting layer. Take a look at the plotted melting layer product below. Note that the ring of lower correlation coefficient appears to be higher and farther away from the radar than the algorithm is indicating. This serves as an important reminder that it is always best to verify derived products with base data products.

Winter Precipitation Detection
One of the most difficult parts of precipitation analysis during a winter storm is delineating areas of different precipitation types. Meteorologists typically start by making assumptions about the current state of the atmosphere based on observed weather balloon data and forecast model data. Using this information we determine what precipitation type is expected in each location. We then rely on ground truth reports from automated weather stations, weather observers, spotters, and the public to further refine our analysis of the situation. While this system has served us fairly well in the past, it does have some shortcomings. Obviously, if we aren't receiving quality ground-truth reports, there is the potential for our assumptions about precipitation type to be very wrong in terms of location and timing.
Fortunately, dual-pol gives us an additional set of data that we can use to even better calibrate our understanding of what precipitation types are occurring in different locations. With dual-pol, we can usually determine with a reasonable amount of certainty the type of precipitation that is occurring at radar beam level (this height varies depending on distance from the radar). It is important to note that many changes may take place below the radar beam. Frozen precipitation can melt. Liquid precipitation can refreeze. For these reasons, dual-pol is most helpful during winter situations for precipitation close to the radar.
How it works: When it comes to winter weather analysis in dual-pol, things can get very complicated. There are some situations when the precipitation type will be quite obvious, and others when there is little to no certainty. Regardless, in most every situation, we start by looking for the melting layer. For information on how to find the melting layer, see the section above. If there is no melting layer during a winter weather situation, there are two possible precipitation types: snow and freezing drizzle. Snow would occur when there is sufficient moisture in the snow growth region (the area in the atmosphere where temperatures are generally around -15°C to -10°C). If the moisture is very shallow, then freezing drizzle is a possibility. Again though, we must be mindful of temperatures below the radar beam to best determine what might be reaching the ground.
On the other hand, if we do find a melting layer, then there are several additional possibilities. First, inside of the melting layer "ring", rain, freezing rain, or sleet are the possible precipitation types. If temperatures are above freezing from the bottom of the melting layer all the way to the ground, then it would be rain. If there is a deep and cold enough refreezing layer below the melting layer, then sleet would be the precipitation type. For freezing rain, there would need to be a shallow layer of subfreezing air at the surface, causing the liquid precipitation to freeze on contact.
Outside of the melting layer "ring", precipitation detected by the radar is likely snow. However, the type of precipitation reaching the ground is dependent on the atmospheric temperature profile below the radar beam. Thus in these areas, it is important to continue to lean on other types of analysis (observed data, forecast model data) to best determine the likely precipitation type.
There are some guidelines with respect to the types of values you might expect to see in dual-pol data for winter precipitation. Keep in mind that these values are only guidelines and not hard and fast rules. Most winter weather situations are complex. For dry snow, reflectivity is typically low (less than 35 dBZ), CC is typically high (around 0.97 to 1.01), ZDR is typically low (-0.3 to 1.5 dB), and KDP is typically low (-1 to 0.5 deg/km). For wet and melting snow, expect moderate reflectivity (25 to 50 dBZ), lower CC (0.88 to 0.985), some higher ZDR values (-0.5 to 3 dB), and low KDP (-1 to 0.5 deg/km). Because freezing rain is still liquid as it falls, it will appear the same on radar as "regular" rain. Reflectivity values will vary depending on rainfall intensity, CC should be high (0.95 or higher), ZDR will vary depending on drop size, and KDP will vary depending on drop size and concentration. When the radar detects mixed precipitation types, reflectivity will typically be high, ZDR will typically be high, and CC will typically be low.


 Follow us on YouTube